The GUIs discussed in this book, DDD and Eclipse, serve as front ends to GDB for C and C++ and to other debuggers. While the GUIs have eye appeal and can be more convenient than the text-based GDB, our point of view in this book will be that text-based and GUI-based debuggers (including IDEs) are all useful, in different contexts.
To quickly get an idea of the differences between text-based and GUI debugging tools, let's consider a situation that we will use as a running example in this chapter. The program in the example is insert_sort. It is compiled from a source file ins.c, and it performs an insertion sort.
To initiate a debugging session on this program with GDB, you would type
$ gdb insert_sort
at the Unix command line, after which GDB would invite you to submit commands by displaying its prompt:
(gdb)
Using DDD, you would begin your debugging session by typing
$ ddd insert_sort
at the Unix command line. The DDD window would come up, after which you would submit commands through the GUI.
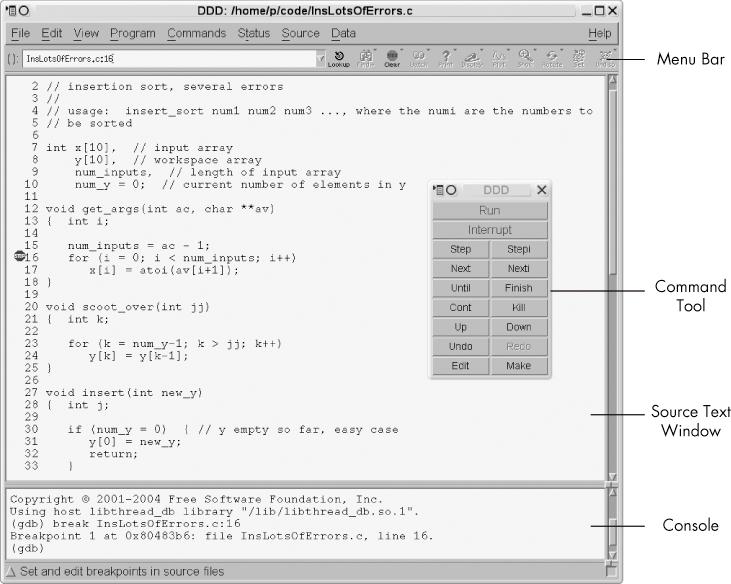
The typical appearance of a DDD window is shown in Figure 1-1. As you see, the DDD window lays out information in various subwindows:
The Source Text window displays your source code. DDD begins its display at your
main()function, but you can of course move to other parts of the source file by using the scroll bar at the right edge of the window.The Menu Bar presents various menu categories, including File, Edit, and View.
The Command Tool lists the most common DDD commands (such as Run, Interrupt, Step, and Next), so that you can access them quickly.
The Console: Recall that DDD is simply a GUI front end to GDB (and to other debuggers). DDD translates selections made with the mouse to the corresponding GDB commands. These commands and their output are displayed in the Console. In addition, you can submit commands to GDB directly via the Console, which is a handy feature because not all GDB commands have DDD counterparts.
The Data window shows the values of variables that you have requested to be continuously displayed. This subwindow will not appear until you have made such a request, so it does not appear in this figure.
Here is a quick example of how a typical debugging command is submitted to the debugger under each type of user interface. When debugging insert_sort, you may wish to pause execution of the program—to set a breakpoint—at line 16 (say) of the function get_args(). (You will see the full source code for insert_sort in Introductory Debugging Session.) To arrange this in GDB, you would type
(gdb) break 16
at the GDB prompt.
The full command name is break, but GDB allows abbreviations as long as there is no ambiguity, and most GDB users would type b 16 here. In order to facilitate understanding for those new to GDB, we will use full command names at first, and switch to abbreviations later in the book, after the commands have become more familiar.
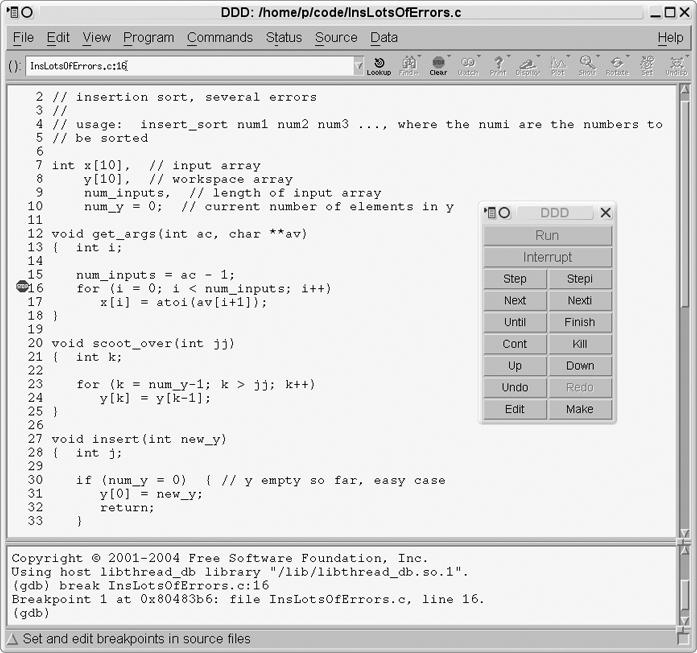
Using DDD, you would look at the Source Text window, click at the beginning of line 16, and then click the Break icon at the top of the DDD screen. You could also right-click at the beginning of the line, and then select Set Breakpoint. Yet another option is to simply double-click the line of code, anywhere to the left of the start of the line. In any case, DDD would confirm the selection by displaying a little stop sign at that line, as shown in Figure 1-2. In this way you can see your breakpoints at a glance.
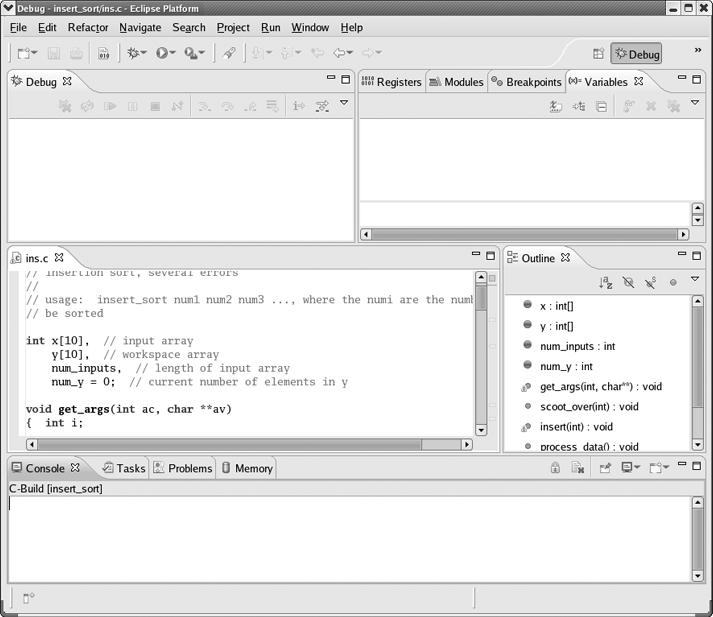
Now, Figure 1-3 introduces the general environment in Eclipse. In Eclipse terminology, we are currently in the Debug perspective. Eclipse is a general framework for development of lots of different kinds of software. Each programming language has its own plug-in GUI—a perspective—within Eclipse. Indeed, there could be several competing perspectives for the same language. In our Eclipse work in this book, we will use the C/C++ perspective for C/C++ development, the Pydev perspective for writing Python programs, and so on. There is also a Debug perspective for the actual debugging (with some language-specific features), and that is what you see in the figure.
The C/C++ perspective is part of the CDT plugin. Behind the scenes CDT invokes GDB, similar to the case of DDD.
The details of that figure are generally similar to what we described for DDD above. A perspective is broken into tabbed windows called views. You can see a view for the source file, ins.c, on the left; there is the Variables view for inspecting the values of the variables (none so far in the picture); there is a Console view, whose function is quite similar to the subwindow in DDD of the same name; and so on.
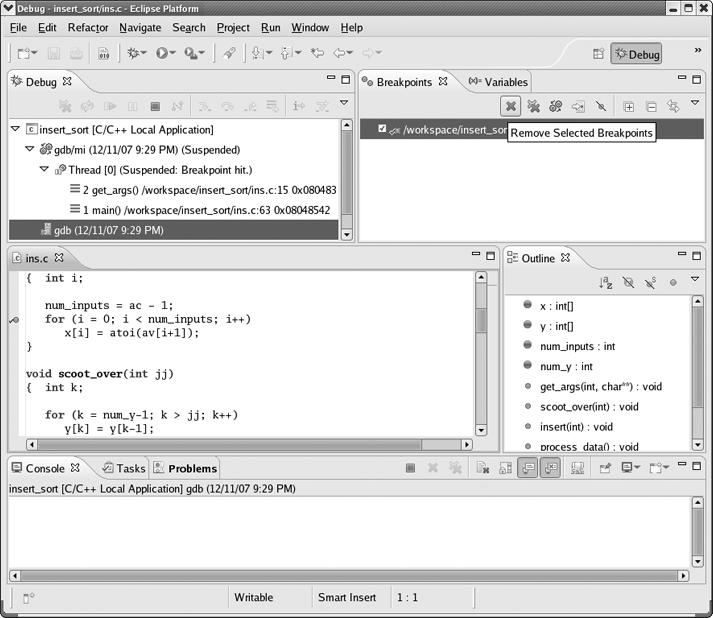
You can set breakpoints and so on visually as in DDD. In Figure 1-4, for example, the line
for (i = 0; i < num_inputs; i++)
in the source file window has a blue symbol in the left margin, symbolizing that there is a breakpoint there.
Eclipse also has some aids missing from DDD. Near the right side, for instance, note the Outline view, which lists the variables, functions and so on. If you click the entry for your function scoot_over(), for example, the cursor in the source file view will move to that function. Moreover, if you temporarily move from the Debug perspective back to the C/C++ perspective, where you are doing your editing and compiling for this project (not shown), the Outline view is at your disposal there too. This can be quite helpful in large projects.
Eclipse also better integrates the editing and compiling processes. If you have compilation errors, they are clearly marked within the editor. This can be done with the Vim editor, which both authors of this book tend to prefer over an IDE, but an IDE does it much better.
On the other hand, you can see that Eclipse, as with most IDEs, does have a major footprint on your screen (and indeed, on the pages of this book!). That Outline view is occupying precious space on the screen whether you use it much or not. Granted, you can hide the Outline by clicking the X in its right-hand corner (and if you want to get it back, select Window | Show Views | Outline), which reclaims some space, and you can also drag tabs to different locations within the Eclipse window. But in general, it may be difficult to make good use of screen space in Eclipse.
Remember that you can always execute GDB commands directly in DDD's Console. You thus have the flexibility to perform debugging commands in the most convenient way available, which is sometimes through the DDD interface and sometimes through the GDB command line. At various points in this book, you will see that there are a number of actions you can take with GDB that can make your debugging life much more convenient.
By contrast, GDB is mostly transparent to Eclipse users, and while the old saying "Ignorance is bliss" may often apply, the transparency means you lose easy access to the labor-saving actions made possible by direct usage of GDB. As of this writing, a determined user can still directly access GDB by clicking the GDB thread in Debug and then using the Console, though minus the GDB prompts. However, this "undocumented feature" may not survive in future versions.
The GUI interfaces provided by DDD and Eclipse are more visually appealing than that of GDB. They also tend to be more convenient. For instance, suppose that you no longer want execution to pause at line 16 of get_args(), that is, you wish to clear the breakpoint. In GDB you would clear the breakpoint by typing
(gdb) clear 16
However, in order to do this, you need to remember the line number of the breakpoint—not an easy task if you have many breakpoints active at once. You could refresh your memory by using GDB's info break command to get a list of all the breakpoints, but it would still be a bit of work and would distract from the focus on finding the bug.
In DDD your task would be far simpler: To clear a breakpoint, simply click the stop sign at the desired line, then click Clear, and the stop sign would disappear, showing that the breakpoint has been cleared.
In Eclipse, you would go to the Breakpoints view, highlight the breakpoint(s) you want to remove, and then move the mouse cursor to the gray X, which symbolizes the Remove Selected Breakpoints operation (see Figure 1-4). Alternatively, you can right-click the blue breakpoint symbol in the source code window and select Toggle Breakpoint.
One task for which the GUIs are clear winners is stepping through code. It is much easier and more pleasant to do this using DDD or Eclipse rather than GDB, because you can watch your movement through the code in the GUI's source code window. The next line in your source code to be executed is indicated by an arrow, as shown for DDD in Figure 1-5. In Eclipse, your next line is highlighted in green. You can thus tell at a glance where you are relative to other program statements of interest.
So, the GUIs have many advantages over the text-based GDB. Yet a sweeping conclusion based on this example that the GUIs are better than GDB would be unjustified.
Younger programmers who have grown up using GUIs for everything they do online naturally prefer GUIs to GDB, as do many of their older colleagues. On the other hand, GDB has some definite advantages, too:
GDB starts up more quickly than DDD, a big advantage when you just need to quickly check something in your code. The difference in startup times is even greater in the case of Eclipse.
In some cases, debugging is performed remotely via an SSH (or a telnet) connection, say from a public terminal. If you lack an X11 setup, the GUIs cannot be used at all, and even with X11, the screen refresh operations of the GUIs may be slow.
When debugging several programs that work in cooperation with each other—for example, a client/server pair in a networked environment—you need a separate debugging window for each program. It is a little better in Eclipse than in DDD, as Eclipse will allow you to debug two programs simultaneously in the same window, but this does compound the space problems cited earlier. Thus the small visual footprint that GDB occupies on the screen compared to the GUI's larger footprint is a big advantage.
If the program you are debugging has a GUI, and you use a GUI-based debugger such as DDD, they can clash. The GUI events—keystrokes, mouse clicks, and mouse movements—of one can interfere with those of the other, and the program may behave differently when run under the debugger than it does when run independently. This can seriously complicate finding bugs.
For those unaccustomed to the amount of typing required by GDB compared to the convenient mouse operations of the GUIs, it must be noted that GDB includes some typing-saving devices that make its text-based nature more acceptable. We mentioned earlier that most of GDB's commands have short abbreviations, and most people use these instead of the full forms. Also, the CTRL-P and CTRL-N key combinations allow you to scroll through previous commands and edit them if you wish. Simply hitting the ENTER key repeats the last command issued (which is very useful when repeatedly performing the next command to step through code one line at a time), and there is a define command that allows the user to define abbreviations and macros. Details of these features will be presented in Chapters Chapter 2 and Chapter 3.
We consider both GDB and the GUIs to be important tools, and this book will present examples of GDB, DDD, and Eclipse. We will always begin treatment of any particular topic with GDB, as it is the commonality among these tools, then show how the material extends to the GUIs.
Since version 6.1, GDB has offered a compromise between text-based and graphical user interaction in the form of a mode named TUI (Terminal User Interface). In this mode, GDB splits the terminal screen into analogs of DDD's Source Text window and Console; you can follow the progress of your program's execution in the former while issuing GDB commands in the latter. Alternatively, you can use another program, CGDB, which offers similar functionality.
To run GDB in TUI mode, you can either specify the option -tui on the command line when invoking GDB or type CTRL-X-A from within GDB while in non-TUI mode. The latter command also toggles you out of TUI mode if you are currently in it.
In TUI mode, the GDB window is divided into two subwindows—one for GDB commands and one for viewing source code. Suppose you start GDB in TUI mode on insert_sort and then execute a couple of debugging commands. Your GDB screen may then look like this:
    11
    12      void get_args(int ac, char **av)
    13      {  int i;
    14
    15         num_inputs = ac - 1;
 *  16         for (i = 0; i < num_inputs; i++)
  > 17            x[i] = atoi(av[i+1]);
    18      }
    19
    20      void scoot_over(int jj)
    21      {  int k;
    22
    23             for (k = num_y-1; k > jj; k++)                        .

 File: ins.c    Procedure: get_args    Line: 17      pc: 0x80484b8
--------------------------------------------------------------------------
(gdb) break 16
Breakpoint 1 at 0x804849f: file ins.c, line 16.
(gdb) run 12 5 6
Starting program: /debug/insert_sort 12 5 6

Breakpoint 1, get_args (ac=4, av=0xbffff094) at ins.c:16
(gdb) next
(gdb)
The lower subwindow shows exactly what you would see if you were using GDB without TUI. Here, this subwindow shows the following things:
We issued a
breakcommand to set a breakpoint at line 16 in the current source file.We executed
runto run the program, passing it the command-line arguments 12, 5, and 6, after which the debugger stopped execution at the specified breakpoint. (runand the other GDB commands will be explained later.) GDB reminds us that the breakpoint is at line 16 of ins.c and informs us that the machine code for that source line resides at memory address0x804849f.We issued a
nextcommand to step to the next line of code, line 17.
The upper subwindow offers some extra, visually helpful information. Here TUI shows us the source code surrounding the line currently being executed, just as DDD and Eclipse would. This makes it much easier to see where we are in the code. The breakpoint and the line currently being executed are indicated with an asterisk and a > sign, respectively, analogous to DDD's stop sign and green arrow icons.
We can move to other parts of the code by using the up and down arrow keys to scroll. When not in TUI mode, you can use the arrow keys to scroll through previous GDB commands, in order to modify or repeat them. In TUI mode, the arrow keys are for scrolling the source code subwindow, and you scroll through previous GDB commands by using CTRL-P and CTRL-N. Also, in TUI mode, the region of code displayed in the source code subwindow can be changed using GDB's list command. This is especially useful when working with multiple source files.
By making use of GDB's TUI mode and its typing shortcuts, we can attain a lot of the GUIs' extra functionality without incurring the GUIs' disadvantages. Note, however, that in some circumstances TUI may not behave quite as you want it to, in which case you will need to find a workaround.
Another interface to GDB that you may wish to consider is CGDB, available at http://cgdb.sourceforge.net/. CGDB also offers a compromise between a text-based and a GUI approach. Like the GUIs, it serves as a front end to GDB. It's similar to the terminal-based TUI concept, but with the additional enticements that it is in color and you can browse through the source code subwindow and set breakpoints directly there. It also seems to handle screen refresh better than GDB/TUI does.
Here are a few of CGDB's basic commands and conventions:
Hit ESC to go from the command window to the source code window; hit i to get back.
While in the source window, move around by using the arrow keys or vi-like keys (j for down, k for up, / to search).
The next line to be executed is marked by an arrow.
To set a breakpoint at the line currently highlighted by the cursor, just hit the spacebar.
Breakpoint lines have their line numbers highlighted in red.


