Economic value added (EVA) and weighted average cost of capital (WACC)

The economic value added (EVA) is a method to express the financial performance of an organisation. It expresses the performance of an organisation as its profits minus the cost of financing the organisation’s activities. The idea is that value is created (added) when the profit exceeds the costs (see Figure 29.1). The concept of EVA was introduced by consulting firm Stern Stewart & Co (Stewart, 1990).
The original purpose of EVA was to include two principles in management’s decision-making: (1) the objective of a company is to maximise shareholder value; and (2) the value of a company depends on the extent to which future profits differ (positively) from the cost of capital needed to generate those profits. It was introduced to make better decisions regarding the organisation’s strategy and the future activities it should pursue and invest in. Nowadays EVA is used not only for making investment decisions within organisations, e.g. investments in capital projects, but also for investments in companies (as a shareholder).
Economic value added helps to assess which alternative provides the best return, expressed as the highest value added. Analysing the economic value added gives an insight into how the proposed investment will perform relative to the risk (expressed as the cost of capital) to which it is exposed. The best performing projects (or companies) will exceed the cost incurred to finance them (or, in other words, they will exceed the required minimal return on the capital employed).
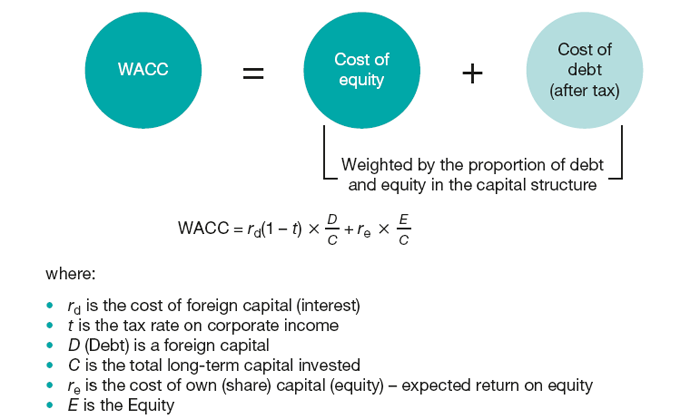
Figure 29.1 Economic value added
Often EVA is seen as an elaboration on value-based management (VBM, see Chapter 34). Used especially for capital budgeting and investment analysis, EVA allows investments to be tested against the required capital charge. Properly executed, this approach aligns all activities and decision-making on the key drivers of value.
In particular, the inclusion of the cost of capital employed to realise the performance, the calculation of the WACC, is often used as alternative to NPV (see DCF and NPV, Chapter 27). In NPV a required rate of return is used as discount rate. This rate is often based on a risk-free rate plus a risk premium. An alternative discount factor can be the WACC. This already includes the costs the organisation has to incur to attract the funding for the project or investment decision. The WACC takes into account both the cost of using own means (backed by the organisation’s equity) and the cost of using loans or externally attracted capital. These costs typically include the risk premium, as these are discounted in the interest rates of external funding parties and they are discounted in the expected return on equity (dividends) by shareholders.
The EVA model consist of two elements:
The NOPAT is calculated starting with the earnings before interest and taxes (EBIT), thus after depreciations and amortisations, and correcting this for all other items that influence operational performance and thus the profit statement. Then taxes are deducted, resulting in the NOPAT. This calculation is fairly straightforward, although the corrections to operational performance, such as amortisation of goodwill or depreciation of inventories, can sometimes be a bit more complex.
The WACC is more complex to calculate. Calculating this starts with identifying the cost of capital for each type of funds used. The costs for loans from external parties are the most obvious (the interest rate), but funds based on the organisation’s equity also have a cost. And as some costs –in some countries – are tax-deductible (such as interest on some types of loans), it is important to express the costs as after-tax costs. Next, for each source of funds, the weight is calculated, i.e. the percentage of the total funding of the organisation. The WACC is then calculated as the sum of the costs of each source times the weight of that source in the overall funding, using the formula in Figure 29.2.
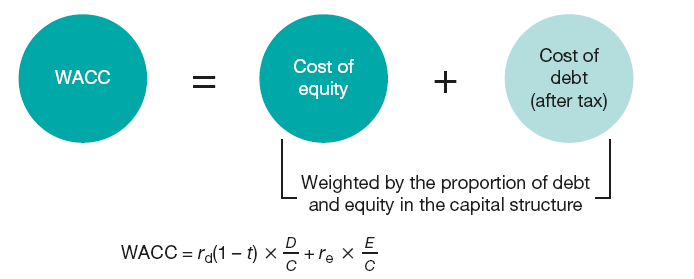
Figure 29.2 Weighted average cost of capital.
Ultimately, the EVA can be calculated by subtracting the total cost of capital from the total profit from activities.
By taking into account the cost of all capital employed for performing the organisation’s activities, the EVA shows the financial amount of wealth a business creates (or destroys). For that reason, it is popular with shareholders and investors for comparing companies and equity investments. For comparison based on similar intentions, an alternative measure is used also that employs elements of EVA: the calculation of return on net assets (RONA). RONA is a ratio that is calculated by dividing a firm’s NOPAT by the amount of capital it employs (RONA = NOPAT/capital employed). This ratio does not, however, include the cost of capital employed and is therefore less suited to investment decisions for which the type of capital employed is of importance, such as decision-making within organisations regarding what business or what capital projects to invest in.
Although EVA is at first sight a very clear and easy-to-understand concept, the mathematics are less easy. Both the calculation of NOPAT and the calculation of WACC require some advanced understanding of accounting and of the EVA method. Next to its complexity there are also many modifications to EVA, varying from alternative methods for calculating the cost of equity, such as the capital asset pricing model (CAPM, see Chapter 26), to alternative methods for expressing the value of the organisation as a whole, such as the market value added model.
Stewart, G.B. (1990) The Quest for Value. New York: HarperCollins.
Walsh, C. (2008) Key Management Ratios: the 100+ Ratios Every Manager Needs to Know. Harlow: Pearson.
Young, S.D. and O’Byrne, S.F. (2000) EVA and Value-based Management: A Practical Guide to Implementation. McGraw-Hill.