 |
|
In the geochemist’s arsenal of techniques for unraveling geological problems, the study of radioactive isotopes and their decay products has become very prominent. This chapter begins with a discussion of nuclide stability and decay mechanisms. After equations that describe radioactive decay are derived, we examine the utility of certain naturally occurring radionuclide systems (K-Ar, Rb-Sr, Sm-Nd, and U-Th-Pb) in geochronology. The concept of extinct radionuclides that were present in the early solar system is also discussed. The principles behind both mass spectrometry and fission track techniques are introduced. We discuss how induced radioactivity can be used to solve geochemical problems. Examples include neutron activation analysis, 40Ar-39Ar dating, and the use of cosmogenic nuclides (14C and 10Be) for dating geological and archeological materials and for detecting the subduction of sediments. We explore how radionuclides can be used as geochemical tracers in such global problems as determining when the Earth accreted and differentiated, quantifying mantle heterogeneity, assessing the cycling of material between crust and mantle, revealing global oceanic mixing patterns, and understanding degassing of the Earth’s interior to produce the atmosphere.
In chapter 13, we learned how stable isotopes can be used to solve geochemical problems. The study of unstable (that is, radioactive) nuclides, considered in this chapter, is also an extremely powerful technique. In chapter 2, we saw that only ∼260 of the 1700 known nuclides are stable, so we can infer that nuclide stability is the exception rather than the rule. Most of the known radioactive isotopes do not occur in nature. Although some of these may have occurred naturally in the distant past, their decay rates were so rapid that they have long since been transformed into other nuclides. In most cases, radioactive isotopes that are of interest to geochemists require very long times for decay or are produced continually by naturally occurring nuclear reactions.
In chapter 13, we explored how variations in stable isotopes are caused by mass fractionation during the course of chemical reactions or physical processes. With the exception of radioactive 14C and a few other nuclides, the atomic masses of most of the unstable isotopes of geochemical interest are very large, so that mass differences with other nuclides of the same element are minuscule. Consequently, these isotopic systems can be considered to be immune to mass fractionation processes. Thus, all of the measured variations in these nuclides are normally ascribed to radioactive decay.
Radioactivity is the spontaneous transformation of an unstable nuclide (the parent) into another nuclide (the daughter). The transformation process, called radioactive decay, results in changes in N (the number of neutrons) and Z (the number of protons) of the parent atom, so that another element is produced. Such processes occur by emission or capture of a variety of nuclear particles. Isotopes produced by the decay of other isotopes are said to be radiogenic. The radiogenic daughter may be stable or unstable; if it is unstable, the decay process continues until a stable nuclide is produced.
Beta decay involves the emission of negatively charged beta particles (electrons emitted by the nucleus), commonly accompanied by radiation in the form of gamma rays. This is equivalent to the transformation of a neutron into a proton and an electron. As illustrated in figure 14.1, Z increases by one and N decreases by one for each beta particle emitted.
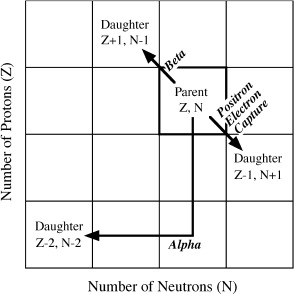
FIG. 14.1. A portion of the nuclide chart illustrating the N-Z relationships for daughter nuclides formed from a hypothetical parent by emission of beta particles, positrons, alpha particles, or by electron capture.
Another type of radioactivity occurs as a result of positron decay. A positron is a positively charged electron expelled from the nucleus. This process can be regarded as the conversion of a proton into a neutron, a positron, and a neutrino (a particle with appreciable kinetic energy, but without mass). Positron decay produces a nuclide with N increased by one and Z decreased by one, as illustrated in figure 14.1.
Inspection of figure 14.1 allows us to predict which nuclides tend to transform by beta decay or positron decay. Unstable atoms that lie below the band of stability (as seen in fig. 2.3), and therefore have excess neutrons, are likely to decay by emission of beta particles, so that their N values are reduced. Similarly, nuclides that lie above the band of stability, having excess protons, may experience positron decay. In each case, these processes occur in such a way that the resulting daughter nuclides fall within the band of nuclear stability.
An alternate type of decay mechanism is electron capture. In this process, the nuclide increases its N and decreases its Z by addition of an electron from outside the nucleus. A neutrino is also liberated during this process. The daughter nuclide produced during electron capture occupies exactly the same position relative to its parent in figure 14.1 as that produced during positron decay.
Alpha decay proceeds by the emission of heavy alpha particles from the nucleus. An alpha particle is composed of two neutrons and two protons. Therefore, the N and Z values for the daughter nuclide both decrease by two, as shown in figure 14.1.
To be complete, we should also add to this list of radioactive decay processes spontaneous fission, which is an alternate mode of decay for some heavy atomic nuclei. These atoms may break apart, because electrostatic repulsion between the Z positively charged protons overcomes the strong nuclear binding force. Fission products generally have excess neutrons and tend to decay further by beta emission. For most geochemical applications, fission can be considered a relatively minor side effect.
The decay of natural radionuclides may be much more complex than suggested by the simple decay mechanisms just introduced. A particular transformation may employ several of these decay mechanisms simultaneously, so that the parent atoms form more than one kind of daughter. Such a process is called branched decay. As an example, consider the decay of 40K. Most atoms of the parent nuclide decay by positron emission and electron capture into 40Ar, but 40Ca is produced from the remainder by beta decay. Branched decay decreases the yield of daughter atoms of a particular nuclide, requiring more sensitivity in measurement.
Worked Problem 14.1
How many atoms of 40Ar would be produced by the complete decay of 40K in a 1 cm3 crystal of orthoclase? To answer this question, we must first calculate the number of atoms of parent 40K in the sample. We can convert the volume of orthoclase to weight by multiplying by its density, and weight to moles by dividing by the gram formula weight of orthoclase:
1 cm3(2.59 g cm−3)/ 278.34 g mol−1 = 9.30 × 10⁻³ mol.
Each mole of orthoclase contains one mole of potassium, so there are 9.30 × 10⁻³ moles of K in this sample. Multiplication of this result by Avogadro’s number gives the number of atoms of potassium:
9.30 × 10⁻³ mol (6.023 × 10²³ atoms mol−1) = 5.60 × 10¹⁹ atoms.
The natural abundance of 40K in potassium (before decay) is 0.01167%. Therefore, this orthoclase sample contains:
5.60 × 10¹⁹ atoms (1.167 × 10⁻⁴) = 6.535 × 10¹⁵ atoms 40K.
We have already mentioned that 40K undergoes branched decay, and we are concerned here with only one of the daughter nuclides. A total of 11.16% of the 40K atoms decay into 40Ar by electron capture and positron decay, the remainder transforming to 40Ca. Consequently, the number of atoms of 40Ar produced by complete decay is:
6.535 × 10¹⁵ (0.1116) = 7.293 × 10¹⁴ atoms 40Ar.
In each of the decay mechanisms just discussed, the rate of disintegration of a parent nuclide is proportional to the number of atoms present. In more quantitative terms, the number of atoms (because of convention, we use the symbol N, not to be confused with the symbol for the number of neutrons used in earlier paragraphs) remaining at any time t is:
−dN/dt = λN,
where λ is the constant of proportionality, usually called the decay constant. The value of the decay constant is characteristic for a particular radionuclide and is expressed in units of reciprocal time. Rearranging the terms of equation 14.1 and integrating gives:

or
−ln N = λt + C,
where C is the constant of integration. If N = N0 at time t = 0, then:
C = −ln N0.
By substituting this value into equation 14.2, we obtain:
−ln N = λt − ln N0,
or
ln N/N0 = −λt.
This is more commonly expressed as:
N/N0 = e−λt.
Equation 14.3 is the basic relationship that describes all radioactive decay processes. With it, we can calculate the number of parent atoms (N) that remain at any time t from an original number of atoms (N0) present at time t = 0.
We can also express this relationship in terms of atoms of the daughter nuclide rather than the parent. If no daughter atoms are present at time t = 0 and none are added to or lost from the system during decay, then the number of radiogenic daughter atoms produced by decay D* (not to be confused with the same symbol used for tracer diffusion coefficients in chapter 11) at any time t is:
D* = N0 − N.
By rearranging equation 14.3 and substituting it into 14.4, we see that:
D* = Neλt − N,
or
D* = N(eλt − 1).
Equation 14.5 gives the number of daughter atoms produced by decay at any time t as a function of parent atoms remaining. If some atoms of the daughter nuclide were present initially (D0), then the total number of daughter atoms (D) is:
D = D0 + D*.
Combining this equation with 14.5 produces the useful result:
D = D0 + N(eλt − 1).
This important equation is the basis for geochronology. Both D and N are measurable quantities, and D0 is a constant whose value can be determined.
It is common practice to express radioactive decay rates in terms of half-lives. The half-life (t1/2) is defined as the time required for one-half of a given number of atoms of a nuclide to decay. Therefore, when t = t1/2, it follows that  . Substitution of these values into equation 14.3 gives:

or

This is equivalent to:
ln 2 = λt1/2.
Solving for t1/2 gives:
t1/2 = ln 2/λ = 0.693/λ.
Equation 14.7 expresses the relationship between the half-life of a nuclide and its decay constant.
The equations above show that the disintegration of a parent radioactive isotope and the generation of daughter nuclides are both exponential functions of time. This is illustrated in the following worked problem.
Worked Problem 14.2
Follow the decay of radioactive parent 87Rb and the growth of daughter 87Sr in a granite sample over the course of six half-lives. Assume that the granite sample initially contains 1.2 × 10²⁰ atoms of 87Rb and 0.3 × 10²⁰ atoms of 87Sr.
The half-life of 87Rb is 48.8 × 10⁹ years. The decay constant for this radionuclide can be calculated by using equation 14.7:
λ = 0.693/(48.8 × 109 yr) = 1.42 × 10⁻¹¹ yr−1.
Using equation 14.3, we can determine the number of atoms (N) of parent 87Rb remaining after one half-life:
N/(1.2 × 1020) = e−(1.42 × 10⁻¹¹)(48.8 × 10⁹),
or
N = 6.00 × 10¹⁹ atoms after one half-life.
To calculate the number of atoms of the parent nuclide remaining after two half-lives, we substitute for N0 in the same equation the value of N just calculated:
N/6.00 × 1019 = e−(1.42 × 10⁻¹¹)(48.8 × 10⁹),
or
N = 3.00 × 10¹⁹ atoms after two half-lives,
and so forth.
To calculate the number of atoms (D) of daughter 87Sr after one half-life, we use equation 14.6:
D = 0.3 × 10²⁰ + 6.00 × 10¹⁹[e(1.42 × 10⁻¹¹)(48.8 × 10⁹) − 1]
or
D = 9.00 × 10¹⁹ atoms after one half-life.
We follow a similar procedure for calculating daughter atoms after each successive half-life.
The easiest way to summarize these calculations is by means of a graph, plotting the number of atoms of parent (N) or daughter (D) versus time in units of half-life. This diagram is shown in figure 14.2. The exponential character of the radioactive decay is obvious. After six half-lives, N approaches zero asymptotically and, for most practical purposes, the production of daughter atoms ceases.
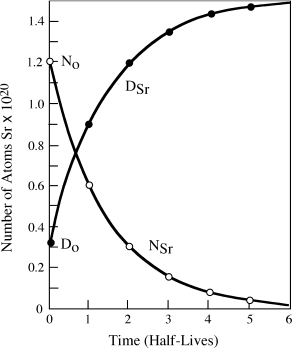
FIG. 14.2. The decay of radioactive 87Sr (N) into its stable radiogenic daughter, 87Rb (D), as a function of time measured in half-lives. N0 and D0 represent the initial number of atoms of parent and daughter, respectively.
Decay Series and Secular Equilibrium
The calculations above presume that a radioactive parent decays directly into a stable daughter. However, many radionuclides decay to a stable nuclide by way of transitory, unstable daughters; that is, a parent N1 may decay to a radioactive daughter N2, which in turn decays to a stable daughter N3. Naturally occurring decay series arising from radioactive isotopes of uranium and thorium behave in this manner. For example, 238U produces 13 separate radioactive daughters before finally arriving at stable 206Pb, as illustrated in figure 14.3. Equations giving the number of atoms of any member of a decay series at any time t are presented in a text by Gunter Faure (1986), and will not be reproduced here. It is interesting, however, to examine the special case in which the half-life of the parent nuclide is very much longer than those of the radioactive daughters. In this situation, it can be shown that after some initial time interval has passed,
λ1N1 = λ2N2 = λ3N3 = λnNn,
where λ1, 2, . . ., n are the decay constants for each nuclide (N) in the series. This condition, in which the rate of decay of the daughters equals that of the parent, is known as secular equilibrium. It allows an important simplification of decay series calculations, because the system can be treated as if the original parent decayed directly to the stable daughter without intermediate steps. Secular equilibrium is assumed in uranium prospecting methods that utilize radiation measurements to calculate uranium abundances.
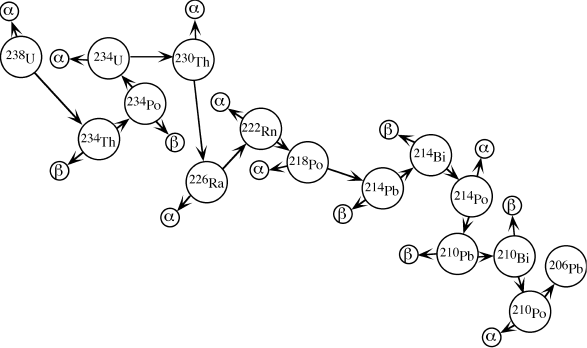
FIG. 14.3. Representation of the radioactive decay of 238U to 206Pb through a series of daughter isotopes. Alpha and beta particles produced at each step are labeled.
One of the prime uses of radiogenic isotopes is, of course, to determine the ages of rocks. All radiometric dating systems assume that certain conditions are satisfied:
PROSPECTING AND WELL-LOGGING TECHNIQUES THAT USE RADIOACTIVITY
Uranium prospecting tools rely principally on detection of gamma radiation, because alpha and beta particles cannot penetrate an overburden cover of even a few cm thickness. The Geiger counter is commonly used for field surveys, although it is a rather inefficient detector. The instrument consists of a sealed glass tube containing a cathode and anode with a voltage applied. The tube is filled with a gas that is normally nonconducting, but when gamma radiation passes through the gas, it is ionized and the ions accelerate toward the electrodes. The resulting current pulses are recorded on a meter or heard as “clicks.”
The scintillation counter is a more efficient tool for gamma ray detection. Certain kinds of crystals scintillate; that is, they emit tiny flashes of visible light when they absorb gamma radiation. These scintillations are detected by photomultiplier tubes and converted to electrical pulses that can be counted. This instrument can be used in either ground or airborne surveys.
A commonly used well-logging tool employs natural radioactivity to identify sedimentary lithologic boundaries in drill holes. The gamma ray log depends on scintillation detection of gamma rays produced by decay of 40K and radioactive daughter products in the uranium and thorium decay series. These large ions are incompatible in most crystal structures, but are accommodated in clay minerals. Therefore, increases in gamma radiation are ascribed to clay concentrations (that is, shale formations) and, conversely, decreased radiation to cleaner sandstone or limestone units. An example of a portion of a gamma ray well log is shown in figure 14.4. Gamma rays from decay of any one nuclide have a particular energy, and the energy spectrum of this radiation is resolved in some gamma ray logs. This permits estimates to be made of the concentrations of potassium, uranium, and thorium (assuming secular equilibrium), and the K/U or K/Th ratios may serve as geochemical signatures for certain shale horizons, which may be useful in stratigraphic correlation.
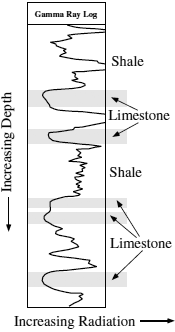
FIG. 14.4. An example of a gamma ray well log used in identifying sedimentary lithologic variations. The horizontal scale is radioactivity (increasing to the right) and the vertical scale is depth in the bore hole. Limestone horizons have low radioactivity relative to shale units because of lower contents of potassium, uranium, and thorium.
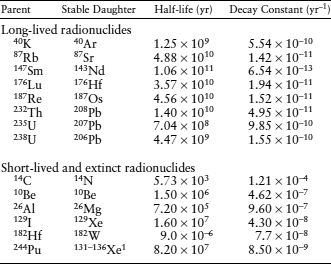
A number of naturally occurring radionuclides are in current use for geochronology; some of the most common are listed in table 14.1 and discussed below. Each of these is employed for its special properties, such as rate of decay, response to heating and cooling, or concentration range in certain rocks.
In worked problem 14.1, we have seen that radioactive 40K undergoes branching decay to produce two different daughter products. Its decay into 40Ca is not a useful chronometer, because 40Ca is also the most abundant stable isotope of calcium. As a result, the addition of radiogenic 40Ca increases its abundance only slightly. Even though 40Ar is the most abundant isotope of atmospheric argon, potassium-bearing minerals do not commonly contain argon. The radioactive decay of 40K can therefore be monitored through time by measuring 40Ar.
TABLE 14.1. Radionuclides Commonly Used in Geochronology
1Many other fission products are also produced.
Each branch of the decay scheme has its own separate decay constant. The total decay constant λ is therefore the sum of these:
λ = λCa + λAr.
The commonly adopted value for the total decay constant and the corresponding half-life are given in table 14.1. The proportion of 40K atoms that decay to 40Ar is given by the ratio of decay constants, λAr/(λAr + λCa), which has a value of 0.105.
We can use equation 14.6 to specify the increase in 40Ar through time:
40Ar = 40Ar0 + 0.105 40K(eλt − 1).
Notice that N, the number of atoms of 40K, has been multiplied by λAr/(λAr + λCa) to correct for the fact that most of these atoms will decay to another daughter nuclide. Because most minerals initially contain virtually no argon, 40Ar0 = 0 and the equation reduces to:
40Ar = 0.105 40K(eλt − 1).
Application of equation 14.8 then requires only the measurement of 40Ar and potassium in the sample; 40K is calculated from total potassium using its relative isotopic abundance of 0.01167%.
The K-Ar system is useful for dating igneous and, in a few cases, sedimentary rocks. Sediments containing glauconite and certain clay minerals that formed during diagenesis may be suitable for K-Ar chronology. However, because the daughter isotope is a gas, it may diffuse out of many minerals, especially if they have been buried deeply or have protracted thermal histories. Metamorphism appears to reset the system in most cases, and K-Ar dates may record the time of peak metamorphism in cases for which cooling was relatively rapid. During slow cooling, argon diffusion continues until the system reaches some critical temperature (the blocking temperature), at which it becomes closed to further diffusion. Different minerals in the same rock may have different blocking temperatures and thus yield slightly different ages.
87Rb produces 87Sr by beta decay, at a rate given in table 14.1. Unlike the K-Ar system, the radiogenic daughter is added to a system that already contains some 87Sr. Thus, the difficulty in applying this geochronometer lies in determining how much of the 87Sr measured in the sample was produced by decay of the parent isotope.
For the Rb-Sr system, equation 14.6 takes the form:
87Sr = 87Sr0 + 87Rb(eλt − 1).
Another isotope of strontium, 86Sr, is stable and is not produced by decay of any naturally occurring isotope. If both sides of the equation are divided by the number of atoms of 86Sr in the sample (a constant), we will not affect the equality:
87Sr/86Sr = 87Sr0/86Sr + 87Rb/86Sr(eλt − 1).
Let’s see how the initial ratio of 87Sr0/86Sr in this equation, as well as the age, can be derived from graphical analysis of a suite of rock samples. Equation 14.9 is the expression for a straight line (of the form y = b + mx). We will construct a plot of 87Sr/86Sr versus 87Rb/86Sr; that is, y versus x, as shown in figure 14.5. Both of these ratios are readily measurable in rocks. We can assume that, at the time of crystallization (t = 0), all minerals in a given rock will have the same 87Sr/86Sr value, because they cannot discriminate between these relatively heavy isotopes. The various minerals will have different contents of rubidium and strontium, however, and thus different values of 87Rb/86Sr.
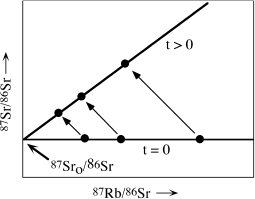
FIG. 14.5. Schematic Rb-Sr isochron diagram, illustrating the isotopic evolution of three samples with time. All samples have the same initial 87Sr/86Sr ratio but different 87Rb/86Sr ratios at time t = 0. The isotopic composition of each sample moves along a line of slope −1 as 87Rb decays to 87Sr. After some time has elapsed, the samples define a new isochron, the slope of which is (eλt − 1). Extrapolation of this isochron to the abcissa gives the initial Sr isotopic composition.
This situation is illustrated schematically by the line labeled t = 0 in figure 14.5. After some time has elapsed, a fraction of the 87Rb atoms in each mineral have decayed to 87Sr. Obviously, the mineral that had the greatest initial concentration of 87Rb now has the greatest concentration of radiogenic 87Sr. The position of each mineral in the rock shifts along a line with a slope of −1, as shown by arrows in figure 14.5. The slope of the resulting straight line is (eλt − 1), and its intercept on the y axis is the initial strontium isotopic ratio, 87Sr0/86Sr. The diagonal line is called an isochron, and its slope increases with time. The fit of data points to a straight line is never perfect, and a linear regression is required. Analytical errors that lead to dispersion of data about the line give rise to corresponding uncertainties in ages.
Isochron diagrams such as figure 14.5 can be constructed by using data from coexisting minerals in the same rock (producing a mineral isochron) or from fractionated comagmatic rock samples that have concentrated different minerals to varying degrees (producing a whole-rock isochron). Metamorphism may rehomogenize rubidium and strontium isotopes, so that the timing of peak metamorphism may be recorded by this geochronometer. A mineral isochron is more likely than a whole-rock isochron to be reset by metamorphism, because it is easier to re-equilibrate adjacent minerals than different portions of a rock body. Diagenetic minerals in some sedimentary rocks may also have high enough rubidium contents that the age of burial and diagenesis can be determined using this system. The half-life of 87Rb is long, so that this geochronometer complements the K-Ar system in terms of the accessible time range to which it can be applied.
Worked Problem 14.3
Larry Nyquist and his coworkers (1979) measured the following isotopic data for a whole-rock (WR) sample and for plagioclase (Plg), pyroxene (Px), and ilmenite (Ilm) mineral separates in an Apollo 12 lunar basalt (sample 12014).

What is the age of this rock?
We can determine the age and the initial Sr isotopic ratio, 87Sr0/86Sr, by plotting these data on an isochron diagram (fig. 14.6). A least-squares regression through the data can then be calculated, as illustrated by the diagonal line in the figure. The y intercept of this regression line corresponds to an initial isotopic ratio of 0.69964.
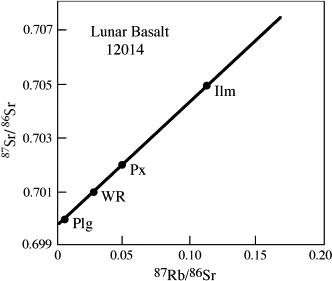
FIG. 14.6. Rb-Sr isochron for lunar basalt 12014. Isotopic data for the whole-rock (WR), pyroxene (Px), plagioclase (Plg), and ilmenite (Ilm) were obtained by Nyquist et al. (1979). The slope of this isochron corresponds to an age of 3.09 b.y.
Equation 14.9 can be solved for t:
t = 1/λ ln([(87Sr/86Sr − 87Sr0/86Sr)]/(87Rb/86Sr) + 1).
If we now insert the initial Sr isotopic ratio and the measured isotopic data for one sample (we use WR) into this expression, we find:
| t | = 1/(1.42 × 10−11) ln([(0.70096 |
| − 0.69964)/(0.0296)] + 1), |
or
t = 3.09 b.y.
This age corresponds to the time that the minerals in the basaltic magma crystallized. It differs slightly from the age published by Nyquist and coworkers, because they used a different decay constant for 87Rb than that given in table 14.1. The estimated uncertainty in age based on fitting the regression line is +0.11 billion years.
The rare earth elements samarium and neodymium form the basis for another geochronometer. 147Sm decays to 143Nd at a rate indicated in table 14.1. The complication in this system is the same as that in the Rb-Sr system; that is, some 143Nd is already present in rocks before radiogenic 143Nd is added, so we must find a way to specify its initial abundance. This can be done by graphical methods after normalizing parent and daughter to a stable, nonradiogenic isotope of neodymium (144Nd), in the same way we normalized to 86Sr in the Rb-Sr system. An expression for the Sm-Nd system analogous to equation 14.9 can then be written:
| 143Nd/144Nd | = 143Nd0/144Nd |
| + 147Sm/144Nd(eλt − 1), |
where the subscript 0 indicates the initial isotopic composition of neodymium at the time of system closure. On an isochron plot of 143Nd/144Nd versus 147Sm/144Nd, the y intercept is the initial isotopic ratio 143Nd0/144Nd and the slope of the line becomes steeper with time.
The Sm-Nd radiometric clock is analogous in its mathematical form to that of the Rb-Sr system, but the two systems are applicable to different kinds of rocks. Basalts and gabbros usually cannot be dated precisely using the Rb-Sr system, because their contents of rubidium and strontium are so low. The Sm-Nd system is ideal for determination of the crystallization ages of mafic igneous rocks. This system may also be useful, in some cases, to “see through” a metamorphic event to the earlier igneous crystallization. Because both parent and daughter are relatively immobile elements, they are less likely to be disturbed by later thermal overprints.
The U-Th-Pb system is actually a set of independent geochronometers that depend on the establishment of secular equilibrium. 238U decays to 206Pb, 235U to 207Pb, and 232Th to 208Pb, all through independent series of transient daughter isotopes. The half-lives of all three parent isotopes are much longer than those of their respective daughters, however, so that the prerequisite condition for secular equilibrium is present and the production rates of the stable daughters can be considered to be equal to the rates of decay of the parents at the beginning of the series. The half-lives and decay constants for the three parent isotopes are given in table 14.1. We refer to the decay constant for 238U as λ1, that for 235U as λ2, and that for 232Th as λ3.
In addition to these three radiogenic isotopes, lead also has a nonradiogenic isotope (204Pb) that can be used for reference. (204Pb is actually weakly radioactive, but it decays so slowly that it can be treated as a stable reference isotope.) We can express the isotopic composition of lead in minerals containing uranium and thorium by the following equations, analogous to equations 14.9 and 14.11:
| 206Pb/204Pb | = 206Pb0/204Pb |
| + 238U/204Pb (eλ1t − 1), (14.12a) |
| 207Pb/204Pb | = 207Pb0/204Pb |
| + 235U/204Pb (eλ2t − 1), (14.12b)
|
| 208Pb/204Pb | = 208Pb0/204Pb |
| + 232Th/204Pb (eλ3t − 1). (14.12c)
|
The subscript 0 in each case denotes an initial lead isotopic composition at the time the clock was set.
Each of these isotopic systems gives an independent age. In an ideal situation, the dates should all be the same. In many instances, though, these dates are not concordant, because the minerals do not remain completely closed to the diffusion of uranium, thorium, lead, or some of the intermediate daughter nuclides. To simplify this complicated situation, let’s consider a system without thorium, so that we have to deal with only two radiogenic lead isotopes. From equation 14.5, we know that the amount of radiogenic 206Pb at any time must be:
206Pb* = 238U(eλ1t − 1),
or
206Pb*/238U = eλ1t − 1,
where the superscript * denotes radiogenic lead; that is, 206Pb − 206Pb0. Similarly, the amount of radiogenic 207Pb at any time can be expressed as:
207Pb*/235U = eλ2t − 1.
If a uranium-bearing mineral behaves as a closed system, we know that equations 14.13a and 14.13b should yield concordant ages (that is, the same value of t). Logically, then, we can reverse the procedure and calculate compatible values for 206Pb*/238U and 207Pb*/235U at any given time t. Figure 14.7 shows the results of such a calculation. The curve labeled concordia in this figure represents the locus of all concordant U-Pb systems.
At the time of system closure (t0), no decay has occurred yet, so there is no radiogenic lead present. The system’s isotopic composition, therefore, plots at the origin of figure 14.7. At any time thereafter, the system is represented by some point along the concordia curve; numbers along the curve indicate the elapsed time in billions of years since formation of the system. If, instead, the system experiences loss of lead at time t1, the system’s composition shifts along a chord connecting t1 to the origin. A complete loss of radiogenic lead would displace the isotopic composition all the way back to the origin, but this rarely happens. If some fraction of lead is lost, as is the more common situation, the system composition is represented by a point (such as x) along the chord. A series of related samples with discordant ages that have experienced varying degrees of lead loss will define the chord, called a discordia curve, more precisely. After the disturbing event, each point x on the discordia evolves along a path similar in form but not coincident with the concordia curve.
The result is that the discordia curve retains its linear form but changes slope, intersecting the concordia curve at a new set of points. The time of lead loss is translated along the concordia curve to t3, and t0 is similarly translated to t2, the overall effect being a rotation of discordia about point x. This is illustrated by the dashed discordia curve in figure 14.7.
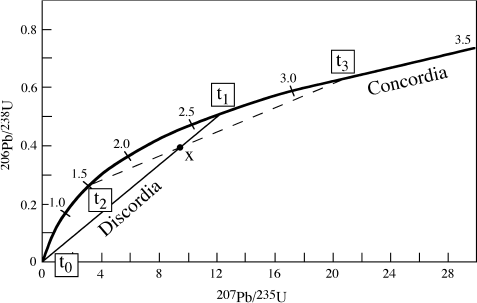
FIG. 14.7. Concordia diagram comparing isotopic data for two U-Pb systems. An undisturbed system formed at time t0 will move along the concordia curve; the age at any time after formation is indicated by numbers (in billions of years) along the curve. If episodic lead loss occurs at time t1, the position of the system will be displaced toward the origin by some amount, as illustrated by point x. Other samples that lose different amounts of lead are displaced along the same chord and give discordant dates. With further elapsed time, the discordia line will subsequently be rotated (dashed line) as t0 moves to t2 and t1 moves to t3.
If the discordia chord can be adequately defined, then this diagram may yield two geologically useful dates: the time of formation of the rock unit (t2), and the time of a subsequent disturbance (possibly metamorphism or weathering) that caused lead loss (t3). This interpretation assumes that loss of lead was instantaneous; if lead was lost by continuous diffusion over a long period of time, then t3 is a fictitious date without geologic significance. Unfortunately, it is not possible to distinguish between these alternatives without other geological information.
It is possible to compensate for the effect of lead loss on U-Pb ages by calculating ages based on the 207Pb/206Pb ratio. This ratio is, of course, insensitive to lead mobilization, because it is practically impossible to fractionate isotopes of the same heavy element. By combining equations 14.12a and 14.12b, we obtain:
(207Pb/204Pb − 207Pb0/204Pb)/(206Pb/204Pb − 206Pb0/204Pb) = (235U[eλ2t − 1])/(238U[eλ1t − 1]).
The left side of this equation is equivalent to the ratio of radiogenic 207Pb to radiogenic 206Pb; that is, to (207Pb/206Pb)*. This is determined by subtracting initial 207Pb/204Pb and 206Pb/204Pb values from the measured values for these ratios. Consequently, ages can be determined solely on the basis of the isotopic ratios in the sample, without having to determine lead concentrations. Moreover, because the ratio 235U/238U is constant (1/137.8) for all natural materials at the present time, ages can be calculated without measuring uranium concentrations. Equation 14.14a can therefore be expressed as:
(207Pb/206Pb)* = 1/137.8([eλ2t − 1]/[eλ1t − 1]).
This is the expression for the 207Pb/206Pb age, also called the lead-lead age. The only difficulty in applying this method is that equation 14.14b cannot be solved for t by algebraic methods. However, the equation can be iteratively solved by a computer method of successive approximations until a solution is obtained within an acceptable level of precision.
The U-Th-Pb dating system is applicable to rocks containing such minerals as zircon, apatite, monazite, and sphene. These phases provide large structural sites for uranium and thorium. Igneous or metamorphic rocks of granitic composition are most suitable for dating by this method. Several generations of zircons, recognizable by distinct morphologies, have been found to give distinct ages in some rocks, and measurements of U-Th-Pb ages in zoned zircons using ion microprobes have shown overgrowths with younger ages. The possibility of minerals inherited from earlier events or affected by later events further complicates the interpretation of U-Th-Pb ages.
Worked Problem 14.4
John Aleinikoff and coworkers (1985) measured the following lead isotopic data for a zircon from a granitic pluton in Maine (units are atom %): 204Pb = 0.010, 206Pb = 90.6, 207Pb = 4.91, 208Pb = 4.43. The measured U concentration was 1396 ppm, and that for Pb was 62.2 ppm. What are the 206Pb/238U, 207Pb/235U, and 207Pb/206Pb ages for this rock, and are they concordant?
We begin by determining the proportions of 235U and 238U in this sample. All natural uranium has 235U/238U = 1/137.8, corresponding to 99.27% 238U. Aleinikoff and coworkers assumed that the nonradiogenic lead in this sample had isotopic ratios of 204:206:207:208 = 1:18.2:15.6:38, corresponding to an average atomic weight of 207.23. From these proportions, we can calculate the following ratios:
| 238U/204Pb | = (1396/62.2)(207.23/238.03)(99.27/0.010) |
| = 193,970, | |
| 235U/204Pb | = 193,970/137.8 = 1407.6, |
| 206Pb/204Pb | = (90.6/0.010) − 18.2 = 9041.8, |
| 207Pb/204Pb | = (4.91/0.010) − 15.6 = 475.4, |
| 206Pb0/204Pb | = 18.2, |
| 207Pb0/204Pb | = 15.6. |
We can now insert values into equation 14.12 and solve for t. The expression for the 206Pb/238U age, corresponding to equation 14.12a, is:
| t206 = | 1/λ1 ln([(206Pb/204Pb) |
| − (206Pb0/204Pb)]/[238U/204Pb] + 1). |
Substitution of the ratios above into this equation gives:
| t206 = | 1/(1.55 × 10−10) ln([9041.8 − 18.2]/[193,970] |
| + 1) = 293 m.y. |
The 207Pb/235U age, calculated from the analogous expression derived from equation 14.12b, is:
| t207 = | 1/(9.85 × 10−10) ln([475.4 − 15.6]/[1407.6] + 1) |
| = 287 m.y. |
Subtracting the initial ratios for the isotopic composition of nonradiogenic lead gives:
207Pb/204Pb = 491 − 15.6 = 475.4,
and
206Pb/204Pb = 9060 − 18.2 = 9041.8.
Dividing these results gives:
(207Pb/206Pb)* = 475.4/9041.8 = 0.0526.
We substitute this ratio into equation 14.14b and solve for t to find that the 207Pb/206Pb age is 308 m.y.
These ages are similar and date the approximate time of crystallization of the pluton. This sample would plot on the concordia curve, because ages determined by both U-Pb systems are nearly identical.
All of the naturally occurring radionuclides that we have considered so far have very long half-lives, so that most of the parent isotopes still occur naturally on the Earth. However, some terrestrial rock samples and meteorites contain evidence of the former presence of now extinct radionuclides that had short half-lives. The stable daughter products and rates of decay for 26Al, 129I, 182Hf, and 244Pu are given in table 14.1. That these isotopes occurred at all as “live” radionuclides demands that the samples that contain them formed very soon after the nuclides were created. In worked problem 14.5, we see how decay of now extinct 182Hf can be used as a geochronological tool. Because of rapid decay rates, a few extinct radionuclides such as 26Al may have been important sources of heat during the early stages of planet formation. The implications of the former presence of 26Al and 182Hf in meteorites will be considered in chapter 15.
Worked Problem 14.5
How can the now extinct radionuclide 182Hf be used to constrain the time of core formation in the Earth? 182Hf decays to 182W with a half-life of only 9 million years, so any 182Hf present in the early Earth has long since decayed. Hafnium is partitioned into silicates (that is, it is lithophile), and tungsten is concentrated in metal (it is siderophile). Consequently, tungsten was partitioned into the Earth’s core when it separated from the mantle. If core separation happened after 182Hf had decayed, then all of the daughter 182W would have been sequestered in the core. If the core formed while 182Hf was still alive, however, this nuclide would have remained in the silicate mantle, and its subsequent decay would have produced an excess of radiogenic 182W relative to nonradiogenic 184W in the mantle. An anomalous 182W/184W ratio in the mantle would then be passed on to basaltic magmas derived from it.
Geochemists Alex Halliday and Der-Chuen Lee (1999) compared the tungsten isotopic composition in terrestrial silicate rocks with those measured in meteorites (fig. 14.8). In figure 14.8, tungsten isotopes are expressed as εw, defined as the deviation between 182W/184W in a sample relative to that ratio in a chondrite of identical age. The 182W/184W ratio in the Earth is indistinguishable from that of chondritic meteorites that have never experienced metal fractionation. However, iron meteorites, which are samples of the cores of differentiated asteroids, exhibit 182W deficits. The absence of excess 182W in the silicate portion of the Earth suggests that the Earth’s core formation must have happened many 182W half-lives after core formation in asteroids. Based on the elapsed time that would be necessary to resolve a 182W/184W ratio higher than in chondrites, Halliday and Lee estimated that core formation in the Earth occurred >50 m.y after the formation of iron meteorites. A recent revision in the initial ratio of 182Hf to stable 180Hf (Yin et al. 2002) indicates a value half that assumed by Halliday and Chuen, which lowers the time of formation of the Earth’s core to 29 m.y.
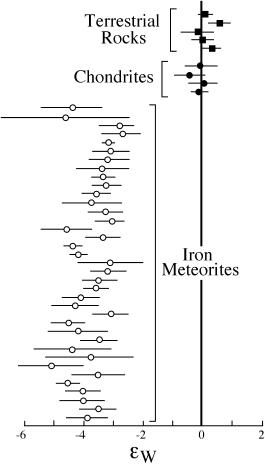
FIG. 14.8. The isotopic composition of tungsten (182W/184W), expressed as εw values, of terrestrial samples compared with those of meteorites. Terrestrial values are indistinguishable from those of carbonaceous chondrites, which have never experienced metal fractionation, but are distinct from iron meteorites, which formed as differentiated cores in asteroids. These data suggest that core formation in the Earth occurred after 182Hf had decayed to 182W, so that no excess radiogenic tungsten was produced in the mantle. (After Halliday and Lee 1999.)
If you have examined micas or cordierite under the petrographic microscope, you may have noticed zones of discoloration around tiny inclusions of zircon and other uranium-bearing minerals. These pleochroic haloes are manifestations of radiation damage produced by alpha particles. The crystal lattices of minerals that contain dispersed uranium atoms also record the disruptive passage of alpha particles in the form of fission fragments. The fragments are very small, but they nevertheless produce fission tracks as they pass through the host mineral. Although the tracks are only ∼10 microns long, they can be enlarged and made optically visible by etching with suitable solutions, because the damaged regions are more soluble than the unaffected regions. A microscopic view of fission tracks can be seen in figure 14.9. The density of fission tracks in a given area of sample can be determined by counting the tracks under a microscope.
These tracks, except in rare instances, are produced solely by spontaneous fission of 238U. The observed track density is proportional to the concentration of 238U in the sample and to the amount of time over which tracks have been accumulating; that is, the age of the host mineral. If a means can be found to measure the uranium concentration in the sample, fission tracks can then be used for geochronology. The uranium abundance can be determined by measuring the density of tracks induced by irradiating the sample in a reactor, where bombardment with neutrons causes more rapid decay (induced radioactivity is explained more fully in the next section). P. B. Price and Robert Walker (1963) formulated a solution for the fission track age equation (presented here without derivation):
t = ln(1 + [ρs/ρI][λ2ϕσU/λF])1/λ2.
Explaining the terms in this equation illustrates how a fission track age is determined. λ2 and λF are the decay constants for 238U and spontaneous fission (8.42 × 10⁻¹⁷ yr−1), respectively. The area density of fission tracks in the sample, ρs, is a function of age and uranium content. We noted earlier that the age can be determined uniquely if the uranium content can be measured. Uranium concentration is measured by placing the sample (after ρs has been visually counted) into a nuclear reactor, which induces rapid 238U decay and increases the number of fission tracks in the sample. The remaining terms in the equation above are related to this irradiation process: ρi is the area density of induced tracks, ϕ is the flux of neutrons passed through the sample, σ is the target cross section for the induced fission reaction, and U is the (constant) atomic ratio 235U/238U.
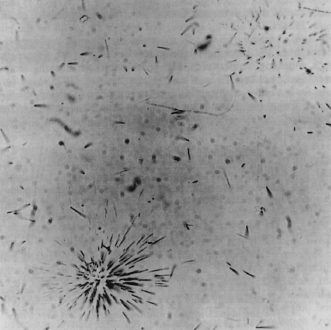
FIG. 14.9. Photomicrograph of fission tracks in mica. Radiating tracks emanate from point sources, such as small zircon inclusions; isolated tracks probably formed from single U or Th atoms. (Courtesy of G. Crozaz.)
Annealing of the sample at elevated temperatures causes fission tracks to fade, as the damage done to the crystal structure is healed. The annealing temperatures for most minerals used in fission track work are quite modest (several hundred degrees Centigrade or less), so the ages derived by this method must be interpreted as times the host rocks cooled through temperatures at which annealing ceased, commonly called cooling ages. Such phases as apatite, sphene, and epidote are useful for the interpretation of cooling histories, and they begin to retain fission tracks at temperatures that are different from the blocking temperatures for argon isotopes. Fission track annealing temperatures, like radiogenic isotope blocking temperatures, can be extrapolated from experimental data. The determination of cooling history using a combination of fission tracks and other isotopic methods is illustrated in the following worked problem.
Worked Problem 14.6
How can we determine cooling history from isotope blocking temperatures and fission track retention ages? The elucidation of cooling history usually requires integration of several different kinds of data, tempered with thoughtful geologic reasoning. D. L. Nielson and coworkers (1986) characterized the temperature history of a Cenozoic pluton in Utah in the this way. Critical observations for their interpretation of the cooling history are:
Using these data, we can construct a temperature versus time plot that describes the cooling history of this pluton (fig. 14.10). We can also speculate about geologic controls on the cooling path. The temperature-time curve in figure 14.10 implies that this body cooled from >500° C through ∼100° C within a span of only 4 million years. This rapid cooling could not have taken place very deep in the crust and must indicate uplift and erosion. Nielson and coworkers calculated that uplift proceeded at a rate between 0.6 and 1.1 mm yr−1 for this interval, based on an assumed geothermal gradient of 30° km−1.
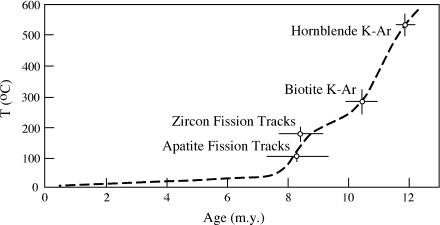
FIG. 14.10. The cooling history of an igneous pluton, inferred from argon blocking temperatures for hornblende and biotite and fission track ages for zircon and apatite. (Data reported by Nielson et al. 1986.)
GEOCHEMICAL APPLICATIONS OF INDUCED RADIOACTIVITY
In medieval times, alchemists toiled endlessly to turn various metals into gold. They were unsuccessful, but only because they did not know about nuclear irradiation. It is now possible to make gold, but it is still not economical, because the starting material must be platinum.
Nuclei that are bombarded with neutrons, protons, or other charged particles are transformed into different nuclides. In many cases, the nuclides produced by such irradiation are radioactive. Monitoring their decay provides useful analytical information. Nuclear irradiation can occur naturally or can be induced artificially. Here we consider some geochemical applications of both situations.
Nuclear reactions caused by neutron bombardment are commonly used to perform quantitative analyses of trace elements in geological samples. Fission of 235U in a nuclear reactor produces large quantities of neutrons, which can be used to induce nuclear changes in mineral or rock samples. Slow neutrons are readily absorbed by the nuclei of most stable isotopes, transforming them into heavier elements. Because many of the irradiation products are radioactive, this procedure is called neutron activation.
In earlier sections, we described radioactivity in terms of N, the number of atoms remaining. In neutron activation analysis, radioactivity is monitored using activity (A), defined as:
A = cλN,
where c is the detection coefficient (determined by calibrating the detector) and λN is the rate of decay. The easiest way to determine the concentration of an element by neutron activation is by irradiating a standard containing a known amount of that element at the same time as the unknown. After irradiation, the activities of both standard and unknown are measured at intervals using a scintillation counter to detect emitted gamma rays. (This step may be complicated for geological samples because they contain so many elements. It is necessary to screen out radiation at energies other than that corresponding to the decay of interest. This can normally be done by adjusting the detector to filter unwanted gamma radiation but, in some cases, chemical separations may be required to eliminate interfering radioactivities.) The activities are then plotted, as shown in figure 14.11; the exponential decay curves are transformed into straight lines by plotting ln A. Extrapolation of these lines back to zero time gives values of A0, the activities when the samples were first removed from the reactor. The amount of element X in the unknown can then be determined from the following relationship:
A0 unkn/A0 stnd = amount of Xunkn/ amount of Xstnd.
The concentration of element X in the unknown can be calculated by dividing its amount by the measured weight of sample.
It is also possible to calculate A0 theoretically by using the following relationship:
A0 = cN0ϕσ(l − e−λti),
where c is the detection coefficient, N0 is the number of target nuclei, ϕ is the neutron flux in the reactor, σ is the neutron capture crosssection of target nuclei, and ti is the time of irradiation. This computation, normally done by computer, makes it easier to handle many elements simultaneously in complex samples.
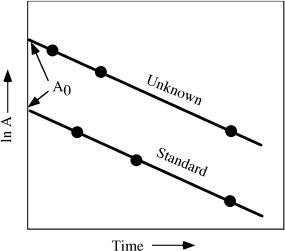
FIG. 14.11. Plot of the measured activity A of an unknown and a standard after neutron irradiation, as a function of time. Extrapolation of these straight lines gives A0, the activity at the end of irradiation. These data are then used to determine the concentration of the irradiated element in the unknown.
One of the disadvantages of the K-Ar geochronometer is that gaseous argon tends to diffuse out of many minerals, even at modest temperatures. Loss of the radiogenic daughter can thus lead to an erroneously young radiometric age. 40Ar-39Ar measurements provide a way to get around the problem of argon loss. Let’s examine how this technique works.
We might expect that the rims of crystals would lose argon more readily than the crystal interiors because of shorter diffusion distances. In this case, the ratio of radiogenic 40Ar to 39K, a stable isotope of potassium, will be highest in crystal centers and lower in crystal rims. Irradiating the sample with neutrons in a reactor causes some 39K to be converted to 39Ar. Consequently, the ratio 40Ar/39K becomes 40Ar/39Ar, which is readily analyzed using mass spectrometry.
The number of 39Ar atoms produced during the irradiation is given by:

where ti is the irradiation time, ϕ is the neutron flux in the reactor, σ is the neutron capture cross section, and the integration is carried out over the neutron energy spectrum dε. The number of radiogenic 40Ar atoms produced by decay of 40K is given by equation 14.8. Dividing equation 14.8 by 14.17 gives the 40Ar/39Ar ratio in the sample after irradiation:

Because equation 14.18 can be solved for t, measurement of the 40Ar/39Ar ratio of a sample defines its age.
In practice, the sample is heated incrementally, and the isotopic composition of argon released at each temperature step is measured. Figure 14.12 illustrates a series of 40Ar/39Ar ages, calculated using equation 14.18, for samples of mica and amphibole in a blueschist sample from Alaska, as a function of total 39Ar released. Each step represents a temperature increment of 50°, starting at 550° C. If this sample had remained closed to argon loss since its formation, all of the ages would have been the same. The spectrum of ages that we see in figure 14.12 results from 40Ar leakage over time. Argon from the cores of crystals is released at the higher temperature steps, and the plateau of ages at ∼185 million years seen at high temperatures represents the time of metamorphism for this sample, because the mica blocking temperature is approximately equal to the peak metamorphic temperature.
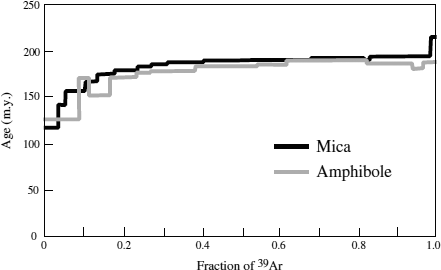
FIG. 14.12. 40Ar-39Ar age versus cumulative 39Ar released for mica and amphibole samples from blueschist. The argon was released at successive temperature steps; each step in this figure corresponds to a 50° increment, starting at 550°C. The plateau of ages at 185 million years corresponds to radiogenic argon from the interiors of crystals. (After Sisson and Onstott 1986.)
In both of the examples we have just considered, the samples were irradiated intentionally by humans. Natural irradiation can also have useful geochemical applications. Cosmic rays, consisting mostly of high energy protons but also of neutrons and other charged particles generated in the Sun and outside the Solar System offer a natural irradiation source. Isotopes produced by interaction of matter with cosmic rays are called cosmogenic nuclides.
Radioactive 14C is produced continuously in the atmosphere by the interaction of 14N and cosmic rays. This isotope is then incorporated into carbon dioxide molecules, which in turn enter plant tissue through photosynthesis. The concentration of cosmogenic 14C in living plants (and in the animals that eat them) is maintained at a constant level by atmospheric interaction and isotope decay. When the plant or animal dies, addition of 14C from the atmosphere stops, so its concentration decreases due to decay. Measurement of the activity of 14C in plant or animal remains thus provides a way to determine the time elapsed since death.
The activity A of carbon from a plant or animal that died t years ago is given by:
A = A0e−λt.
where A0 is the 14C activity during life = 13.56 dpm g−1(expressed as disintegrations per minute per gram of sample), and the decay constant λ is given in table 14.1. (Compare equations 14.19 and 14.15. Both express activity in terms of λN times a constant, c or A0.) Radiocarbon ages have only a limited geologic range because of the short half-life of 14C, but they are very useful for archaeological dating and for some environmental geochemistry applications.
Cosmic rays sometimes fragment other nuclides, a process called spallation. 10Be and 26Al are spallation products formed from oxygen and nitrogen in the atmosphere. Both are rapidly transferred to the oceans or to Earth’s surface in rain or snow, where they can be incorporated into sediments on the ocean floor or into continental ice sheets. After deposition, these cosmogenic nuclides decay at rates given in table 14.1, so they can be used to date sediment or ice cores.
Rocks and soils at the Earth’s surface are also exposed to cosmic rays, so the accumulation of cosmogenic nuclides in them can be used to measure the durations of sample exposure. These time intervals, called cosmic ray exposure ages, assess how long materials were situated on the Earth’s surface, because a meter or more of overburden effectively shields out cosmic rays. Measured concentrations of cosmogenic nuclides are converted to exposure ages by knowing nuclide production rates, which can be determined experimentally. Quartz is an especially favorable target for measurement of cosmogenic 10Be and 26Al because of its simple chemistry, resistance to weathering, and common occurrence in many kinds of rocks. By measuring exposure ages, it is possible to quantify the rates of uplift and erosion. In a later section, we see how cosmogenic 10Be can be employed as a tracer for the subduction of surface materials into the mantle and as a way of constraining subduction rates.
RADIONUCLIDES AS TRACERS OF GEOCHEMICAL PROCESSES
In biological research, certain organic molecules may be “tagged” with a radioactive isotope so that their participation in reactions or progress through an organism can be followed. Radionuclide tracers can be used in an analogous way to understand geochemical processes that have already taken place within the Earth. This usually requires a knowledge of the geochemical behavior of parent and daughter elements. In this section, we consider several examples of the use of these tracers.
Heterogeneity of the Earth’s Mantle
We have already noted that most radioactive nuclides and their decay products cannot be fractionated by mass. However, radioactive isotopes generally have very different solid-liquid distribution coefficients from their stable daughter isotopes, so that partial melting can fractionate radioactive elements from their radiogenic daughters. As melts have been progressively extracted from the mantle to form the crust, the abundances of radioactive isotopes in these reservoirs have changed, and these differences have been magnified by subsequent decay of the fractionated radioactive isotopes. The resulting isotopic heterogeneity within the mantle can be monitored by analyzing magmas that are derived from different mantle depths.
Samarium and neodymium are partitioned differently between the continental crust and mantle. Although both elements are incompatible and thus are fractionated into the crust, neodymium is more incompatible and so is ∼25 times more abundant in the crust than in the mantle, whereas samarium is only ∼16 times more abundant. This means that the Sm/Nd ratio is higher in the mantle than in the crust. 147Sm decays to 143Nd over time, so the ratio of radiogenic 143Nd to nonradiogenic 144Nd changes in both crust and mantle. It is thought that the mantle originally contained samarium and neodymium in the same relative proportion as in chondritic meteorites. The deviation between 143Nd/144Nd measured in a mantle-derived rock and the same ratio in a chondrite of identical age is called εNd (analogous to εW, defined in worked problem 14.5) and can be used to estimate the degree to which the mantle may have evolved from its original pristine state.
Similar arguments can be used to trace the evolution of the 87Sr/86Sr ratio, which is related to the Rb/Sr ratio through the decay of 87Rb to 87Sr. In this case, rubidium is more incompatible than strontium, so the Rb/Sr ratio is higher in the crust and the crust becomes more radiogenic over time—the opposite of the Sm-Nd system. The isotopic composition of strontium can also be expressed as εSr.
If basalts are derived from melting of mantle material, their initial neodymium and strontium isotopic ratios should be the same as those of their mantle sources at the time of melting. Measured εNd and εSr values for young basalts from various tectonic settings are summarized in figure 14.13. Midocean ridge basalts (MORB) have positive εNd and negative εSr values; that is, they have high 143Nd/144Nd ratios and low 87Sr/86Sr ratios that are complementary to those of continental crust. From this, we infer that the upper mantle source regions for MORB have been depleted of materials used to form the continents. Ocean island basalts plot along an extension of the MORB trend in figure 14.13, defining what is commonly called the mantle array. The position of ocean island basalts in the diagram indicates that their source is less depleted than that of MORB. These basalts also show a wider range in isotopic composition. Ocean island basalts may be derived from the relatively undepleted lower mantle and are carried through the upper mantle in plumes, where they mix to varying degrees with depleted materials. Magmas in subduction zones (not shown in fig. 14.13) often plot off the mantle array, reflecting the effects of mixing of seawater expelled from the subducted slab and crustal materials during ascent.
NATURAL NUCLEAR REACTORS
Certain heavy nuclides (235U being the only naturally occurring example) are fissile; that is, on absorbing a neutron, they split into two nuclear fragments of unequal mass. Because fission is exothermic, it is the energy source for nuclear power reactors and for the atomic bomb. When 235U fissions, it releases additional neutrons that collide with other 235U nuclei, prompting further fission reactions. The nuclides produced by fission have higher ratios of N to Z than stable nuclides and are thus radioactive. This process is used to advantage in the design of breeder reactors, which produce plutonium and other transuranic elements. It also accounts for the radioactivity of nuclear wastes.
In 1972, workers at a nuclear-fuel processing plant in France found that some of the uranium ore shipped from the Oklo mine in the Republic of Gabon, Africa, was deficient in 235U relative to 238U. By exquisite analytical detective work, scientists at the French Atomic Energy Commission eventually traced this uranium isotopic anomaly to 17 individual pockets within the Oklo deposit and the surrounding area. They had discovered the intact remains of Precambrian natural nuclear reactors. Besides the depletion in 235U in the spent nuclear fuel, these pockets contain fission-produced nuclides of Nd, Sm, Zr, Mo, Ru, Pd, Ag, Cd, Sn, Cs, Ba, and Te. These isotopes are also part of the radioactive waste from modern man-made nuclear reactors.
The Oklo reactors are small (usually 10–50 cm thick) seams of sandstone-hosted uraninite ore mantled by clay. Today, that ore would be unable to initiate self-sustaining neutron chain reactions, because the proportion of 235U in natural uranium is too low. However, 1.9 billion years ago when these reactors were active, the proportion of 235U was nearly five times greater. The high uranium concentration in quantities exceeding the critical mass was a necessary condition for the Oklo reactors. These ores contained few “pile poisons,” which absorb neutrons and prevent a chain reaction. In modern reactors, neutrons are slowed (moderated) by water, which allows them to be absorbed by other nuclei. Geological observations show that water was also present as a moderator in the Oklo natural reactors. Moreover, the deposits also contain fission products of plutonium and other transuranic elements, which indicates that they functioned as fast breeder reactors. Breeding fissile material would have allowed the reactors to operate continuously for longer periods of time. You can read more about the Oklo reactors in a paper published by F. Gauthier-Lafaye and coworkers (1989).
Besides providing information on the physics of a fascinating natural phenomenon, these reactors are important for understanding radioactive waste containment. Oklo is the only occurrence in the world where actinides and fission products have been in a near-surface geological environment for an extremely long period of time. The fission products at these sites allow characterization of the geochemical mobility of various isotopes and thereby permit assessment of the effectiveness of radionuclide waste repositories.
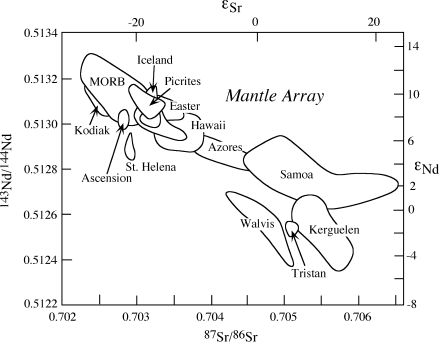
FIG. 14.13. Neodymium and strontium isotopic compositions of basalts. MORBs and ocean island basalts define a diagonal mantle array. MORBs are derived from a homogenized, depleted upper mantle, whereas ocean island basalts represent mixing of magmas derived from a less depleted lower mantle with upper mantle materials. (After Anderson 1994.)
In terms of its radiogenic isotopes, the mantle can be visualized as consisting of two layers: the lower portion undifferentiated and the upper mantle highly fractionated. The lower mantle has presumably remained relatively undepleted since its formation, sampled only infrequently at hot spots to produce flood basalts and oceanic islands. However, periodic sinking of crustal plates into the lower mantle provides a mechanism for enriching it in incompatible elements. The upper mantle has been continuously cycled by the formation and subduction of oceanic crust, as well as the production of continental crust made in magmatic arcs at subduction zones. Its isotopic composition has become homogenized but remains relatively depleted in incompatible elements. This two-layer model of the mantle was previously presented in chapter 12, based on trace element abundances.
The estimated +12εNd value of the upper mantle is counterbalanced by the −15εNd value for continental crust. Knowing these values and the mass of the continental crust, it is possible to perform a mass balance calculation to determine the proportion of the depleted upper mantle. The mass of the continental crust is ∼2 × 1025 g and its neodymium abundance is ∼50 times greater than the upper mantle. The mass of the upper mantle is thus 100 × 1025 g, which corresponds to a thickness on the order of 600–700 km. This depth range coincides with a prominent seismic discontinuity separating the upper and lower mantles.
If this view of a layered mantle is correct, other isotopic systems should be correlated with neodymium and strontium isotopic data. As an example, εPb, the deviation in 206pb/204pb from chondritic evolution, varies systematically, so we should actually consider a Nd-Sr-Pb mantle array. Stan Hart and coworkers (1986) suggested that inclusion of additional isotopic systems may require that compositional models for the mantle be expanded to as many as five components.
In some cases, ascending magmas are contaminated by assimilation of crustal materials, with the result that their compositions are altered. Radiogenic isotopes provide the least ambiguous way of recognizing this process. In uncontaminated basalts, the initial 87Sr/86Sr ratio is the same as that of the mantle source region. This ratio always has a relatively low value (ranging from ∼0.699 to 0.704, depending on the age of the rock—the mantle slowly accumulates radiogenic 87Sr over time), because the amount of parent rubidium relative to strontium in mantle rocks is low. Rb/Sr ratios in rocks of the continental crust are much higher; therefore, over time, crustal rocks evolve to contain more radiogenic 87Sr. We can infer then that magmas derived from mantle sources should have low initial 87Sr/86Sr ratios. Conversely, those derived from, or contaminated with, continental crust should have high initial 87Sr/86Sr ratios. A corollary is that rocks related only through fractional crystallization of the same parental magma should have identical 87Sr0/86Sr ratios.
Other isotopic systems can also be used to test for assimilation of crustal materials. Contaminated basalts should have lower 143Nd/144Nd ratios than uncontaminated rocks. It is not possible to predict the exact isotopic composition of crustal lead, but if Pb isotopes can be analyzed in plausible contaminating materials, its mixing effects can be assessed.
Assimilation is actually a rather complicated process, because it requires a great deal of heat. In chapter 12, we learned that melting requires enough heat to raise the temperature of the wall rocks to their melting points plus the heat necessary to fuse them. Most magmas are already below their liquidus temperatures, so the only plausible source of heat is exothermic crystallization of the magmas themselves. Consequently, we might expect assimilation and fractional crystallization to occur concurrently. An equation to model the change in isotopic composition of a magma experiencing both assimilation and fractionation is given below. Here we assume that a magma body of mass Mo is affected by two rate processes: the rate at which the magma assimilates a mass of rock, Ma; and the rate at which crystals separate during fractionation of the magma, Mc. At any time during the combined processes, the mass of magma remaining is M, and the parameter F = M/Mo describes the mass of magma relative to the mass of the original magma. Any isotopic ratio in the magma Im resulting from the combined effects of assimilation and fractional crystallization is given by:

In this equation, r is defined as Ma/Mc, Ca is the concentration of the element of interest in the assimilated rock,  is its initial concentration in the original magma, and
  and Ia are the initial isotopic ratios of the magma and assimilated rocks, respectively. The term z is defined as:
z = (r + D − 1)/(r − 1),
where D is the bulk distribution coefficient between the fractionating crystals and the magma. Equation 14.20 predicts the isotopic composition of a magma (Im) resulting from combined assimilation and fractionation. Im could be any isotope ratio, for example, 87Sr/86Sr, or any normalized parameter describing such a ratio, such as εSr.
Worked Problem 14.6
By considering the combined effects of assimilation and fractional crystallization, geochemist Don DePaolo (1981) showed that elevated 87Sr/86Sr ratios in modern andesitic lavas in the Andes resulted from crustal contamination. The inferred isotopic compositions of the initial magma and a plausible crustal contaminant (wallrock) are illustrated in figure 14.14. Measured data for most Andean volcanic rocks (open circles in fig. 14.14) do not lie on a straight mixing line connecting these compositions, which might suggest that mixing was not important in determining the isotopic compositions of these rocks. However, the combined effects of assimilation and fractional crystallization give a different result.
Models for the combined processes can be constructed using equation 14.20. To illustrate, we calculate the magma isotopic composition (Im) using the following parameters: the original magma contained 400 ppm Sr and 10 ppm Rb and had an initial strontium isotopic ratio 87Sr/86Sr = 0.7030. The contaminant had 500 ppm Sr and 40 ppm Rb, with an initial ratio 87Sr/86Sr = 0.71025. We assume that r = 0.8, DSr = 0.5, and F = 2. The corresponding value for z is then:
z = (0.8 + 0.5 − 1)/(0.8 − 1) = −1.5.
Substitution of the above parameters into equation 14.20 gives:
| Im | = {(0.8/−0.2)(500/−1.5)(1 − 21.5)(0.71025) |
| + (400)(21.5)(0.7030)}/ | |
| {(0.8/−0.2)(500/−1.5)(1 − 21.5) + (400)(21.5)} | |
| = 0.7078. |
This calculated value is only one point on a curve like those in figure 14.14, which illustrates how the strontium isotopic ratio changes during the combined processes. The curves actually shown in figure 14.14 are the values for Andean volcanics calculated by DePaolo. He assumed that DSr had a range of values as shown in figure 14.14 (we might expect that DSr would vary during fractional crystallization and assimilation as different phases crystallized and the liquid composition changed). The measured strontium isotopic compositions and Rb/Sr ratios in the lavas fall within the calculated curves, thus supporting the model of assimilation and concurrent fractional crystallization.

FIG. 14.14. Strontium isotopic data for volcanic rocks of the Peruvian Andes. The data points do not lie on a simple mixing line connecting the isotopic compositions of initial magma and wallrock contaminant, but do lie near calculated mixing lines for an assimilation-fractional crystallization model with various values of DSr. It is expected that DSr increases in the latter stages of magma evolution. This model appears to explain the observed isotopic data fairly well. (After DePaolo 1981.)
Sediments deposited near oceanic trenches and subsequently subducted into the mantle could conceivably be melted and incorporated into arc volcanics. However, some geological and geophysical studies have stressed the mechanical difficulty of subducting low density sediments into the mantle. Radiogenic isotopes that are concentrated in such sediments may serve as tracers to follow their fate. These sediments characteristically have high 208Pb/204Pb and 207Pb/204Pb ratios. We have already seen that uranium and thorium are incompatible elements that are concentrated in the crust, and the high radiogenic lead contents of these sediments are the result of their derivation from old U- and Th-enriched rocks on continents. The isotopic compositions of lead in some arc volcanics and in abyssal sediments are very similar, but are so distinct from those of oceanic basalts that recycling of crustal materials must occur. Mass balance calculations suggest that 1–2% sediment in the source could account for the observed lead isotope data.
This conclusion is supported by hafnium isotopic data on arc volcanics. We have not discussed the Lu-Hf system, but it is similar in most respects to the Sm-Nd system, with specifics given in table 14.1. Hafnium is partitioned strongly into the mineral zircon, which is commonly concentrated in continent-derived sands. Thus, there should be a major difference in Lu/Hf ratios between these sands and deep-sea muds. This behavior is distinct from Sm/Nd, which shows no fractionation during sedimentation. Therefore, the isotopic variations in hafnium and neodymium expected from mixing mantle with various types of sediment can be predicted and compared with data from arc volcanics. Jonathan Patchett and his collaborators (1984) estimated that <2% of nearly equal proportions of continental sand and oceanic mud could account for the measured Hf-Nd isotopic array.
The cosmogenic isotope 10Be can also be used to shed light on this problem. The short half-life of this isotope, only 1.5 million years (table 14.1), is comparable to the time scale for subduction and magma generation. Young pelagic sediments contain appreciable amounts of 10Be, so it is possible that this isotope might make the round trip from the Earth’s surface into the mantle and back again if subduction and melting are fast enough. Analyses indicate that lavas that should not have incorporated crustal materials (MORB, ocean island basalts) do not contain significant amounts of 10Be, but this isotope is enriched by factors of 10–100 in some arc volcanic rocks (e.g., Aleutians, Andes, Kurile arcs). 10Be is absent in the lavas of some arcs, but its absence does not necessarily prove the absence of sediments, because the 10Be signal depends on the rate of subduction and melting. Julie Morris (1991) provided a comprehensive review of the subject.
It might be argued that 10Be in lavas reflects cosmic ray exposure on the surface after eruption, rather than incorporation of subducted sediments. However, analyses of modern lavas show a constant ratio of 10Be to non-cosmogenic 9Be in all minerals of the rocks, indicating that 10Be must have been incorporated prior to igneous crystallization. Estimates of the amount of sediments incorporated into arc lavas are generally <3%. The time scales for subduction to mantle depths, transfer of material from the slab, and subsequent melting, ascent, and eruption are still debated. Constraints from decay of 10Be can be coupled with U-Th disequilibrium systematics to give times ranging from a few hundred thousand years to as little as 10,000 years.
Isotopic Composition of the Oceans
The isotopic composition of ocean water depends on inputs from various sources. These are primarily (1) submarine weathering of and magmatic interaction with young basaltic rocks of the ocean floor, (2) recycling of marine carbonate rocks that now reside on continents, and (3) weathering of crystalline continental crust, which consists mostly of granitic igneous and metamorphic rocks. We briefly consider the behavior of strontium and neodymium isotopes in the oceanic system.
At the present time, all oceans have a 87Sr/86Sr ratio of 0.7090. In contrast, the measured 143Nd/144Nd ratios of ocean water indicate that each ocean has a distinct and characteristic compositional range, as summarized in figure 14.15 in terms of εNd. What causes this difference in isotopic behavior?
It is thought that much of the strontium in seawater is derived from weathering of marine carbonates on continents. The 87Sr/86Sr ratio in these carbonates has varied during Phanerozoic time, decreasing to a minimum of 0.7067 during the Jurassic and increasing again to the current high value of 0.7090. The isotopic composition of marine carbonates mimics that of the ocean in which they formed, so the oceans have varied in strontium isotopic composition over time. In fact, changes in the oceanic 87Sr/86Sr ratio have now been documented with sufficient precision that this isotope ratio can be used to date some fossil shells and carbonate sediments (the technique is most precise for intervals when the 87Sr/86Sr ratio is rapidly changing due to climatic or tectonic events). Different oceans drain continents with different carbonate sources, so the fact that oceans have the same strontium isotopic composition everywhere must relate to a long residence time (∼4 million years) for this element in seawater. Interoceanic circulation patterns are rapid compared with strontium residence, so that a worldwide isotopic composition results at any given time.
Continental crystalline rocks probably supply most of the neodymium to the oceans. Differences in the ages of continental rocks whose weathering products are drained into the oceans produce distinct radiogenic isotopic signatures in river waters. We might expect that, as with strontium isotopes, these differences would be erased by global circulation, but they are not. The Atlantic is supplied by very old continental regions, with high 143Nd/144Nd, whereas the Pacific is ringed by younger regions with correspondingly lower values of neodymium isotope ratios. Waters in the two oceans retain these isotopic signatures. This can be explained only by assuming that the residence time for neodymium in seawater is short; that is, that neodymium entering the oceans is lost to the seafloor before interoceanic circulation patterns can homogenize the isotopic composition between oceans.
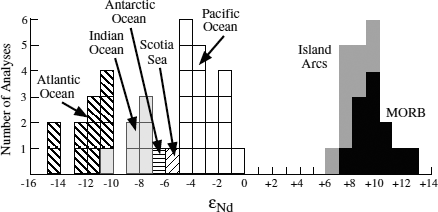
FIG. 14.15. The neodymium isotopic compositions of seawater and ferromagnesian nodules from different oceans, expressed as εNd. Boxes represent individual analyses. These compositions are distinct from each other and from oceanic volcanic rocks. (After Piepgras et al. 1979.)
Radiogenic isotopic studies of seawater thus offer the possibility of shedding light on the rates at which oceans mix, provided that residence times can be fixed. Neodymium isotope measurements may even be able to identify the location of currents responsible for such mixing. Strontium isotopes also provide information on the kinds of rocks exposed to weathering on continents over geologic time.
Worked Problem 14.7
What are reasonable values for input into the modern oceans from various geochemical reservoirs? Gunter Faure (1986) presented a mass balance model based on the premise that the strontium isotopic composition of the oceans could be explained by input from oceanic volcanics, marine carbonates, and crystalline continental crust. The 87Sr/86Sr ratio of seawater (sw) is given by:
| (87Sr/86Sr)sw = | (87Sr/86Sr)VV + (87Sr/86Sr)mM |
| + (87Sr/86Sr)cC, |
where (87Sr/86Sr)v,m,c are strontium isotopic ratios contributed by volcanic, marine carbonate, and continental crustal rocks, respectively, and the coefficients V, M, and C are the fractions of the total input contributed by these sources. By substituting present-day estimates for the strontium isotopic compositions of each of these sources, we obtain:
(87Sr/86Sr)sw = 0.704V + 0.708M + 0.720C.
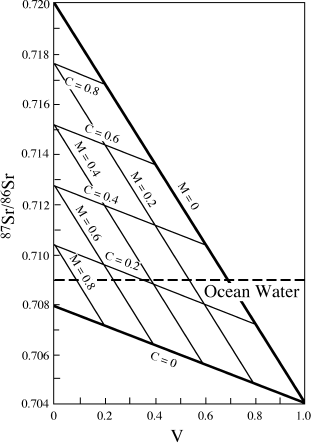
FIG. 14.16. A model to explain the strontium isotopic composition of seawater. Mixtures of various proportions of volcanic rocks (V), marine carbonates (M), and continental crustal rocks (C) can account for the 87Sr/86Sr ratio of modern ocean water (dashed horizontal line at 0.709). (After Faure 1986.)
If we then plot (87Sr/86Sr)sw versus V, as illustrated in figure 14.16, we can contour values of M and C from equation 14.21. Plausible solutions are limited by the restriction that no source can supply a negative amount of material; that is, V, M, and C must be ≥ 0. The isotopic composition of modern seawater is illustrated in figure 14.16 by a horizontal dashed line at 87Sr/86Sr = 0.7090. From this figure, we can see that V cannot be >0.68. However, V cannot be very close to this upper bound, because marine carbonates must make a substantial contribution. The high strontium contents and susceptibility to chemical weathering demand an important role for the volcanic rocks in this system. This model does not provide a unique solution to the problem unless the input from any one of the sources can be fixed unambiguously. However, it does allow us to assess the relative contributions from these sources if a reasonable value for one of them can be guessed. For example, if we assume that M has the value 0.7, then the contributions from other sources are V = 0.16 and C = 0.14.
Degassing of the Earth’s Interior to Form the Atmosphere
The atmosphere is thought to have formed primarily by degassing of the interior of the Earth, and isotopic variations in gases dissolved in basalts provide information on this process. Noble gases are potentially very useful in understanding atmospheric evolution, because they are chemically inert and thus are not fractionated by chemical reactions, and because all except helium are too heavy to escape from the atmosphere to space. Helium and neon cannot be subducted but are continuously released at midocean ridges, demonstrating that the Earth’s interior has not been completely degassed.
Radioactive decay results in the production of many noble gas isotopes. This is easily monitored by considering ratios of radiogenic and stable nuclides. For example, variations observed at the present time in 3He/4He ratios reflect the balance between primordial (stable) 3He and radiogenic 4He formed by decay of 232Th, 235U, and 238U. (Why the radiogenic isotope is not the numerator in this ratio, as is conventional for other radiogenic isotope ratios, is a mystery.) Neon has one radiogenic isotope (21Ne) and two nonradiogenic isotopes (20Ne and 22Ne), as does argon. The 40Ar/36Ar ratio is controlled by the progressive decay of 40K to 40Ar. The isotopic composition of xenon reflects several processes. Radiogenic 129Xe was produced by decay of now extinct 129I. Fission of 238U also generates 134Xe, 136Xe, and several other xenon isotopes, creating variations in the ratios of these isotopes to nonradiogenic 130Xe.
Two different geological processes also affect these isotopic ratios. Degassing occurs by volcanic and hydrothermal activity. Decreases in gas concentrations in the mantle reservoir affect both radiogenic and stable nuclides, but not the nongaseous parent nuclides. For example, degassing decreases the amount of 36Ar (the isotope to which radiogenic 40Ar is normalized) but does not affect 40K (which generates 40Ar). Fractionation of incompatible elements also affects these ratios. We have already learned that K, U, and Th can be fractionated into the crust by magmatic processes. Because some isotopes of these elements are parent nuclides for noble gas isotopes, this process leads to depletion of radiogenic gas isotopes in mantle source regions.
Degassing and crustal formation have occurred on different time scales, and the parent nuclides that produce the isotopic variations in noble gases have very different half-lives. Consequently, these isotopic systems may permit us to trace these geologic processes and determine their time dependence.
Claude Allegre and his coworkers (1986) modeled degassing of the mantle using mass balance calculations that employed argon and xenon isotopic ratios. Their model employs four noble gas reservoirs: the atmosphere, continental crust, upper mantle, and lower mantle. Their calculations indicate that approximately half the Earth’s mantle is 99% degassed. Based on other isotopic evidence, such as neodymium isotopes discussed earlier, this is a larger mantle proportion than that corresponding to the depleted upper mantle. The disagreement might be rationalized by assuming that some of the primitive lower mantle has also lost a portion of its noble gases.
Helium was not used in the mass balance calculations because it has limited residence time in the atmosphere. However, this becomes an advantage if we want to calculate the gas flux from the mantle. Assuming a steady state condition in which the mantle releases as much He as is lost from the atmosphere to space, Allegre and coworkers calculated He fluxes in the mantle-atmosphere system. Fluxes of Ar and Xe can also be estimated based on correlations of their isotopic ratios with 3He/4He. The model of Allegre and his collaborators is summarized in figure 14.17. From this diagram, we can see that the only recycling occurs at subduction zones, and that this recycling is temporary because gases in the subducted slabs are eventually returned to the atmosphere by arc volcanism.

FIG. 14.17. Schematic representation of noble gas reservoirs and fluxes in the mantle-crust-atmosphere system. Degassing of the upper mantle occurs through volcanism at spreading centers, and degassing of a portion of the lower mantle results from hot spot volcanic activity. In this model, helium diffuses between mantle reservoirs, but they behave as closed systems to other noble gases. Subducted oceanic crust contains atmospheric gases, but these are only temporarily recycled, because arc volcanism returns them to the atmosphere. Continental crust is a significant reservoir for radiogenic gases, because their parent isotopes are fractionated into the crust and remain there for long periods of time. Helium is the only noble gas that escapes from the atmosphere to space. (Modified from Allegre et al. 1986.)
However, the ratio 20Ne/22Ne in the mantle differs considerably from that in the atmosphere, and this difference cannot be attributed to nuclear processes (both are nonradiogenic isotopes). This implies that mantle degassing to form the atmosphere has not been a closed system process. Either some dynamic process caused loss of some early atmosphere (escape processes can result in significant fractionations), or some of the atmosphere has a different origin (perhaps carried in impacting comets). Although the neon isotopic data appear to require a more complex evolution of the Earth’s atmosphere, simple degassing of the mantle as advocated by Allegre and coworkers is probably sufficient to explain the argon isotopes, because the mantle is such a huge reservoir of potassium. Noble gas isotopes in the Earth’s mantle were reviewed by Ken Farley and Elizabeth Neroda (1998).
In this chapter, we have seen that isotope stability is the exception rather than the rule. Radionuclides may decay by emission of beta particles, alpha particles, positrons, capture of electrons, or spontaneous fission. Branched decay involving several of these decay mechanisms occurs in some cases. The rate of radioactive decay is exponential and is most easily expressed in terms of half-life. We have derived equations that allow determination of the isotopic evolution of a system as a function of time. These equations permit the age dating of rocks, based on the decay of certain naturally occurring radionuclides, such as 40K, 147Sm, 87Rb, 232Th, 235U, and 238U. In such systems, it is possible to determine the age of rocks even though the daughter isotope may have been present in the system initially. Uranium and thorium isotopes decay through a series of intermediate radioactive daughters, but the half-lives of transitory daughters are short enough that each system can usually be treated as the decay of parent directly to the stable daughter. Independent U-Th-Pb geochronometers can give the same or different results, but useful information can be gained even in cases of discordancy. The interpretation of geochronological data can be complicated by the failure of rock systems to remain closed, as well as other factors. The earlier presence of now extinct radionuclides can, in some cases, be determined, and their existence places constraints on early processes such as planetary differentiation.
The abundances of radiogenic isotopes can be determined directly from mass spectrometry or indirectly from fission track techniques. The production of radioactive isotopes can also be induced artificially in a nuclear reactor, which forms the basis for elemental quantitative analysis by neutron activation. The 40Ar-39Ar geochronometer also depends on induced radioactivity. Cosmogenic nuclides are produced naturally by cosmic ray exposure, which forms 14C for dating recent events and other radionuclides useful in quantifying surface processes such as erosion.
Radionuclides also provide powerful tracers for geochemical processes. Uses we have explored here include understanding mantle heterogeneity, cycling of materials between crust and mantle reservoirs, global oceanic mixing, and degassing of the Earth’s interior to form the atmosphere. The importance of radiogenic isotopes is considered further in the following chapter on the early solar system and processes at planetary scales.
There are an increasing number of textbooks that treat isotope geochemistry. The books by Faure and Dickin are required reading for anyone seriously interested in this subject, and the other references provide further elaboration on certain aspects of radiogenic isotopes.
Bowen, R. 1988. Isotopes in the Earth Sciences. London: Elsevier Applied Science. (Chapter 2 provides a thorough discussion of mass spectrometry, and later chapters deal primarily with radiometric dating techniques.)
Dickin, A. P. 1995. Radiogenic Isotope Geology. Cambridge: Cambridge University Press. (An up-to-date treatment of this field; everything you want to know about geochronology.)
Durrance, E. M. 1986. Radioactivity in Geology: Principles and Applications. New York: Wiley. (This unconventional book deals with many applications of radioactivity not treated here; examples include its use in prospecting for radioactive ores and petroleum, environmental applications, and the heat generated by radioactive decay.)
Farley, K. A., and E. Neroda. 1998. Noble gases in the Earth’s mantle. Annual Reviews of Earth and Planetary Sciences 26: 189–218. (A lucid review of a particularly complex subject; noble gas geochemistry is complex and often understood only by its practitioners, but this paper really helps.)
Faure, G. 1986. Principles of Isotope Geology, 2nd ed. New York: Wiley. (One of the best available texts on isotope geochemistry. This is an excellent source for detailed information of radiogenic isotopes; geochronology is covered more exhaustively than other aspects of this subject.)
Jager, E., and J. C. Hunziker, eds. 1979. Lectures in Isotope Geology. Berlin: Springer-Verlag. (A series of lectures given in Switzerland by respected isotope geochemists; the first half of the book deals with geochronology.)
McLennan, S. M., S. Hemming, D. K. McDaniel, and G. N. Hanson. 1993. Geochemical approaches to sedimentation, provenance, and tectonics. Geological Society of America Special Paper 284:21–40. (This review paper is a primer on the use of radiogenic isotopes in deciphering the tectonic setting of clastic sediments.)
Philpotts, A. R. 1990. Principles of Igneous and Metamorphic Petrology. Englewood Cliffs: Prentice-Hall. (Chapter 21 gives a particularly good overview of isotope geochemistry, and especially of the use of radiogenic isotopes in understanding magma sources.)
Vertes, A., S. Nagy, and K. Suvegh. 1998. Nuclear Methods in Mineralogy and Geology. New York: Plenum. (This is an excellence source for learning about neutron activation analysis, and other subjects not covered here, such as dating groundwater.)
Walker, F. W., D. G. Miller, and F. Feiner. 1983. Chart of the Nuclides. San Jose: General Electric Company. (A real bargain that contains physical constants, conversion factors, and periodic table; order from General Electric Nuclear Energy Operations, 175 Curtner Ave., M/C 684, San Jose, California 95125.)
The following references were cited in this chapter. These provide more thorough treatments of the applications of radionuclides in solving geochemical problems.
Aleinikoff, J. N., R. H. Moench, and J. B. Lyons. 1985. Carboniferous U-Pb age of the Sebago batholith, southwestern Maine: Metamorphic and tectonic implications. Geological Society of America Bulletin 96:990–996.
Allegre, C. J., T. Staudacher, and P. Sarda. 1986. Rare gas systematics: Formation of the atmosphere, evolution and structure of the Earth’s mantle. Earth and Planetary Science Letters 81:127–150.
Anderson, D. L. 1994. Komatiites and picrites: Evidence that the “plume” source is depleted. Earth and Planetary Science Letters 128:303–311.
DePaolo, D. J. 1981. Trace element and isotopic effects of combined wallrock assimilation and fractional crystallization. Earth and Planetary Science Letters 53:189–202.
Gauthier-Lafaye, F., F. Weber, and H. Ohomoto. 1989. Natural fission reactors of Oklo. Economic Geology 84:2286–2295.
Halliday, A. N., and D.-C. Lee. 1999. Tungsten isotopes and the early development of the Earth and Moon. Geochimica et Cosmochimica Acta 63:4157–4179.
Hart, S. R., D. C. Gerlach, and W. M. White. 1986. A possible Sr-Nd-Pb mantle array and consequences for mantle mixing. Geochimica et Cosmochimica Acta 50:1551–1557.
Morris, J. D. 1991. Applications of cosmogenic 10Be to problems in the earth sciences. Annual Reviews of Earth and Planetary Sciences 19:313–350.
Nielson, D. L., S. H. Evans, and B. S. Sibbett. 1986. Magmatic, structural, and hydrothermal evolution of the Mineral Mountains intrusive complex, Utah. Geological Society of America Bulletin 97:765–777.
Nyquist, L. E., C. –Y. Shih, J. L. Wooden, B. M. Bansal, and H. Wiesmann. 1979. The Sr and Nd isotopic record of Apollo 12 basalts: Implications for lunar geochemical evolution. Proceedings of the Lunar and Planetary Science Conference 10:77–114.
Patchett, P. J., W. M. White, H. Feldman, S. Kielinszuk, and A. W. Hoffman. 1984. Hafnium rare-earth element fractionation in the sedimentary system and crustal recycling into the earth’s mantle. Earth and Planetary Science Letters 69:365–378.
Piepgras, D. J., G. J. Wasserburg, and E. J. Dasch. 1979. The isotopic composition of Nd in different ocean masses. Earth and Planetary Science Letters 45:223–236.
Price, P. B., and R. M. Walker. 1963. Fossil tracks of charged particles in mica and the age of minerals. Journal of Geophysical Research 68:4847–4862.
Sisson, V. B., and T. C. Onstott. 1986. Dating blueschist metamorphism: A combined 40Ar/39Ar and electron microprobe approach. Geochimica et Cosmochimica Acta 50:2111–2117.
Yin, Q., S. B. Jacobsen, K. Yamashita, J. Blichert-Toft, P. Talouk, and F. Albarede. 2002. A short timescale for terrestrial planet formation from Hf-W chronometry of meteorites. Nature 418:949–952.
(14.1) Given the following Rb-Sr isotopic data for whole-rock samples of a granitic pluton, determine the initial strontium isotopic ratio and age of the pluton.
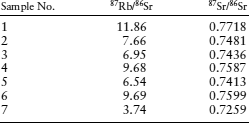
(14.2) (a) Solve equation 14.8 for t. (b) Use the equation you just derived to determine the age of a biotite sample, for which the following data have been obtained: K = 7.10 wt. %, 40Ar = 1.5 × 10¹² atoms g−1.
(14.3) A zircon grain initially contained 1000 ppm 235U and 100 ppm 207Pb. How many atoms of 207Pb will this zircon contain after 1 billion years?
(14.4) Using the data below and figure 14.7, construct a concordia diagram. Are these samples concordant? Interpret your results, explaining any assumptions that you make.

(14.5) You obtain the following geochronological data for a portion of the Appalachians. A gneiss unit gives whole-rock Rb-Sr and zircon U-Pb ages of 315 million years. Mineral geothermometers in this unit give a peak metamorphic temperature of 530° C. 40Ar-39Ar gas retention ages are 295 million years for hornblende and 283 million years for biotite. Fission track ages for apatites range from 130 to 150 million years. Using these data, construct a time-temperature path illustrating the late Paleozoic thermal history of this part of the Appalachian orogen.
(14.6) The measured activity of a sample of charcoal found at an archaeological site is 5.30 dpm g−1. What is the age of the sample?
(14.7) How much heat energy would be generated in 100,000 years by a one cubic meter sample of rock containing live 26Al? The half-life of 26Al is given in table 14.1. Assume that the sample initially contains 100 g of aluminum with a 26Al/27Al atomic ratio of 0.1. Also assume that the energy of decay for 26Al is 10−14 cal atom−1.
(14.8) A magma containing 200 ppm strontium is contaminated by crustal rocks containing 1000 ppm Sr. The magma simultaneously undergoes fractional crystallization of phases with a bulk distribution coefficient DSr = 0.75. The initial Sr isotopic ratios of the magma and crustal rocks are 0.704 and 0.713, respectively. Assume that r = 0.5. Use equation 14.20 to calculate the isotopic composition of the resulting hybrid magma as a function of mass of magma relative to original mass (F), and illustrate the result with a graph.