3
Strain Localization and Shear Banding: The Genesis of Failure Lines
3.1. Background and framework of the analysis
This chapter deals with the consequences of previous developments on a major feature of granular media under sustained strain: the development of strain localization into shear bands, analyzed here as the development of admissible heterogeneities fluctuations in internal motion, from a local scale up to emergence at the macroscopic scale (Figure 3.1).
The orientation of shear bands under constant volume motion (critical state), resulting from properties of the tensor of internal actions, is found to correspond with classical values. However, with variable volume motion, the results show that the relationship between shear band orientation and dilatancy is found to significantly depend on the type of micro-mechanism producing dilatancy.
The internal structure of macroscopic shear bands is then developed: first by a macroscopic approach and second by a micromechanical one. The results, in terms of dissipation intensity and shear strain decay in function of the distance to shear band axis, are shown to match fairly well with the structure described by detailed experimental micrometric measurements published by Nemat-Nasser and Okada [NEM 01].
The criterion of localization development, considered as a particular kind of heterogeneity growth induced by the minimum dissipation rule, is found based on the non-convexity of specific energy dissipation rate, toward correlated fluctuations in density and shear strain.
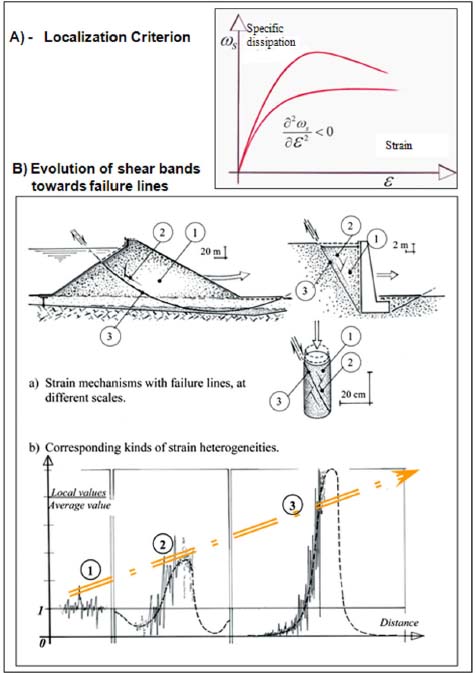
Figure 3.1. Localization process: from local heterogeneity to developed failure lines. (A) Localization criterion. (B) Evolution of shear bands toward failure lines (a) strain mechanisms with failure lines, at different scales (b) corresponding kinds of strain heterogeneities. For a color version of the figure, please see www.iste.co.uk/frossard/geomaterials.zip
The resulting features of localization development are shown to correspond quite well with experimental results.
Then the evolution of parallel shear band systems is analyzed, explicitly showing that under monotonous strain conditions, the evolution leads to the concentration of a set of parallel shear bands into a unique shear band, which in turn concentrates the movements up to the maximum allowable limit.
This result achieves a complete micro-mechanism for generation of macroscopic failure lines, from the growth of small-scale fluctuations to full size macroscopic localized shear, concentrated in the failure line (Figure 3.1).
3.2. Shear bands orientation
During motions near minimal dissipation, the orientations of sliding (relative) velocities and contact forces associated with these sliding movements are not at random, because of polarization of internal actions distributions, in the modes of minimal dissipation (section 1.2.5). Then considering a shear band as a zone of concentration of these elementary contact sliding movements, associated with other local movements producing volume changes, the corresponding shear band direction, together with that of the forces exerted inside, may be analyzed.
During monotonous shear motion under moderate stresses, the granular materials generally tend to dilate in volume, an effect named “dilatancy” after Reynolds works on the subject (1885). This dilative trend develops until reaching a steady-state regime, where specific volume becomes stationary in spite of motion continuation, this steady-state regime has been named “critical state” by Casagrande in his early works (1936).
In section 3.2.1, we begin with this simplest situation of “critical state.”
3.2.1. Constant volume motion (critical state)
Such a motion of shear with constant specific volume is a simple shear one, and the shear band can be considered as a quasi-discontinuity surface separating two granular masses that practically do not deform during motion, which will be confirmed by the internal structure found in section 3.3.
Provided that there is no significant movement of materials across this surface between the two masses “frozen in the movement”, this quasi-discontinuity becomes a surface of concentrated simple shear, i.e. a surface of tangential sliding at the macroscopic scale. For this surface, the flux of mechanical energy resulting from the tensor of internal actions applied to the surface normal vector is purely tangential, because the sliding velocity is tangential, and the granular masses outside the shear band do not absorb mechanical energy (these masses do not deform).
As the orientations of elementary sliding movements whose resultant is the global motion are otherwise well defined near the minimal dissipation modes, the sought macroscopic surface simultaneously present:
- – purely tangential internal actions;
- – a material orientation corresponding to elementary contact sliding movements in the minimal dissipation mode prevailing in the material domain.
Detailed analysis of each mode, see Appendix A.3.1, shows that this double condition can only be achieved in plane strain mode, by local plane surfaces, whose orientation is that of the Rankine limit equilibrium, making an angle θ0 with the eigendirection bearing the input power π+ (Figure 3.2):
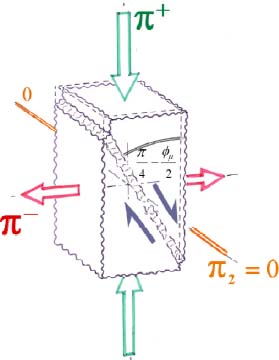
Figure 3.2. The overall layout of shear bands orientation. For a color version of the figure, please see www.iste.co.uk/frossard/geomaterials.zip
Note that this property, resulting only of the tensor structure of internal actions, is completely independent of the coaxial subject.
The conical localization surfaces found by tomography of “triaxial tests” [DES 96, ALS 03], which are in Mode I, are then interpreted as envelopes of local motions in plane strain, not necessarily simultaneous, distributed by rotation around the axis bearing π+.
Among the contact forces transmitted through the shear band, some do not participate in energy dissipation, because the contacts on which they exert do not slide, while others do participate – we will call “active forces” – by which we can analyze the orientation. The first answer is given by the above analysis of shear band orientation: the active forces being symmetrical of the sliding velocities relative to the axis bearing π+, the orientation of active chains of forces may be symmetrical of the orientation of shear band, relative to the axis bearing π+.
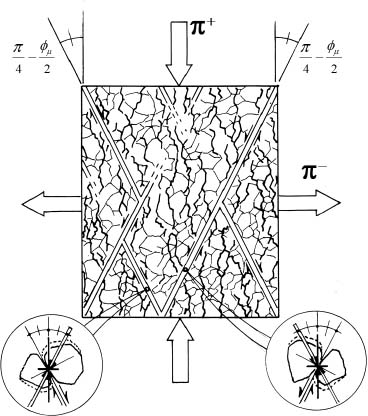
Figure 3.3. Orientations in motions with stationary-specific volume
Another answer is brought by the global analysis of equilibrium conditions over the localization surface, see Appendix A.3.2, which shows that the direction of active chains of forces cannot be other than the above findings. Also, note that this orientation of active chains of forces is again totally independent of any consideration for coaxiality.
The above results are summarized by the simple pattern shown in Figure 3.3.
3.2.2. Variable volume motion
To analyze the direction of shear bands, when the specific volume cannot be considered as constant, requires entering into the micro-mechanisms that generate the dilatancy within the shear bands. This dilatancy is often characterized by a parameter of the “dilatancy angle δ” introduced in 1960 by Hansen and Lundgren (see [VAR 85]) for plane strain motions 
Therefore, we focus the analysis on plane strain movements (corresponding to laboratory “biaxial” tests, and other plane strain apparatuses, with or without axis rotations), and two kinds of micro-mechanisms:
- – Shear with dilatancy generated by separation of grains during sliding: micro-mechanism that would better correspond to flattened particles, angular and rough, and for which the shear band orientation depends clearly on dilatancy.
- – Shear with dilatancy generated by grain rocking: micro-mechanism that would better correspond to more globular particles, rounded and smooth, and for which the shear band orientation does not practically depend on dilatancy.
3.2.2.1. Dilatancy micro-mechanism by grains separation
In this motion, the instantaneous shear surface is indented, separating two granular masses which behave temporarily as rigid bodies, sliding on each other on this indented surface, and the global dilatancy results from local separation movements [Figure 3.4]. The relative sliding motion direction is the same as the contacts sliding, and the global kinematics (see [BOR 02]) implies that this sliding velocity exhibits an angle with the average direction of the shear band, precisely equal to δ. As the local contacts sliding makes an angle  relative to π+ axis, the global shear band inclination may be relative to π+ axis
As the volume increases along a definite direction – the direction of elementary sliding movements that are polarized – the resulting dilatancy can be qualified as “polarized” for this micro-mechanism.
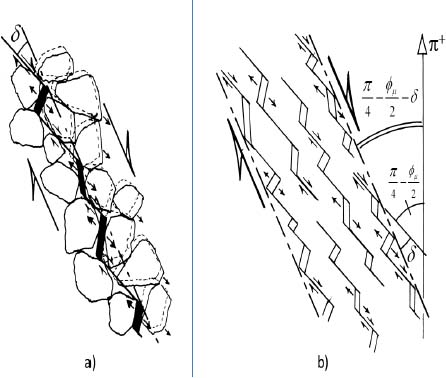
Figure 3.4. Shear motion with dilatancy by grains separation. (a) Basic mechanism. (b) Global motion within shear band
3.2.2.2. Dilatancy micro-mechanism by grain rocking
This kind of motion may be associated with the evolution of chains of forces within the shear band, and rocking movements of particles with the development of shear forces, Figure 3.5. The associated dilatancy is not “polarized”, as described in the above grain separation micro-mechanism, and being more diffuse, has much less incidence of shear band orientation
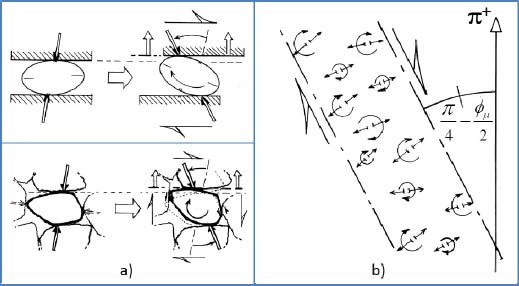
Figure 3.5. Shear motion with dilatancy by grain rocking. (a) Basic mechanism. (b) Global motion within shear band
3.2.2.3. Confrontation with published experimental results
A detailed confrontation with a wide set of published experimental data [FRO 04] suggests a large predominance of dilatancy micro-mechanisms associated with grain rocking with a smaller proportion of motions associated with dilatancy by grain separation, at least in the available experimental results related to granular materials that are currently available in laboratories. At the first approximation, the set of results may be summarized as follows:
where α is the material parameter, generally lower than 0.4.
However, this relationship between shear band orientation and dilatancy is likely to depend on the kind of material.
3.3. Shear bands internal structure
In this section, we consider shear bands in plane strain, as zones of shear strain maxima, with fixed direction relative to the material domain in motion, and we focus on the motion and mechanics near the axis of these shear maxima.
3.3.1. Kinematic stationary structures in shear bands
In the equivalent pseudo-continuum framework, between possible kinematic discontinuities constituting the axis of shear bands, the macroscopic velocity field is assumed continuous and derivable (piecewise continuous and derivable). As the only stationary strain regimes in granular media are with constant specific volume, we consider motions where volume variations are negligible compared to shear strains.
Let us consider a material sub-domain bounded on one side by a line of maxima of shear strain rate, or a kinematic quasi-discontinuity, located in a reference system attached to the material in motion, with the axis parallel to the local axis attached to the shear band, Figure 3.6. The axis no. 2 being taken as the plane strain neutral axis, i.e.  , we analyze the motion in plane {1,3}, for x3 > 0.
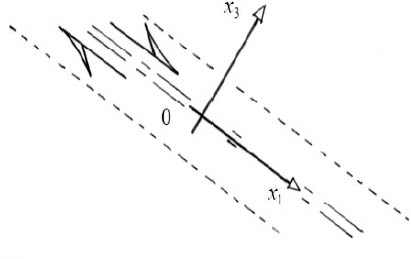
Figure 3.6. Motion referential in the shear band
In this referential, the general form of a stationary velocity field attached to a shear band is  with V3 (x3) = 0 (stationary specific volume condition), and the current position x(t) of a material point is related to its reference position X(t0) at time t0 by
  (where x, X, and V are vectors).
This representation of motion allows the definition either of the displacement gradient tensor relatively to the reference configuration (Lagrangian representation) by  , or the strain rate one (Eulerian representation) by
  .
.
3.3.1.1. Internal kinematic similarity: the equation of shear band stationary structure
Consider the internal movements within the granular material as a function of the field of external velocities  imposed at the external boundaries of the domain. Because of friction laws, granular materials in quasi-static motion have the property that the internal movements are positive homogeneous function of degree 1 relative to this external velocity field. So, if λ is a factor > 0, the transformation
  will transform the internal movements by
Now, the strain rate tensor being here  the above property of internal kinematic similarity implies
where the unknown function f(x3) is only homogeneous function of degree 0 relative to the external velocity field  .
.
This relation [3.5] is the kinematic equation of stationary structure inside the shear band, and its solutions are in the form 
3.3.1.2. Completely stationary solutions
Note that the structure defined by the above equation is stationary relative to time, and to the coordinate x1; so, if the function f(x3) is a constant C, then the structure defined by this equation becomes completely stationary relative to time, and to spatial coordinates, it is the simplest solution of the kinematic equation [3.5].
The constant C may be interpreted as a material characteristic, and as the border of the considered domain for x3 = 0 is defined by the maximum shear strain rate, they are the only physically acceptable solutions f(x3) = C ≤ 0. Finally, having built these solutions from the axis of maxima in a shear band for x3 > 0, the complete solution for a whole stationary shear band (x3 either < 0 or > 0) is constituted by symmetry, by substituting |x3| into x3 in the above relations.
Observing that  , a homogeneous field of shear strain rate,
  , is also a solution; we then get the complete solution of a stationary shear band structure, immersed in a homogeneous field of shear with intensity
The above property of internal kinematic similarity implies that in this relation,  and
and  are proportional to the intensity of imposed external velocities
  , whereas the coefficient k (k = −C > 0) remains independent and may be considered as a material parameter.
These elements allow drawing the deformation diagrams of Figure 3.7, using the computation method displayed in section 3.3.2, drawn for a simple shear motion and a biaxial compression motion. Globally, the computed deformed shapes do correspond quite well with published observed deformed shapes.
3.3.2. Confrontation with key experimental results of Nemat-Nasser and Okada
In their experiments, Nemat-Nasser and Okada [NEM 01] have performed very fine micrometric measurements of deformation structure inside shear bands. However, these measurements are being made by the displacement gradient method (tensor Fij detailed above), where the link has to be first made with our strain and shear rates (tensor  and shear rate
  ). In our representation, the displacement gradient is
  with
with  , and the approximation of stationary specific volume is denoted by x3 = X3, then
  .
.
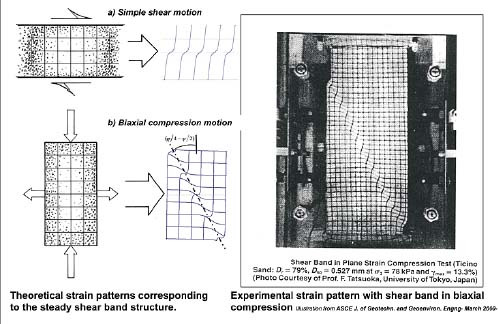
Figure 3.7. Overall features of shear band steady solutions. (a) Simple shear motion. (b) Biaxial compression motion
Otherwise, the tensor of strain rates is  with
with  . Taking into account the above, this becomes
  . This means that, in this specific case of motion, the “nominal shear”
  defined in the method of displacement gradient (tensor F) is equal to the integral over the time of the shear rate
  defined by the method of velocity gradient (tensor
  ). Therefore, if our stationary shear profile determined in section 3.3.1 is relevant, the measured profile of “nominal shear” in a shear band may tend, at the first approximation, to be similar to the profile of stationary shear rates defined by equation [3.6].
Figure 3.8 shows this measured profile of “nominal shear” over 8 mm shear bandwidth (about 17 times the average grain diameter), centered on the center of the shear band, after an average deformation of the test specimen of 10% in average nominal shear, redrawn in [FRO 04] from the original paper [NEM 01], together with a theoretical profile fitted by maximizing the correlation coefficient, which is of 97%. The adjusted parameters are  , which means the ratio of nominal shear concentration in the shear band center compared to the sides is about 100. The qualitative and quantitative fit is particularly good, as we compare a theoretical stationary structure, with the experimentally measured profile including transitory volume changes and other factors. This good fit suggests that a specific physical process resulting from granular media mechanics, similar to diffusion, could be underlying this stationary theoretical profile, starting from the axial zone of the shear band toward its sides, and feeding its exponential decay from the axis toward the outside.
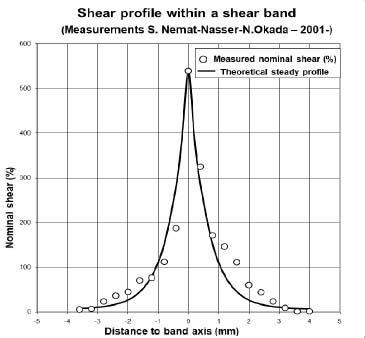
Figure 3.8. Shear profile inside a shear band (experimental data from Nemat-Nasser and Okada [NEM 01])
3.3.3. The dissipative microstructure inside shear bands
Such a micro-mechanical effect may be found in the present approach, with the propagation of internal movements by internal feedback effect (sections 1.2.3 and 1.2.4):
- – within the shear band, the intense energy dissipation occurring in its axial zone leads to mechanical energy transmission toward the sides of the shear band by internal feedback effect;
- – the motion fed in these sides will dissipate most of this mechanical energy transmitted from the axial zone, and retransmit the remainder toward the outside;
- – in a cascading process rapidly fading toward outside.
Otherwise, provided that the shear band does not include any macroscopic true discontinuity, the macroscopic stresses inside can be considered as continuous, and the local dissipation rate will be proportional to the local shear rate, for the specific motion considered here (volumetric strains negligible as compared with shear distortion). If the shear stress parallel to the shear band can be considered as homogeneous in the shear band and its vicinity, the profile of shear strain rate is then directly proportional to the profile of energy dissipation rate.
3.3.3.1. The dissipation profile due to internal feedback
In this framework, the internal balance of energy dissipation within the shear band can be analyzed in detail [FRO 04], dividing the shear band into layers parallel to the axis, and dividing each layer into elementary cells (Figure 3.9), allowing us to set the energy balance of each layer relative to its neighbors, resulting in a differential equation of the dissipation profile inside the shear band, from the axis toward the outside.
This analysis requires us to set the following basic assumptions:
- – outside the maximal shearing axial zone, the energy dissipation inside the shear band comes exclusively from the internal feedback effect;
- – the internal feedback rate R is uniform within the shear band;
- – the thickness of the analyzed layers is set by a characteristic dimension Dc;
- – the feedback fluxes being a priori distributed in all directions, the energy balance analysis leads us to gather these fluxes into inter-layer fluxes and intra-layer fluxes, whose proportion is set by an anisotropy coefficient α, uniform within the shear band;
- – the reasoning is based on the unit mass of material (although under stationary specific volume, it is equivalent to unit volume-based reasoning).
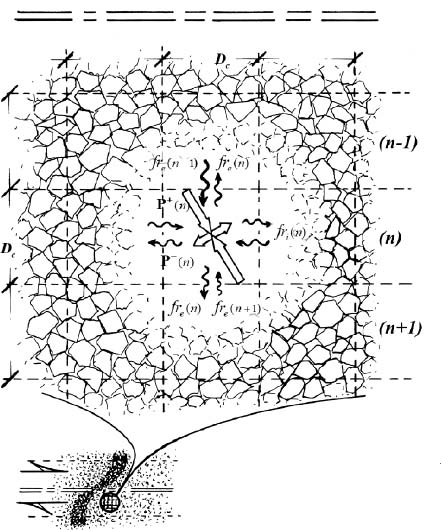
Figure 3.9. Micro-mechanism within the stationary shear band structure – terms of energy dissipation balance
The energy balance to be written denotes that in the cells of the layer (n), the total of elementary input powers is balanced by the sum of:
- – inter-layer fluxes of internal feedback fre, transmitted by layers (n − 1) and (n + 1);
- – intra-layer internal feedback flux fri, internal to layer (n).
Noting  as the specific dissipation in the cell of layer (n), it is shown in Appendix A.3.4 that all the above terms of energy balance can be expressed as a function of specific dissipations of adjacent layers, friction parameter sin ϕμ, internal feedback rate R, and anisotropy feedback coefficient α
This is the discretized form of the differential equation of the dissipation profile within the shear band, due to dissipation diffusion by internal feedback, whose solutions are exponential profiles.
In its continuous form (n is substituted by  ), relevant solutions are given by
With typical values for the material parameters (sin ϕμ = 0.5; R = 0.25; and α = 1), the specific dissipation rate fading can be computed, from the axis toward the outside
| Distance to axis | 0 | Dc | 2 Dc | 3 Dc | 4 Dc |
| Relative dissipation | 100% | 2.2% | 0.05% | 10−5 | 2.2 × 10⁻⁷ |
The dissipation rate defined by this cascading process fades quickly with the distance, being divided by a factor of 47 between two successive layers.
3.3.3.2. Corresponding shear rate profile
In the situation considered here, the shear rate profile is homothetic to one of the dissipation rates. Therefore, the above exponential profile results from the internal kinematic similarity, which can be physically attributed to the dissipation profile resulting from diffusion effects due to cascading internal feedback, and the identification of material parameters sets  .
.
Connecting these relations with the value found in measurements from Nemat-Nasser and Okada (section 3.3.2) leads to an evaluation of Dc corresponding to these experiments, performed on a sand with narrow gradation, average grain diameter 0.48 mm (Monterey sand no. 0): Dc is about five times the average grain diameter  .
.
This result, for granular media with narrow gradation, complements the above expression of material parameter k, together with typical values of material constants
3.3.3.3. Effective width of shear bands
Equation [3.9] of the dissipation rate, together with the typical value of material parameter k1 resulting from relation [3.8], allows us to define an effective width of shear bands, as the width concentrates 99% of total dissipation in the shear band.
Considering a shear band, constituted by two exponential profiles symmetrical relatively to the axis, as defined by relation [3.5]:
- – for a given width L, the dissipation concentration ratio is given by

- – connecting with the above expression of k, and with typical values of other material parameters, leads to the following table:
| Width L |  |
 |
 |
 |
| Dissipation concentration % | 78.6 | 90 | 99 | 99.95 |
Therefore, the effective width is about 12 times the average grain diameter for granular media with narrow gradation, which conforms with published data [ODA 98, NEM 01]. The above table can be summarized in Figure 3.10.
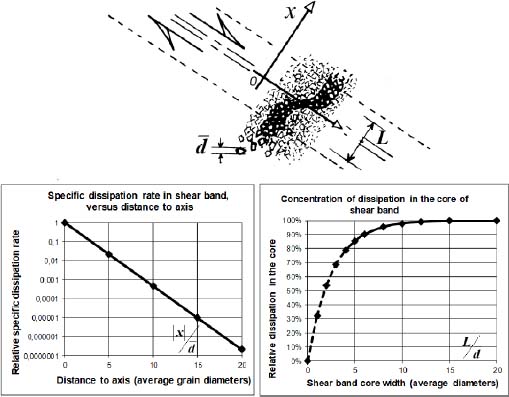
Figure 3.10. Dissipative structure in the stationary shear band
3.3.4. Consequences on the development of shear bands
3.3.4.1. Limit to the concentration of shear
The above-evidenced structures have direct incidences on the patterns of shear band development, and a limitation in their capacity of concentrating shear within a domain is subjected to a given average shear.
Considering a material domain subjected to simple shear monotonous motion, starting with a quasi-homogeneous shear movement, with a shear band developing inside, of which we follow the development over time (Figure 3.11). From equation [3.6], the average shear strain rate in the domain at time t is obtained by integration

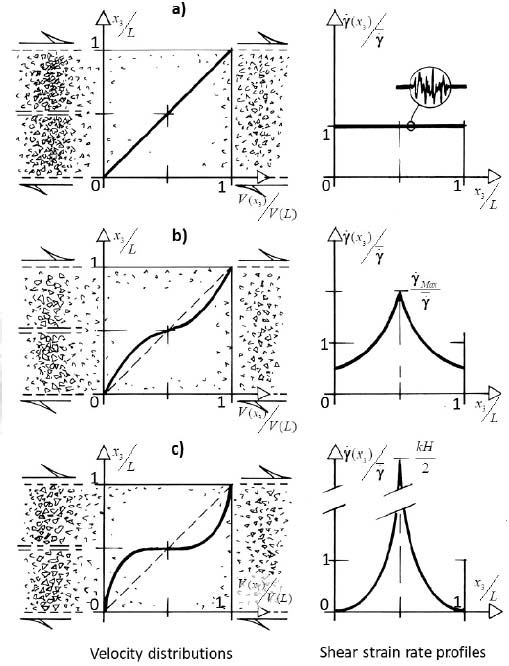
Figure 3.11. Limit to the concentration of shear into stationary shear bands. (a) Quasi-homogeneous motion. (b) Intermediate configuration. (c) Maximal concentration
Note that in the domain, as there is no reverse motion against the average trend (see section 2.2.1), all shear rates in the above relation have the same sign. Dividing all terms by the average, the above relation becomes

Therefore, the maximal concentration in the shear band axis occurs when the homogeneous field outside the shear band becomes null  ; in other words, when the motion concentrates exclusively in the shear band, vanishing completely outside (Figure 3.10). When
  , i.e. with L large enough, it is given by
This concentration factor may be compared to experimental data from Nemat-Nasser and Okada [NEM 01] on a hollow cylinder test specimen, 0.25 m in height: taking into account the value already found for k (section 3.3.2): the maximal concentration factor observed for these tests had a measured value of 57, for the average shear limited to 10%. According to equation [3.10], it could have reached about 200, far above the measured value; however, the development of such very large shear concentrations ratios are likely to require larger average shear strains to appear.
It will be shown in section 3.5 that under monotonous conditions, shear band evolution goes irreversibly from situation (a) toward situation (c) shown in Figure 3.11.
3.3.4.2. Coexistence of parallel shear bands
A parallel shear band system, often observed in experiments, can be considered as a juxtaposition of “inter-bands”, i.e. of zones included between two parallel lines of maxima of shear strain rate. Such an inter-band is crossed, according to the above dissipative structure, by two diffusion processes in reverse ways, originated in the two axial shear zones.
It is shown in Appendix A.3.4 that the complete solutions of the differential equation of the dissipation profile due to internal feedback diffusion are in fact linear combinations of two exponential profiles of reverse proportion, which can be interpreted naturally as the superposition of two diffusion processes in reverse ways, i.e. an inter-band structure. Noting  and
and  as the two shear maxima lining the inter-band LI in width, with coordinates’ origin in its middle (Figure 3.12), the corresponding shear profile within the inter-band is obtained by
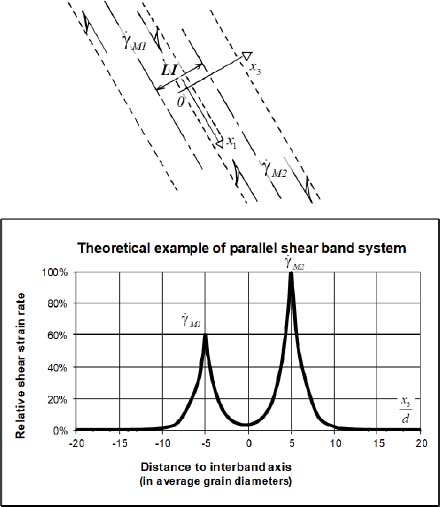
Figure 3.12. The system of parallel shear bands – an example of a shear profile
3.4. Localization criterion
The preceding sections have been focused on heterogeneity structures compatible with the tensor framework induced by contact friction, independent of the matter of their development. Conversely, section 3.4.1 focuses on the subject of heterogeneity development, independent of their structures.
This subject first requires us to set a simple representation of material internal evolution during motion, provided here by basic internal variables. In this framework, the subject of heterogeneity development reduces to the question of the conditions making it so that spontaneous local fluctuations on internal variables (inherent to granular materials motion) will tend to grow or to fade. The answer will be shown to result again from energy dissipation conditions, as a consequence of the minimum dissipation rule (see Introduction, section I.2).
3.4.1. Conditions for heterogeneity development
3.4.1.1. Representation by internal variables
During motion, the mechanical behavior of a material domain can be considered as a response of the medium to an imposed solicitation, in function of a set of internal variables that change with motion. This response of the material is generally assessed through measurements of average quantities (average stresses and strain rates, average dissipation rate, average specific volume, etc.). The question of heterogeneity incidence becomes here that of the incidence of local internal variables dispersion, on the average quantities which characterize the response of the material.
So, let us consider a material domain  in motion, divided into unit cells whose size is equivalent to the representative elementary volume (REV), or better the representative elementary mass (REM), as we consider motions with variations in volume1. Under regular boundary conditions, and as long as heterogeneity is not well developed at the macroscopic scale, we can consider that:
- – each unit cell is “reasonably” representative of the whole domain, with a certain local deviation;
- – the average values of internal variables attached to each cell are “reasonably” dispersed relative to the average values over the whole domain;
- – the functional relationship between the specific rate of energy dissipation and internal variables, on average in each cell, is reasonably near the same relation for the whole domain, and this functional relation is assumed continuous and differentiable to the second order in section 3.4.1.2.
3.4.1.2. Expression of specific dissipation rate in heterogeneous conditions
The average specific dissipation rate  over the whole domain appears then as a certain function, f, of a set of internal variables (X1, X2…) randomly distributed inside the unit cells, around their average value over the whole domain.
In such a situation, a classical result in statistics (see [BEN 70]) links the mathematical expectation of the function, i.e. its expected measurable average, to the average values on internal variables, on the one hand, and on the other hand, to the dispersion of these internal variables at the second-order approximation
where the second derivatives are computed at average values of internal variables over the domain, and where the diagonal terms represent the variances of internal variables. Here appears how the second-order properties determine the sensitivity to heterogeneity. However, equation [3.12] links this sensitivity to the second-order features of function f, which are not directly accessible to experiment. Nevertheless, as we investigate here the conditions of initiation of macroscopic heterogeneity, we can reasonably admit that  , which is measurable, is a sufficient estimator for the relevant second-order features of f (eigendirections and signature); this is assumed in section 3.4.1.3.
3.4.1.3. Conditions of development/attenuation of heterogeneity
Let us consider a statistical fluctuation producing local deviations on internal variables, such as generating a local decrease in the specific dissipation rate over a sub-domain  (i.e. δ2 f < 0), this local decrease in the dissipation rate induces a decrease in the local resistance to motion, and so a trend toward motion concentration in
  by the effect of least resistance. As long as the dissipation rate remains lower in
  compared to other parts of the domain, this motion concentration lasts or even increases, i.e. increasing on
  the deviations on relevant internal variables, accelerating their evolution relative to the average value.
Conversely, a statistical fluctuation producing a local increase in the specific dissipation rate (i.e. δ2 f > 0) generates a local increase in the resistance to motion, and so a trend toward attenuation of motion over  and then a deceleration of internal variable evolution, relative to the average.
Note that the first situation corresponds to the development of heterogeneity, whereas the second corresponds to the attenuation of heterogeneity, in terms of evolution toward least dissipation. Also, note that relation [3.12] provides a simple approach to the above, attached to second-order features of the average energy dissipation rate.
3.4.2. The localization criterion
Within the above framework, strain localization can now be considered as the development of a heterogeneity in strain distribution generated by spontaneous fluctuation, associated to an increase of deviations in certain internal variables compared to their average, initiated by a negative sensitivity of the specific dissipation rate  . Globally, this process is another consequence of the minimum dissipation rule.
However, this requires entering further into the representation of evolution with strains, for which we will adopt a classical representation corresponding to basic ideas on the strain evolution set by early pioneers in metals plasticity, such as Nadaï (see [VAR 85]).
3.4.2.1. Representation of evolution with strains during motion
In the following, we consider motions near minimal dissipation, with simple coaxiality between stresses and strain rates. We admit that the main relevant internal variables are:
- – the specific volume vs;
- – an internal variable attached to cumulated deformations, designated by “specific deformation”, which defines evolution with strains, denoted as
 to retain the global consistency in the whole approach developed in Chapter 2; this “specific deformation” may satisfy a set of special conditions, presented in Appendix A.3.4, together with the possible solutions; we choose the following definition:
This quantity is homogeneous to a specific volume.
3.4.2.2. Analysis of experimental data on specific dissipation rate 
A detailed analysis of experimental data has been developed in [FRO 04]. This experimental data resulted from cautious monotonous triaxial compression tests (in Mode I) performed on granular materials constituted by crushed limestone particles, particularly angular and rough, with three different initial conditions in a specific volume, subjected to a moderate axisymmetric confining stress of 50 kPa (see Figure 6.1(a) in Chapter 6, for corresponding stress-strain curves and dilatancy diagrams).
After complete treatment, these data have been transcribed (Figure 3.13) into space  . The detailed analysis led to the following conclusions [FRO 04]:
- – During a monotonous solicitation under regular boundary conditions (such as the triaxial test), random heterogeneities coupled between specific deformation
 and specific volume vs tend to develop because of the minimum dissipation rule, as during motion the specific dissipation rate satisfies the condition
  along the trajectory followed in the space
  .
. - – Before reaching the “characteristic state” (i.e. the minimum generally observed in the specific volume), this coupling corresponds to a negative correlation between strain and specific volume, i.e. a deformation with contraction in volume.
- – After crossing this “characteristic state”, this coupling corresponds to a positive correlation between strain and specific volume, i.e. a deformation with dilatancy.
- – The intensity of this contraction or dilatancy remains limited by the second-order features of the surface
 , which exhibit crossed curvature relative to the two internal variables, and thus characteristic lines restricting the sectors where
  .
. - – Physical considerations on the dissymmetry between the two kinds of motion (volume contraction or dilatancy) suggest that the development of such heterogeneities with negative coupling is likely to remain more limited than with positive coupling, particularly for materials initially dense.
- – These elements point to the fact that the development of strain localization during monotonous solicitation initiates at least near the characteristic state, or even before for materials with low initial density.
These results, which point to an initiation of localization well before achieving peak resistance, are in conformity with published experimental results [ALS 03, ODA 98, NEM 01, PAS 93].
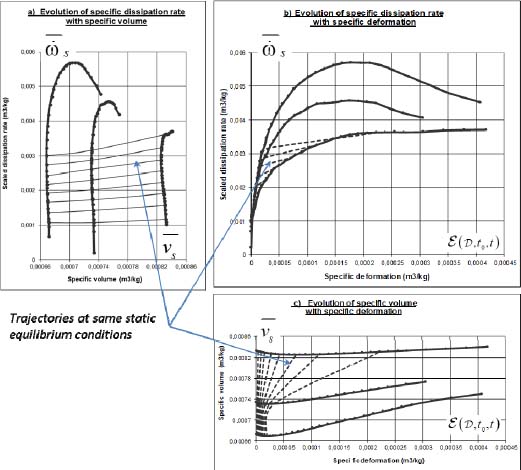
Figure 3.13. Experimental data [see Figure 6.1(a)] transcribed into space  . (a) Evolution of specific dissipation rate with a specific volume. (b) Evolution of specific dissipation rate with specific deformation. (c) Evolution of specific volume with specific deformation. For a color version of the figure, please see www.iste.co.uk/frossard/geomaterials.zip
3.5. Shear band evolution: the formation of failure lines
In this section, using all the preceding results on localization and shear band structure, we show that under monotonous solicitation:
- – in a domain subjected to a monotonous shear motion, the structure of a single shear band will evolve into the maximal concentration, as a consequence of conditions of heterogeneity development;
- – a shear motion distributed over a system of parallel shear bands will evolve into a single shear band, with maximum concentration in its axial zone.
In other words, the result of this chapter, widely corroborated by practice, implies that a monotonous shear motion leads to the formations of shear bands, which gradually transforms into the isolated failure lines.
Strictly speaking, the reasoning of section 3.4.1 on marginal dispersion within the material is no longer directly relevant when macroscopic heterogeneities develop. However, a qualitative reasoning is still possible, provided that the second-order variation of the specific dissipation rate remains of the same sign during motion, i.e.  , which is generally the case under monotonous solicitation and regular boundary conditions, without too rigid kinematic restrictions. In such a situation, between two heterogeneous motions which would provide the same dissipation rate calculated with average values on relevant variables, the material may tend to evolve into the motion that minimizes (at algebraic sense) the second-order terms of Variance and Covariance of equation [3.12]. For the localization structures in plane strain analyzed earlier, this average specific dissipation rate, outside the second-order terms, is the product of average shear stress exerted parallel to the shear band, multiplied by the average shear strain rate in the domain
  , and multiplied by the specific volume. If we compare material domains in which these three average parameters are identical, the equivalence of the dissipation rate is secured, outside the second-order terms.
For these second-order terms on the relevant internal variables  and vs, note that under plane strain
  can be expressed as a function of the average shear strain rate
Moreover, it has been seen (section 3.3.2) that the nominal shear Γ is linked to  by
by  , provided that volume strains remain negligible compared to shear strains.
This leads to
Otherwise, the respective variabilities of these quantities occur to be of a different order of magnitude:
- – From the tomographic measurements of Desrues et al. [DES 96], author’s own data, or micrometric measurements of Cresswell and Powrie [CRE 04], the relative variation of specific volumes during a motion with localization is about
 .
. - – From micrometric measurements of Nemat-Nasser and Okada [NEM 01], the relative variation of nominal shear during motion with localization is about
 , i.e. 20–50 times higher.
 - – If these two variables presented distributions approximately homothetic, the proportion between their variances would be about the square power of their relative variations, i.e. the variance on nominal shear would be 500–2,000 times higher than the variance on specific volumes.
These elements show that:
- – among the pertinent variables, the main one is
 ;
; - – the main variance term in [3.12] is Var(
 );
); - – the main term in this variance is
 .
.
Finally, if we compare stationary motions patterns, for which  , we have
Therefore, as long as  , among the allowed stationary motion patterns, the movement will tend toward the one maximizing
  .
.
3.5.1. Evolution of a single shear band
Let us consider a single shear band in a material domain with width L, in an imposed average shear field, as in section 3.3.4.1, where the shear profile may be written in the form:  where
where  .
.
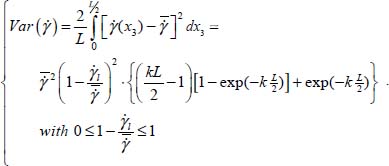
Over the band of width 2 × L/2, the variance of shear strain rate may be computed as follows:
Under an imposed average shear strain rate  , the pattern that maximizes
  is thus for
  , i.e. when the shear band reaches its maximal degree of concentration in its axis, with a motion vanishing outside the band, as
  .
.
For the fully concentrated shear band in a domain of sufficient width  , the variance is
3.5.2. Evolution of a set of parallel shear bands
Considering a set of n parallel shear bands, in a material domain of width L, subjected to an imposed average shear strain rate, these bands having reached their maximum degree of concentration, occupying different widths Li, with ∑Li = L and  .
.
For each of these shear bands, the variance is  , and for the set of n shear bands over the total width L, the variance is
It is shown in Appendix A.3.5 that the term in the sum is always between:
- – a maximum value of 1, when n = 1, i.e. when the set reduces to a single shear band of maximal concentration;
- – a minimum value of 1/n, when the n shear bands are of equal width and intensity.
Thus, the pattern which maximizes  is when the set reduces to a single shear band, concentrated up to the maximum.
3.5.3. Conclusions
The above results prove that, as long as  and provided that the boundary conditions are compatible with strain localization, the application of the minimum dissipation rule to heterogeneous patterns of deformation with a system of parallel shear bands, results in the concentration of motion in one single shear band concentrated to its maximum, with extinction of movements outside the band (Figure 3.14).
This pattern of evolution during the movement, seen from a large scale, corresponds to the formation of a quasi-discontinuity (the concentrated shear band schematized by a line) separating two masses “frozen in the movement” (extinction of deformations outside of the shear band), i.e. concretely the formation of a failure line, as shown in Figure 3.1.
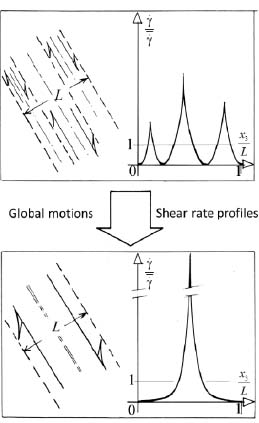
Figure 3.14. Evolution of a set of parallel shear bands


