Appendices
The following appendices contain detailed specific calculations associated with each chapter of the main text which are too long or too cumbersome to remain in the main text.
A.I. Appendix to Introduction
A.I.1. The “minimum dissipation rule”, as a corollary of the minimum entropy production theorem
- – In thermodynamics of continuous media [GER 86], the rate of irreversible entropy production
 is the sum of two terms,
  , with:
- -
 – the intrinsic specific dissipation;
 - -
 – the thermal specific dissipation, the function of heat flow
  and the rate of heat coming from outside r.
- -
When thermal dissipation is negligible or fixed, compared with another term (Φ2 ≃ 0, or even Φ2 constant), under given T, the minimum of  is the minimum of Φ1.
- – This intrinsic specific dissipation Φ1 is the difference between two terms:
- - the term vsTr{π}, the work rate of internal forces by unit mass;
- - the term
 , the work rate of reversible mechanical energy received by unit mass (e.g. the stored elastic energy in elastoplastic materials).
- – In our granular material constituted by ideally rigid particles, the work rate of reversible mechanical energy received by unit mass is null, and the intrinsic specific dissipation reduces to Φ1 = vsTr{π}. Therefore, when thermal dissipation is negligible (or fixed) compared with other terms, under given temperature, the minimum of irreversible entropy production is also the minimum of specific dissipation of mechanical energy (QED).
A.1. Appendix to Chapter 1 – tensor structures induced by friction
A.1.1. Minimum dissipation solutions to the mesoscopic equation of energy dissipation by contact friction: determination of corresponding distributions of contact actions tensors
This appendix is related to sections 1.2.4 and 1.2.5 of Chapter 1 and focused on the determination of distributions of elementary contact actions tensors within the granular mass in motion, achieving a minimal dissipation in equation [1.16].
The dissipation rate being minimal for the lowest possible value of the internal feedback rate R(A) = 0, the solutions investigated are the distributions of contact actions tensors p(c) satisfying the condition [1.18]:  .
.
Note that the proof given here through simple summations on discrete distributions representing a discrete finite set of contact actions tensors p(c) can be extended to integration over a continuous set representing a continuous statistical distribution of contact actions tensors (see Chapter 2, section 2.1.2).
For any distribution of elementary contact actions p(c), numbered from 1 to n, with random mutual orientations, we obtain the following:
- – always
 , as function N is a norm (section 1.1.2);
 - – the only distributions for achieving the equality are:
- - either all the eigendirections bearing p+(1),…p+(k),…p+(n) are identical;
- - either all the eigendirections bearing p−(1),…p−(k),…p−(n) are identical;
- - or both of the above conditions are satisfied simultaneously.
Note that the sum  is a tensor with positive trace, being a sum of positive trace tensors p(k) (property of elementary contact actions tensors); so, P owns at least one positive eigenvalue. Ordering the eigenvalues of tensor P by descending values, the following table summarizes all possible combinations, their connection with the “cases” analyzed further on, and the possibility of solutions.
| Signature of (P1, P2, P3) | Case analyzed | Possible solution |
| (+,−,−) | A | Yes: Mode I |
| (+,0,−) | A and B | Yes: Border Mode |
| (+,+,−) | B | Yes: Mode II |
| (+,+,0) | C | No |
| (+,+,+) | C | No |
| (+,0,0) | C | No |
Case A. P has only one positive eigenvalue P1 = P+
- – We call
 the direction - bearing P+.
In the eigen referential of each of the p(k), we take the following numbering convention: p1(k) = p+(k) > 0, p2(k) = 0, p3(k) = p−(k) < 0
and we note the coordinates of direction 
- – By summation of contributions of all tensors p(k) on the direction
 , the following expression is obtained:
In the above expression, the positive terms correspond only to p+(k), all other terms being negative; moreover, the trigonometric coefficients are all ≤ 1, thus  .
.
- – By definition
 and similarly for p+(k), taking into account the linearity of the Trace, the above inequality is obtained equivalent to
  .
. - – A solution securing the equality in the above inequalities would require the simultaneous compliance with the following two conditions in equation [A1.1]:
- - the trigonometric coefficients of the p−(k) are all null;
- - the trigonometric coefficients of the p+(k) are all equal to 1.
The only solution is that for all k,  are verified, i.e. that
  and the direction bearing p+(k) are identical.
- – Therefore, all eigendirections bearing p+(1),…p+(k),…p+(n) are identical to the one bearing P+ (QED); this kind of solution is called “minimal dissipation Mode I.”
Case B. P has only one negative eigenvalue P3 = P−
- – By a symmetrical reasoning of the above, but focused here on the negative eigenvalues, we find here the expression of P−, and the inequality
 equivalent to the inequality of the norms.
 - – Analyzing the conditions securing the equality, we find here that all eigendirections bearing p−(1),…p−(k),…p−(n) are identical to the one bearing P−; this kind of solution is named “minimal dissipation Mode II”.
Case C. All eigenvalues of P are positive (or null)
- – In this particular situation, Tr {P} = N {P} is verified; otherwise, we always have
 (linearity of the Trace).
 - – Each of the p(k) has eigenvalues of different signs, Tr {p(k)} < N {p(k)} for all k. Connecting with the above leaves
 .
. - – In this situation of strict inequality… there is no solution found to achieve equality.
A.1.2. Correspondence between equivalent pseudo-continuum and discontinuous granular mass: expression of strain rates function of micromechanical quantities
- – Assuming that the fluctuations in local covariances of stress and strain rates may be neglected relative to the average is a satisfied condition, the relation [1.22] becomes generally invertible, as the tensor of stresses is always regular and invertible because of the non-traction condition, i.e. determining
 and knowing
  and
and  .
.
However, this inversion, which is not easy in any referential, is simpler in the natural basis of stresses, because in this stress referential the components verify  . Then, resolving these relations, the following expression is obtained in the natural stress referential:

This expression becomes simpler in the case of coaxiality of the three tensors (note that if σ and  are coaxial, then π is also coaxial with the two others, as a result of the definition [1.2.2]), as in the common eigen referential, only diagonal terms are not null in the above expression.
However, as outlined in the main text, note that the validity of this particular expression of strain rates is subordinate to the validity of the assumption that fluctuations in the local covariances of stress and strain rates may be neglected relative to the average, which is stronger than the assumption that is strictly required for the global validity of the approach developed in this book.
- – If part of these covariances cannot be neglected (see Chapter 2, section 2.2.2.2, and Appendix A.2.4), then the relation
 does not hold any longer and shall be corrected by the covariances:
  .
.
As a result, the relation [1.22] is no longer directly invertible, and the above expression of strain rate will also be corrected to account for these covariances.
A.2. Appendix to Chapter 2 – compatibility with mechanical heterogeneity
A.2.1. Relations on statistical distributions of contact actions – a general case of 3D granular materials
Here, we treat in three dimensions the question treated in two dimensions in the main text (section 2.1.2.1): given a tensor of internal actions in a granular mass P, satisfying the dissipation equation, which conditions will satisfy a distribution of local contact actions tensors p in order to have tensor P as resultant?
Each local contact actions tensor p can be referenced in the global natural basis of the resultant P by the Euler angles of its local contact actions natural basis. The matrix for a change of basis (from local coordinates to global basis coordinates) is given by classical formulas (using the extrinsic convention 3-1-3 or Z-X-Z, with angles ψ,θ,φ, and abbreviated notations cψ, for cosψ, etc.)

In its own natural basis, the local contact actions tensor p is

In the global resultant tensor natural basis, whether the motion is in Mode I or Mode II, the internal actions of the granular mass P are

with  , this parameter α represents the participation of eigenvalue no. 2, to P− in Mode I (as P− is borne by eigendirections no. 2 and 3), and to P+ in Mode II.
Calling f(ψ,θ,φ) the participation in the global dissipation of all the local tensors of contact actions found between ψ and ψ+dψ, θ and θ+dθ, φ and φ+dφ, their contribution to the global tensor P will be given by  , where the tensor components tij are the components of local tensor
  transformed by the change of basis from local to global natural basis:
  , and the function f(ψ,θ,φ) is the density of dissipation by local contact actions, as a function of their orientation. This function can vary with time during motion.
Then, by integrating over ψ,θ,φ (between 0 and 2π for ψ and φ, 0 and π for θ)

Thus, after explicit formulation of all the relevant terms, in the natural basis of the global tensor of internal actions in the granular mass P (or the natural basis of the average tensor), the distribution f(ψ,θ,φ), density of dissipation by local contact actions as a function of their orientation, satisfies at any time of motion the system of seven conditions given on the next page.
Note that for a given R, the set of solutions f(ψ,θ,φ) satisfying this system of seven conditions is again a convex set, and that given a particular solution f0, any other solution f will be of the form:  , where
  is a solution of the homogeneous linear system of the six last conditions with zero on their right-hand side, and may be again interpreted as a distribution of fluctuations, or deviations around f0.
However, given the complexity of this system of seven conditions, the detailed analysis of its solutions, in a similar way to how it is displayed in the main text for 2D granular materials (Chapter 2), is yet to be developed.
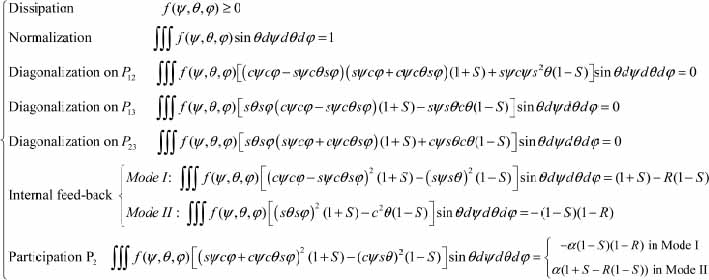
(The simplest way to get the condition on internal feedback is on the eigendirection of its unique sign, which ever the Mode: direction no.1 for Mode I, no.3 for Mode II).
A.2.2. Particular property of usual experimental situations, regarding heterogeneity
Here, we show that a wide range of usual experimental conditions, provided that the response of the material is coaxial to the exerted solicitation, naturally satisfy the following conditions [2.11]: 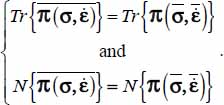
A.2.2.1. Experimental configurations considered
- – Consider a parallelepipedal material specimen, confined in an extensible membrane, which will constitute our domain
 , related to the referential of the attached sketch, attached to the geometry of a moving domain, and centered on its center of gravity. The specimen is submitted on its external faces to two kinds of boundary conditions:
- - (a) conditions imposed on the normal displacement velocity component, this component being uniform on the pair of faces considered (systems of rigid platens);
- - (b) conditions imposed in normal stress, which is uniform and purely normal on the pair of faces considered (systems by contact pressure);
- - (c) the contact devices between the specimen and the external apparatus are such that the distributions of contact forces, which are not uniform everywhere (faces with imposed displacement conditions), are normal everywhere (use of lubricated end platens and membranes), and their resultants on the faces remain centered.
- - (d) we consider the materials whose response maintains the symmetries of imposed solicitations, for which the deformed specimen remains sensibly parallelepipedal during motion.
- – These conditions correspond to classical experimental tests without axis rotation, that is:
- - the axisymmetric conditions in stresses of “triaxial apparatus” (one condition in normal component of displacement, two identical conditions in normal stresses);
- - the conditions of plane strain “biaxial apparatus” (two conditions in normal displacement, one condition in normal stress);
- - the conditions of three-dimensional compression apparatuses, the type found at I.M.G. Grenoble (France), or Berkeley University (USA), Hohai University in Nanjing (China), etc.
As in the usual interpretation of these experiments, we neglect the effect of gravity.
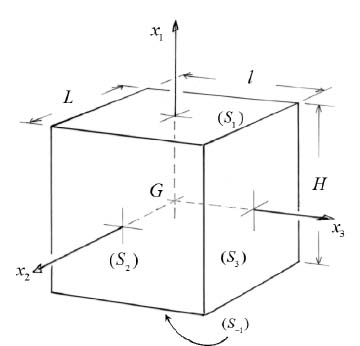
- – Let us consider, to ground our ideas, a solicitation type Mode I, with imposed conditions in normal displacement velocity on direction x1, in normal stresses on direction x2, and again in normal displacement on direction x3; let us represent the external forces exerted on specimen faces by a density of forces
 and by
  , the local displacement velocities of material points on these external faces where these forces are exerted.
A.2.2.2. Tensor of external actions
Consider the tensor  formed by the symmetrical product of external forces and velocities of their points of application on the external boundary of domain
  . In the following, we will term this tensor as “tensor of external actions”; note that this trace is the work rate of external forces:
  , and analyze the contributions brought by the faces of our specimen to this tensor of external actions.
- – On the faces S1 and S−1, the density of forces being normal is
 , the contribution to TE brought by the faces S1 and S−1 is then
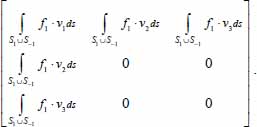
The diagonal term can be transformed by taking into account the following:
- - the condition of displacement (uniformity of v1);
- - the equalities, by definition,
 and
and  ;
; - - the equality (equilibrium condition and definition of average stresses)
 leading to this diagonal term:
  .
. - – The contribution brought by the faces S2 and S−2 is similar. Taking into account the stress boundary conditions (here
 with f2 being uniform on S2 and S−2) of the definitions of average values, equilibrium condition, and convention of the sign, the obtained diagonal term is
  .
. - – The contribution of faces S3 and S−3 is set by the transposition of S1 and S−1 results.
- – Finally:

Examine non-diagonal terms, such as  :
:
- - if the specimen remains parallelepipedal during motion, then on S1 and S−1:
 with
with  ;
; - - if the resultant forces exerted on external faces remain centered, then on S1 and S−1:
 with
with  on the one hand (definition of average stresses and equilibrium), and, on the other hand,
  because of the centering condition;
 - - the non-diagonal term is thus a function of the product of local heterogeneities in velocities and in the distribution of contact forces:

- - provided that boundary conditions and the response of specimen are regular enough, these terms are normally null or of the second order compared to the products of average quantities;
- - for the granular material under deformation, we assume that these irregularities are sufficiently decorrelated so that it is the case when the dimension of the specimen is large enough compared to the average size of particles.
- – So, at least at the first order, we have:

A.2.2.3. Identification with a tensor of internal actions, through energy considerations
The eigenvalues of TE (as those of  ) can be interpreted as fluxes of mechanical energy as the outside exchanges with our material domain
  through its boundaries. In our quasi-static conditions, and for physical consistency, these fluxes will balance 2 by 2, with the corresponding fluxes of the internal actions tensor, i.e. in our conditions of Mode I (
 , only of its sign), the flux of mechanical energy provided by external actions to the domain
  along the eigendirection no. 1, which is
  , will be equal to the flux of mechanical energy received by the domain
  on this eigendirection no. 1, which is our “input power”
  . So,
. So,  .
.
Complementing the reasoning along the other eigendirections and forming the corresponding summations, we arrive at the following equation:

Similarly, with the norm  .
.
These are the intended conditions [2.11], but naturally satisfied (QED).
A.2.3. Compatibility with mixed heterogeneity in strains and stresses
Here, we show that the local compliance with the dissipation equation also implies its verification by average values of stresses and strain rates on the material domain despite the presence of heterogeneities as defined in section 2.2.1.3.
- – As a result of the sign conditions and mutual independence stated in relation [2.8], first note that for any i:

- – Integration on
 of the local dissipation equation, by taking into account the first of the above observations, leads to:

By taking into account the second of the above observations, the integrals on both sides may be condensed, leading to

- – The factor including the integral appearing on both sides is generally not null and can be simplified on both sides. The result is the same dissipation equation as in its local expression but written with the average values of stress and strain rates (QED).
A.2.4. Necessary and sufficient compatibility conditions for stress and strain rates local heterogeneities
Here, we discuss the analysis of consequences of conditions [2.11] on  , for each mode:
- – Under Mode I with signature (+,−,−), the natural basis of
 and
and  corresponds to each other by a rotation around their common eigendirection bearing the unique positive eigenvalue π+ which is the same for both tensors. Therefore, in the difference between the two tensors, which is
  , all terms corresponding to that eigen direction are null, either along the corresponding line or column. The remaining terms along the 2 other eigen directions are those of a symmetric tensor, moreover satisfying with
  .
.
Ordering the eigendirections by descending values of eigenvalues, we obtain  , with the complementary conditions of null Trace (c22 + c33 = 0), symmetry (c32 = c23) and conservation of mode signature
  and
and  .
.
- – Under Mode II, with signature (+,+,−), a symmetric reasoning, which particularizes here the eigendirection bearing the unique negative eigenvalue π−, leads to the form:
 , with the corresponding complementary conditions.
 - – Under plane strain Border Mode, with signature (+,0,−), which constitutes the border between Mode I and Mode II, the tensor
 is of both forms found simultaneously for Modes I and II; this condition, added to the condition of null trace, leads to the form
  .
.
A.3. Appendices to Chapter 3 – strain localization and shear banding
A.3.1. Orientation of localization surfaces
Here, we investigate, for each mode of minimal dissipation, the surfaces within the material in motion, which satisfy the following conditions:
- – (a) present an orientation envelope of elementary contact sliding motions, corresponding to the considered mode;
- – (b) present a flux of mechanical energy, in the sense of internal actions, purely tangential.
We begin with the situations very close to theoretical minimum dissipation (with  confounded with ϕµ) and later discuss the situations belonging to the wider neighborhood of minimal dissipation.
- – Consider Mode I motion, in the natural basis of internal actions of granular mass P(A), with signature (+,−,−), and order the eigendirections in descending order of the corresponding eigenvalues:
- - the normal vectors to tangent planes at elementary sliding contacts are distributed on a cone of revolution, whose axis is the eigendirection bearing P+, and making an angle of
 with this axis, can be written as on the natural basis:
 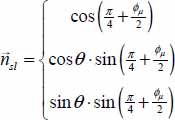 ;
; - - in its natural basis, the tensor P(A), solution of minimum dissipation equation in Mode I, can be written as follows:
- - the normal vectors to tangent planes at elementary sliding contacts are distributed on a cone of revolution, whose axis is the eigendirection bearing P+, and making an angle of

with  , the parameter α representing the repartition of P− between the eigendirections nos 2 and 3.
- – A surface within the material in motion locally presents a purely tangential flux of mechanical energy, in the sense of internal actions, if and only if its normal locally satisfies with
 :
:
- - then, the normal
 satisfying this condition is such that:
- - then, the normal
α cos2 θ + (1 − α)sin2 θ = 1 which yields  , with
  .
.
- – The only possible solution is then cos2θ = ±1, with α = 0. This corresponds to plane strain (P2 = 0), and Rankine’s slip lines directions.
- – Considering now Mode II motion, with signature (+,+,−), a symmetric reasoning, which particularizes the direction bearing P−, leads to the same result.
Now, consider the situations not so close to theoretical minimum dissipation, with  no longer confounded with ϕμ, because of the internal feedback R(A) ≠ 0. As the motions we consider remain in a certain neighborhood of minimum dissipation, the polarization of the distribution of local contact actions tensors, although somewhat fuzzy, will nevertheless remain pronounced (see section 2.1.2). Therefore, the main orientation of the localization surface remains, although some dispersion in local contacts sliding will appear inside the corresponding shear band, leading to some diffusion of the movement toward outside the shear band, this being the subject of section 3.3 in Chapter 3.
In conclusion, the orientation of the shear band is the one found for situations very close to theoretical minimum dissipation, the orientation of localization surfaces is both at  off the direction bearing P+, and at
  off the direction bearing P−, the general motion being in plane strain near this surface. This orientation corresponds to Rankine’s slip lines orientations (QED).
A.3.2. Orientation of chains of active forces nearby a shear band
Here, we show that the orientation of chains of active forces is symmetric to the orientation of the localization surface, relative to the direction bearing π+. We again begin with situations very close to theoretical minimum dissipation (with  confounded with ϕμ) and later discuss the situations belonging to the wider neighborhood of minimal dissipation.
- – Consider a sub-domain
 of the localization surface, which is kinematically equivalent to a tangential discontinuity in velocity, which we note
  , let
, let  be the force equivalent to the system of active forces exerted on
  , the internal actions tensor on
  is given by
  .
. - – Noting θ as the angle between the directions of
 and
and  , this tensor, in the natural basis of internal actions over the whole domain (this natural basis always exists over a domain in plane strain motion), is given by:

- – Because of the internal similarity property of the plane strain minimum dissipation mode, this tensor is similar to the tensor of internal actions of the whole domain, given, in the same natural basis, by

- – Take into account that:
- - as there is energy dissipation in the sub-domain
 ,
,  ;
; - - the no-tension condition makes the normal component of
 on the surface to be in compression;
- - as there is energy dissipation in the sub-domain
The analysis of all possible situations for a given  shows that there is only one solution for the direction of
  , the direction symmetric to
  , relative to the axis bearing π+.
- – Now, considering the situations not so close to theoretical minimum dissipation, an argument similar to Appendix A.3.1 may be developed: the global trend will remain with the same orientation; however, local orientation of active forces may present some dispersion around this global trend.
A.3.3. Energy dissipation balance within the stationary shear band
Here, we set the detailed energy balance inside the shear band stationary structure, in the framework of section 3.3.3, together with Figure 3.8 in the main text.
- – As stated in section 3.3.3, the shear band is divided into layers parallel to the axis, and each layer (n) is divided into elementary cells (Figure 3.8) of equal mass mn. In the cell of layer (n), the internal action tensor P(n) of the granular mass included in the cell is a solution of the dissipation equation [1.16] with internal feedback (section 1.2.4), and it is in plane strain. Its Trace, which gives the rate of dissipated energy in the cell, can be related to the specific dissipation rate
 by:
by:  . The tensor P(n) can be expressed in its natural basis as follows:

- – This tensor P(n) is itself the sum of the elementary contact actions tensors of all the contacts contained in the cell P(n) = Σp, and by definition of internal feedback rate (section 1.2.4), we have the following relations between input and output powers:
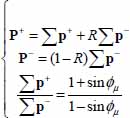 , these terms can be expressed in the function of the specific dissipation rate
  ; noting
  , the sum of elementary input power of all contacts contained in the cell of layer (n) is:
  .
. - – In the following, we assume that the size of the cell is such that the feedback exchanges with the outside are predominant when compared to the feedback exchanges inside the cell (rigorously speaking, the feedback exchange partition between outside and inside the cell could be taken into account with a partition coefficient; however, it does not change the global picture). Therefore, the feedback flux emitted by the cell is
 .
. - – This flux splits into inter-layer flux that will feed the adjacent layers (n − 1) and (n + 1), and intra-layer flux that is a simple exchange with the adjacent cells in the same layer (n). Noting α as the anisotropy coefficient defining the proportion of this distribution [α = (intra-layer part)/(inter-layer part)], the feedback flux emitted by our cell of layer (n) will split into:
- - intra-layer part worth
 ;
; - - inter-layer part worth
 , emitted half toward layer (n − 1) and half toward layer (n + 1).
- - intra-layer part worth
- – From the above elements, we can now set the energy balance of our cell, which equals the input power of all contacts contained in the cell of layer (n), with the sum of:
- - feedback flux transmitted by layer (n − 1):

- - feedback flux transmitted by layer (n + 1):

- - feedback flux internal to layer (n):

- - feedback flux transmitted by layer (n − 1):
This leads to the energy balance for the cell in layer (n):

- – This balance may be simplified into:
This relation is the equation of energy dissipation diffusion, by internal feedback effect (a discretized form of a second-order linear ordinary differential equation). It defines a classical recurrent sequence whose solutions are linear combinations of two independent particular solutions:  , where these particular solutions ω1, ω2 are the roots of the following equation:

- – As we focus here on the dissipation profile decaying from a maximum taken as the origin, the relevant root is the one <1, as follows:
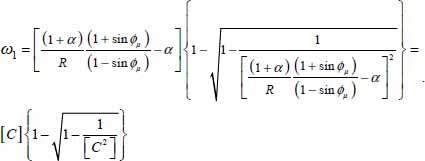
For R <1/2, sin ϕμ about 0.5, and α > 0, the above expression [C] is generally far greater than 1. A limited series expansion provides  , then:
  leading to equation [3.8] in section 3.3.3.
A.3.4. Specific deformation function
- – In the framework of section 3.4.2.1, the analysis of the properties of such a quantity
 required to maintain consistency with the whole background of the present approach leads to at least the following five properties:
- - (a) The quantity
 is cumulative over time, i.e. between two consecutive dates t0 ≤ t1 ≤ t2, it satisfies

- - (b) This quantity is extensive over a material domain relative to the mass; if
 are two disjoint sub-domains, it satisfies

- - (c) Being associated with an irreversible process of energy dissipation,
 presents also the property of irreversibility, i.e. it is a strictly monotonous function of time as soon as
  over a sub-domain of
  ; we choose a strictly increasing function.
 - - (d) The increment rate of
 is positively homogeneous and of degree 1, relative to the average strain rate
  over
over  .
. - - (e) The quantity
 has the same degree of compatibility with the heterogeneity of internal movements, as the dissipative process itself, at least near the minimal dissipation.
- - (a) The quantity
- – The above properties imply that:
- - From (a) and (b), ε shall include an integral over time, and over the material domain, and shall be of the form

- - The function f in this integral satisfies the above three properties (c), (d), (e), and is objective, i.e. formed with invariants of degree 1 of the tensor
 , compatible with heterogeneity:
  .
.
- - From (a) and (b), ε shall include an integral over time, and over the material domain, and shall be of the form
- – The only invariant of degree 1 always compatible is the Trace, because it is linear. However, it will not be relevant here because it is directly related to the specific volume, already taken into account (remember that
 ), so another objective function is required.
 - – In the case of simple coaxiality (when σ,
 , and then also π have locally the same eigendirections, which are not necessarily fixed over the considered domain), and near minimal dissipation, the norm
  turns out to be compatible with heterogeneity, and being positively homogeneous and of degree 1 relative to
  , it satisfies the properties (c)–(e).
Let us prove this compatibility in the case of Mode I, with signature (+,−,−):
- - It has been seen in section 2.2.1 that in conditions of coaxiality with fixed directions, the condition of mode signature attached to internal actions is transferred to the strain rate tensor, i.e. that in the domain, the signature of
 is everywhere (+,−,−); this property extends without difficulty to the case of simple coaxiality.
 - - Moreover, the eigendirection bearing the unique positive eigenvalue of the local tensor
 is the same over the whole domain (property of Mode I near minimal dissipation); hence, it is also the eigendirection bearing the unique positive eigenvalue of the average tensor
  .
. - - Then on this eigendirection (and only that one) is satisfied the property: the average of the unique positive eigenvalue of the local tensor
 is effectively the unique positive eigenvalue of the average tensor
  , i.e.
  .
. - - As Mode I satisfies
 , the property found above implies that
  .
. - - As the Trace, linear operator, always satisfies
 , the property found above implies that
  , i.e. the compatibility property looked for.
 - – A symmetrical reasoning in Mode II leads to the same result.
- – Note that under plane strain, with signature (+,0,−) we have
 , i.e. the maximal shear rate (under plane strain…).
 - – This whole discussion leads us to select for
 the following definition, valid for all modes, related to a particularly significant quantity under plane strain:

A.3.5. Variance maximum for a set of parallel shear bands
Here, we analyze the variance of strain rates in the case of the n parallel shear bands system of section 3.5.2:  where the average shear rate
  , material parameter k, and the width of domain L, are fixed quantities, and ΣLi = L.
- – Maximum: observe that if n > 1 then all
 are strictly <1, then for all i
  , hence
  . So, the maximum of this variance is reached when the set reduces to one single shear band (n = 1).
 - – Minimum: let us note
 , the sum of all these differences being null by construction
  . Then

So, the minimum is reached when all the ui are null, i.e. when the parallel shear bands are of equal width  .
.
A.4. Appendix to Chapter 4 – micromechanical basis of the Coulomb Criterion
In this appendix, the different strain modes allowed at a critical state are analyzed extensively, under three-dimensional stress states, for the least shear-resistant solutions, and the least dissipative ones, leading to the Failure Criterion. As this analysis requires wide algebraic development, we note for simplification  .
.
Elimination of reverse modes of Table 1.2
The condition of positive dissipation Tr{π} > 0 results in the elimination of Reverse strain Modes I and II. For Mode I Reverse (only  ), as here only the last term of
  is positive, and as σ1 ≥ σ2 ≥ σ3 > 0 it implies that
  and as
  , it would imply Tr{π} ≤ 0, excluded by the positive dissipation condition. For Mode II Reverse (only
  ), the same relation
  is found, leading to the same conclusion.
Another consequence of the dissipation relation is that under isotropic stresses it is written  , which is not compatible with the critical state condition
  , so here under critical state conditions, it is σ1 > σ3.
Useful relations with deviatoric parameters {b, c}
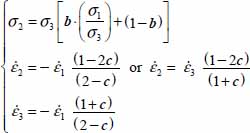
To ease the analysis, it appears useful to express principal stresses and strains in function of deviatoric parameters  and
and  (note that the convention on the order in principal stresses σ1 ≥ σ2 ≥ σ1 > 0 makes that 0 ≤ b ≤1, there are no restrictions on values for c, and the constant volume condition
  has no incidence on the deviatoric parameter c)
A.4.1. Least shear resistance criterion
For each of the modes defined in Table 4.1, we investigate the eventuality of a minimum of the ratio  , for all allowed values of deviatoric parameters b, c.
Mode I Direct

This mode corresponds to −1 ≤ c ≤ ½.
As  and
and  ; the internal work rate is here
  , always > 0, the dissipation condition Tr {π} > 0 does not bring further restriction in this Mode I Direct.
The dissipation equation [1.30b] becomes  ; then, by substituting to σi, and
  with their expressions in function of b and c, the above equality, after simplification, becomes:
  .
.
Let us observe that for 0≤b≤1 and  :
:
- – always
 , provided that
  , this last inequality corresponding to the limit of tensile stress condition (i.e.
  becomes ∞);
 - – then first inequality becomes an equality only if c = 1/2 (plane strain
 ) or if b = 0 (axisymmetric stresses σ2 = σ3).
In conclusion, we have shown that under strain Mode I Direct, for all allowed parameters b (0 ≤ b ≤ 1) and c (−1 ≤ c ≤ ½), provided that  , this condition represents the limit of tensile stress conditions; then:
- – the dissipation equation implies that
 ;
; - – the equality is only verified either under plane strain upon intermediate principal stress direction (
 or c = 1/2), irrespective of the stress state parameter b (0 ≤ b ≤ 1), or under axisymmetric stresses σ2 = σ3 (i.e. b = 0), irrespective of the parameter c (−1 ≤ c ≤ ½).
Mode II Direct

This mode corresponds to ½ ≤ c < 2.
As  and
and  ; the internal work rate is here
  , always > 0, the dissipation condition Tr {π} > 0 does not bring further restriction in this Mode II Direct.
The dissipation equation becomes:  ; then, by substituting to σi, and
  with their expressions in function of b and c, the above equation, after simplification, becomes:
  .
.
Let us observe that, for 0 ≤ b ≤ 1 and  :
:
- – always
 ;
; - – the equality is only satisfied if either c = 1/2 (plane strain
 ) or b = 1 (axisymmetric stresses σ1 = σ2).
In conclusion, under this strain Mode II Direct for all allowed parameters b and c:
- – the dissipation equation implies that
 ;
; - – equality is only satisfied either under plane strain
 upon intermediate principal stress direction or under axisymmetric stresses σ1 = σ2 (i.e. b = 1).
Mode I Transverse

This mode corresponds to 
As  and
and  ; the internal work rate is here
  , which will be positive only if
  ; then, by substituting σi, and
  with their expressions in function of b and c, this inequality reduces to
  (for c ≤ –1 or c ≥ 2). This is the restriction to be verified in this Mode I Transverse in order to satisfy the dissipation condition Tr{π} > 0.
The dissipation relation here becomes:  ; then, by substituting σi, and
  with their expressions in function of b and c, the above equation, after simplification, becomes:
  , with the condition
  , in which the numerator and denominator are maintained with the same sign corresponding to the limit of the tensile stress condition (i.e.
  becomes ∞), more restrictive than the above condition for Tr{π} > 0.
- – As σ1 > σ3, the above dissipation relation becomes inequality
 , and as
  , this inequality becomes
  .
. - – This inequality becomes equal if either
 (plane strain, c = 2) or if σ1 = σ3, but this last situation, which means isotropic stresses, is incompatible with the critical state, as noted above (see section 4.1), and is not relevant.
 - – Finally, either c ≠ 2, then
 ; as σ1 ≥ σ2, we have
  ; or c = 2, we have
  , the equality being satisfied only if σ1 = σ2 (axisymmetric stresses b = 1).
In conclusion, under this Mode I Transverse strain for allowed parameters b and c:
- – the dissipation equation implies that
 ;
; - – equality being only satisfied either under plane strain
 and axisymmetric stresses σ1 = σ2 (i.e. b = 1), taking into account this symmetry, the order between principal directions no. 1 and 2 becomes undifferentiated, and the situation is identical to axisymmetric stresses σ1 = σ2 associated with plane strain
  .
.
Mode II Transverse

This mode again corresponds to  .
.
As  and
and  the internal work rate is here
  , which will be positive only if
  ; then, by substituting σi, and
  with their expressions in function of b and c, this inequality reduces to
  (for c ≤ –1 or c > 2). This is the restriction to be verified in this Mode II Transverse in order to satisfy the dissipation condition Tr{π} > 0.
The dissipation relation here becomes:  , then, by substituting σi, and
  with their expressions in function of b and c, the above equation is simplified as:
  , with again the condition
  corresponding to the limit of the tensile stress condition (i.e.
  becomes ∞), more restrictive than the above condition for Tr{π} > 0.
As σ1 > σ3, the above dissipation relation becomes an inequality
 , so
, so  except if
  and σ2 = σ3.
In conclusion, under this Mode II Transverse strain for all allowed parameters b and c:
- – the dissipation equation implies that
 ;
; - – equality being only satisfied either under plane strain
 (i.e. c = –1) and axisymmetric stresses σ2 = σ3 (i.e. b = 0), taking into account this symmetry, the order between principal directions no. 2 and 3 becomes undifferentiated, and the situation is identical to axisymmetric stresses σ2 = σ3, associated with plane strain
  .
.
A.4.2. Least dissipation criterion
For the modes defined in Table 4.2, we investigate the eventuality of a minimum of the ratio  , for all allowed values of deviatoric parameters b and c, where Tr{π} is the internal work rate for each of the strain modes investigated, and Tr{π0} is the internal work rate of the reference plane strain solution
  under the same boundary conditions as the considered strain mode.
Useful relations
In addition to the useful relations displayed in Appendix A.4.1, other relations bind the dissipated energy rate, resulting from the dissipation equation, which always links the dissipated energy rate Tr{π} to the input power π+, sum of positive eigenvalues of the tensor π, i.e.  , and the output power π–, sum of negative eigenvalues of the tensor π, i.e.

- – For the plane strain reference solution π0 with
 (then
(then  , as
, as  )
)

As  and
and  , the above ratio becomes
  .
.
A.4.2.1. Boundary conditions A (fixed  )
)
For the three allowable strain modes Mode I, Mode II Direct, and Mode II Transverse, we will now compare the dissipated energy rate Tr{π} > 0 with the dissipated energy rate of reference plane strain solution Tr{π0} > 0 under the same boundary conditions.
Mode I Direct

This mode corresponds to –1 ≤ c ≤ 1/2.
The energy dissipation rate is given here by  and relative to the reference plane strain mode:
Therefore, the minimum of the ratio  under this strain Mode I Direct is identical to the minimum of the ratio
  , already determined in section 4.1.
Mode II Direct

This mode corresponds to 1/2 ≤ c < 2.
The energy dissipation rate is given by  . As
. As  may be expressed as a function of given boundary condition by
  , then
  , and relative to the plane strain reference solution Tr{π0}, it is simplified to
  which is always ≥ 1 as here 1/2 ≤ c < 2, the equality being reached only for c = 1/2 (i.e. plane strain
  ).
).
Therefore, we have shown here that under our given boundary conditions, whatever the parameters b and c satisfying 1/2 ≤ c < 2 under this strain Mode II Direct:
- – the dissipation relation implies that
 ;
; - – the equality is only reached for plane strain upon intermediate principal stress direction (c = 1/2, i.e.
 );
); - – out of plane strain solution, the case of axisymmetric stresses σ1 = σ2 (i.e. b = 1) is not in itself a situation reaching equality, although in this situation the dissipation relation yields directly
 .
.
Mode II Transverse

This mode again corresponds to  .
.
The energy dissipation rate is given by  . As
. As  may be expressed as a function of given boundary condition by
  , then
  , and relative to plane strain reference solution Tr{π0}, it yields
  .
.
We observe that
- – For c ≤ –1 then
 , and as by convention
  except when σ2 = σ3 (i.e. b = 0), thus
  ; equality being verified only for c = –1 (i.e. plane strain
  ) and axisymmetric stresses σ2 = σ3 (i.e. b = 0), in that situation, the ranking between principal directions 2 and 3 becomes undifferentiated, and the situation is then confounded with
  and σ2 = σ3.
 - – For c > 2, we have
 , and as by convention
  , it yields
  .
. - – For numerical applications, as
 , then
  is expressed by
  ; using now the expression of
  determined in section 4.1 and referring to
  , all results expressed in function of b and c.
In conclusion, under this strain Mode II Transverse, only one particular solution realizes a relative minimum of dissipated rate: it is confounded with the axisymmetric stresses σ2 = σ3 (i.e. b = 0), associated with plane strain  = 0.
= 0.
A.4.2.2. Boundary conditions B (fixed  )
)
Mode I Direct

This mode corresponds to −1 ≤ c ≤ ½.
The energy dissipation rate here is  . Then, relative to reference plane strain (for c = 1/2) under the same boundary conditions
  :
:  , hence
  Therefore, the minimum of the ratio
  under this strain Mode I Direct is the minimum of
  for −1 ≤ c ≤ 1/2, i.e. for c = 1/2 (plane strain
  ) whatever the value of b, otherwise the ratio is > 1.
In conclusion, under our given boundary conditions, whatever the parameters b and c satisfying ½ ≤ c < 2 under this strain Mode I Direct:
- – the dissipation relation implies that
 ;
; - – the equality is only reached for plane strain upon intermediate principal stress direction (c = 1/2, i.e.
 );
); - – out of plane strain solution, the case of axisymmetric stresses σ2 = σ3 (i.e. b = 0) is not in itself a situation reaching equality, although in this situation, the dissipation relation directly yields
 (see section 4.1).
Mode II Direct

This mode corresponds to ½ ≤ c < 2.
The energy dissipation rate here is  , and reference plane stain
  . Then,
  .
.
Here, the minimum of the ratio  under this strain Mode II Direct is the minimum of
  . As the initial conditions of these boundary conditions are under isotropic stresses
  , this stress ratio can decrease until it is physically limited by the shear Failure Criterion
  : once it is reached, the material can experience large strains under quasi-static conditions, and the resulting ratio
  is equal to 1. The ratio
  could be forced to be further reduced, however the motion would no longer remain quasi-static and would enter into dynamic behavior, out of our present scope.
In conclusion, under our given boundary conditions B, whatever the parameters b and c satisfying ½ ≤ c < 2 under this strain Mode II Direct:
- – the dissipation relation implies that
 ;
; - – the conditions achieving the equality are the same as the least shear resistance criterion.
The treatment of Mode I Transverse, similar to the above treatment of Mode II Transverse under boundary conditions A, although submitted to stronger restrictions due to dissipation condition (see section 4.1), does not bring further significant features.
A.4.3. Incidence of small deviations from least shear resistance solution
The deviatoric relation selected here, and represented in Figure 4.8(a), is

A.5. Appendix to Chapter 5 – coupling shear strength and volume changes
A.5.1. Basic dilatancy inequalities for the six allowed strain modes
Here, we show the basic inequalities listed in Table 5.1 taking into account the dilatancy rate d as defined in section 5.1.
Mode I Direct

We treat first the situation 0 < b < 1, which implies that both 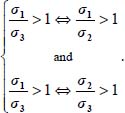
The dissipation relation yields  , substituting σ2 to σ3, as σ2 > σ3, the above equality becomes
  which can also be written as
  or with the dilatancy rate
  . As
. As  , the above inequality also means: if
  then
then  . Similarly, now substituting σ3 to σ2 yields
  , hence
  . Therefore, when 0 < b < 1, we have
  (QED).
Note that these last two inequalities transform into simple equalities either when the substitutions become indifferent, which occurs when σ2 = σ3, i.e. axisymmetric stresses b = 0, or when one of the principal internal actions  or
or  disappears from the dissipation relation, which occurs when
  or
or  , i.e. plane strain. For b = 1, these last two inequalities remain valid without a change (except that here
  ).
).
Mode I Transverse

The dissipation relation yields  , so substituting here σ1 and σ3, we have
Note that these last two inequalities transform into simple equalities either when the substitutions become indifferent, which occurs when  , i.e. isotropic stresses, or when one of the principal internal actions,
  or
or  , disappears from the dissipation relation, which occurs when
  or
or  , i.e. plane strain.
Mode I Reverse

The dissipation relation yields  , so substituting here σ1 and σ2, we have
Note that these last two inequalities transform into simple equalities either when the substitutions become indifferent, which occurs when σ1 = σ2, i.e. axisymmetric stresses b = 1, or when one of the principal internal actions,  or
or  , disappears from the dissipation relation, which occurs when
  or
or  , i.e. plane strain.
Mode II Direct, Transverse, and Reverse can be treated similarly, particularizing the strain rate unique of its sign (here negative) and substituting the principal stresses borne by the two other eigendirections. In Mode II Direct, we also have the property: if  then
then  .
.
A.5.2. Generalized stress–dilatancy relations and peak shear strength
Useful analytical relations
These are the same as in Appendix A.4 for the expression of intermediate principal stresses in a function of the deviatoric parameter and the dissipated energy rate.
For the plane strain reference solution π0 with  and
and  (d0 dilatancy rate)

For the allowable strain modes Modes I and II Direct, and Modes I and II Transverse, we will now compute the principal stress ratio  , and for the allowable strain modes under boundary conditions A, we will compare the dissipated energy rate Tr{π} > 0 with the dissipated energy rate of reference plane strain solution Tr{π} > 0 under the same boundary conditions (
 and σ3).
Mode I Direct (+,−,−)
Combining the definition of the generalized dilatancy rate  with the definition of deviatoric parameter c provides the following expressions of
  :
:

The constraints on parameters for this mode are 
- – The dissipation relation yields
 then, by substituting σi, and
  with their expressions in function of b, c, and d, the above equality, after simplification, becomes

This is a homographic function of each of the parameters b, c, and d whose numerator and denominator are always > 0, provided that  , this last inequality corresponding to the limit of the tensile stress condition (i.e.
  becomes ∞). This homography is an increasing function relative to b and d, and a decreasing function relative to c; given the above constraints on parameters b, c, and d, it has a minimum for b = 0 (axisymmetric stresses), or
  (Plane Strain
  ), that minimum being
  , which constitutes the least shear strength criterion under this Mode I Direct with dilatancy, this Failure Criterion being the critical state one, enlarged by the dilatancy rate (QED).
The above expression transforms into

This is the generalized stress–dilatancy relation for this Mode I Direct (QED).
- – The energy dissipation rate is given here by
 , then relative to the reference plane strain mode:
Then, 
As outlined above, this homographic function of b, c, and d has a minimum for b = 0 (axisymmetric stresses) or  (plane strain
  ), and that minimum is equal to d. So,
- – In conclusion, we have shown that under strain Mode I Direct, for all allowed parameters b, c, and d

except for b = 0 (axisymmetric stresses), or  (plane strain
  ) for which the inequalities become equalities. So:
- - if the boundary conditions and internal evolution of the material do not allow the material to reach one of the conditions for the minimum, the peak strength criterion found will correspond to the maximum dilatancy rate during the motion and will be exterior to the critical state Coulomb Criterion enlarged by the maximum dilatancy rate;
- - if the boundary conditions and internal evolution allow the material to reach one of the conditions for the minimum, then the peak strength criterion found will correspond to the critical state Coulomb Criterion enlarged by the maximum dilatancy rate.
Mode I Transverse (−,+,−)
Combining the definition of the generalized dilatancy rate  , with the definition of deviatoric parameter c, provides the following expressions of
  :
:
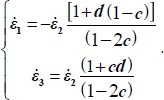
Constraints on parameters are 
- – The dissipation equation yields
 .
.
Then, by substituting σi, and  with their expressions in function of b, c, and d, the above equality, after simplification, becomes

The condition  is required to maintain the numerator and denominator with the same sign, this condition being the limit of tensile stress on σ3.
- - This ratio
 is a homography, which is a decreasing function of b and an increasing function of c.
 - - On the side
 its minimum is for
  (i.e. plane strain
  ) and b = 1 (i.e. axisymmetric stresses σ1 = σ2) taking into account this symmetry, the order between principal directions no. 1 and 2 becomes undifferentiated, and the situation is identical to axisymmetric stresses σ1 = σ2, associated with plane strain
  the corresponding minimum is
  , i.e. the critical state Failure Criterion, enlarged by the dilatancy rate.
 - - On the side
 as there is no lower bound for c, leaving it tends toward −∞, with b = 1, requiring that (above no-tension condition)
  , which means volume contraction for usual granular materials considered, a situation not relevant with the Failure Criterion with dilatancy.
In conclusion, the least shear strength criterion under this Mode I Transverse with dilatancy is the critical state one, enlarged by the dilatancy rate (QED).
Mode II Direct (+,+,−)
Combining the definition of the generalized dilatancy rate:  with the definition of parameter c, provides the following expressions of
  :
:
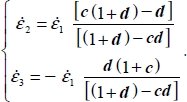
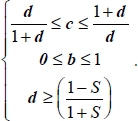
- – The constraints on parameters for this mode are
- – The dissipation equation yields:
 .
.
Then, by substituting σi, and  with their expressions in function of b, c, and d, the above equality after simplification becomes:

This is a homographic function of each parameter b, c, and d, whose numerator and denominator are always > 0, provided that  , this last inequality corresponding to the limit of the tensile stress condition (i.e.
  becomes ∞). It is an increasing function relative to c and d, and decreasing relative to (1 − b); given the above constraints on the parameters b, c, and d, it has a minimum for b = 1 (axisymmetric stresses) or
  (plane strain
  ), that minimum being
  , which constitutes the least shear strength criterion under this Mode II Direct with dilatancy, this Failure Criterion being the critical state one, enlarged by the dilatancy rate (QED).
The above expression transforms into

This is the generalized stress–dilatancy relationship for this Mode II Direct (QED)
- – The energy dissipation rate is given by
 . Given the expression of
  , we have
  and relative to the plane strain reference solution Tr{π0}, we have
  , which is always
  , the equality being only for
  (plane strain
  ), so in this case,
  .
. - – The result is similar to Mode I Direct, except that here axisymmetric stresses b = 1 are not part of the minimum for dissipation, although this situation is part of the least shear strength criterion, as we have
 .
.
Mode II Transverse (+,−,+)
Combining the definition of the generalized dilatancy rate:  , with the definition of parameter c, gives expressions of

Constraints on parameters for this mode are: 
- – Dissipation equation yields:
 .
.
By substituting σi, and  with their expressions in function of b, c, and d, the above becomes after simplification:
  . This relation is again a homographic function of each parameter b, c, and d, whose numerator and denominator are always >0, provided that
  , this inequality corresponding to the limit of tensile stress conditions. This homography is an increasing function relative to b and c. Given the constraints on c, two minima are to be considered:
- - The first possible minimum with
 is for c = –d (i.e. plane strain
  ) and b = 0 (i.e. axisymmetric stresses σ2 = σ3), taking into account this symmetry, the order between principal directions nos 2 and 3 becomes undifferentiated, and the situation is identical to axisymmetric stresses σ2 = σ3, associated with plane strain
  = 0.
= 0. - - The second possible minimum would be for c = 1 + d; however, this would mean plane strain with
 , and the internal work rate would become negative, which is excluded (dissipation condition).
In conclusion, the least shear strength criterion under this Mode II Transverse with dilatancy is the critical state one, enlarged by the dilatancy rate (QED).
- – The energy dissipation rate is given by
 . As
. As  may be expressed as a function of
  , then
  and relative to the plane strain reference solution Tr{π0}, we have
  .
.
We observe that:
- – For c ≤ −d, then
 , and as by convention
  except when σ2 = σ3 (i.e. b = 0), thus
  ; the equality being verified only for c = −d (i.e. plane strain
  ) and axisymmetric stresses σ2 = σ3 (i.e. b = 0). In this situation, the ranking between principal directions 2 and 3 becomes undifferentiated, and the situation is then confounded with
  and σ2 = σ3, as for the above least shear strength criterion, and then
  .
. - – For c > 1 + d, then
 , and as by convention
  except when σ2 = σ3 (i.e. b = 0), thus
  , which cannot be a minimal solution (twice the previous one).
In conclusion, under this strain Mode II Transverse, only one particular solution realizes a relative minimum of energy dissipation rate, which is confounded with the axisymmetric stresses σ2 = σ3, associated with plane strain  ; this provides the same result as the least shear strength criterion (QED).
A.5.3. Characteristic state
To find this limit, we analyze the algebraic configuration of the dissipation equation for the six strain modes allowed, through a procedure similar to Appendix A.5.1.
Mode I Direct 
The dissipation equation yields:  .
.
Substituting σ3 to σ2, as σ2 ≥ σ3, the above equation becomes  , and as
  , this inequality becomes
  .
.
Similarly, substituting σ2 to σ3, as σ2 ≥ σ3, the above relation becomes  , then
  .
.
- – Thus:
 .
.
- - For volume contraction
 , the necessary condition is
  and the sufficient condition is
  .
. - - For dilatancy
 , the necessary condition is
  and the sufficient condition is
  .
.
- - For volume contraction
Mode I Transverse 
The dissipation equation yields:  .
.
So, according to the substitutions between σ1 and σ3,  .
.
Mode I Reverse 
The dissipation equation yields:  .
.
So, according to the substitutions between σ1 and σ2,  .
.
Similar conditions can be drawn for Mode II, particularizing here the negative strain rate. All the resulting inequalities may be gathered in the recapitulative table (Table A.1).
Table A.1. The six strain mode features, regarding volume changes transition
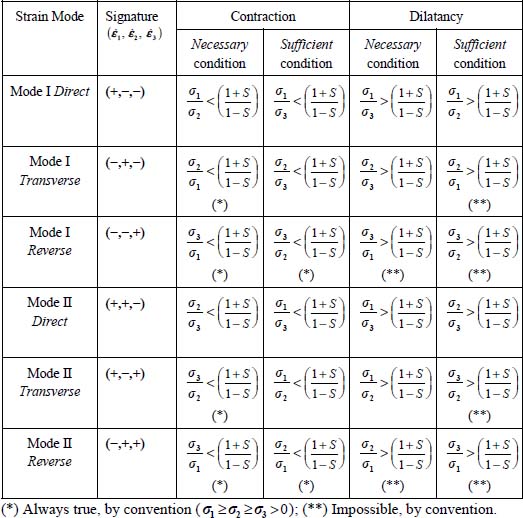
Note that if  , as σ1 ≥ σ2 ≥ σ3 > 0, then we obtain
  .
.
- – So, with this remark, we observe in the above table that if
 , then:
- - All the necessary and the sufficient conditions for contraction are satisfied.
- - None of the necessary and sufficient conditions for dilatancy can be satisfied.
Thus, in all strain modes, there will be volume contraction provided that  . On the other side of this limit, when
  dilatancy is impossible in Modes I and II Reverse, and with restrictions in Modes I and II Transverse (QED).
A.6. Appendix to Chapter 6 – experimental validations
A.6.1. Internal friction angle at peak shear resistance in triaxial test
The “internal friction angle,” the quantity widely used in Soil Mechanics practice, is defined at peak shear resistance by  . Reworking this definition with the stress–dilatancy equation [5.4], we have at peak shear resistance
  , this relation allows us either to compute Φ in the function of the maximum dilatancy rate
  and apparent inter-granular friction
  , or to adjust a value for
  on the basis of a set of experimental data
  , as shown in Figure 6.1(c).
A.6.2. Particular dilatancy diagram for cyclic triaxial data
With the specific coordinates provided by relation [6.1], we have
 , and as the stress–dilatancy relations provided in Table 5.3 is written as:
  in Direct motion and
  for Reverse motion, it becomes with specific coordinates:
 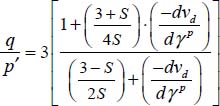 for Direct motion and
  for Reverse motion. Note that in the specific dilatancy diagram, the corresponding theoretical curves are hyperbolic arcs, crossing at point {–1, –3/2} in Figure 6.3.
A.6.3. Particular dilatancy diagrams for simple shear data
For Direct movement in plane strain  , the dissipation relation
  is written
  with specific notations given in the main text (relation [6.2]).
This transforms into a specific form of stress–dilatancy relation:  .
.
Observe that with these coordinates, the theoretical curve becomes a hyperbolic arc passing at points {1, −1} and {−1, 1} in the specific dilatancy diagram shown in Figure 6.4.
For Reverse movement, the dissipation relation  is written as
  and the corresponding specific stress–dilatancy relation becomes
  . The theoretical curve is another hyperbolic arc passing at points {1, −1} and {−1, 1} in the specific dilatancy diagram.
A.6.4. Detailed interpretation of 3D apparatus large amplitude cyclic test data (main text section 6.3 and Figure 6.5)
In the following, details of calculations leading to the features shown in Figure 6.5 are described, these calculations are performed here with the value S ≈ 0.485 or  adjusted on the energy diagram [Figure 6.5(c)]:
- – The slope of volume evolution at crossing the isotropic stress state line [Figure 6.5(d)]:
- - In the crossings under Mode I motion (at beginning of the test, and after the strain reversal no. 2, as shown in Figure 6.5), both the strain rates
 and
and  are in contraction (i.e. >0); so the volume contraction relation [6.1] sets

- - In the crossing under Mode II motion (after the strain reversal no. 1 shown in Figure 6.5), the strain rate
 is again in volume contraction, but
  is now in extension (i.e. < 0); so, the volume contraction relation [6.1] sets

- - These slopes have been drawn on the corresponding locations on the diagram of volume changes in Figure 6.5(d).
- - In the crossings under Mode I motion (at beginning of the test, and after the strain reversal no. 2, as shown in Figure 6.5), both the strain rates
- – Slopes of volume evolution at maxima of the evolving stress σz:
- - at the first maximum after the beginning, with σz ≈ 2.135MPa, using the stress–dilatancy relation:
 ;
; - - at the second maximum [just before the end of the test marked (3) on the diagram] with σz ≈ 1.850MPa, using the stress–dilatancy relation:
 :
: - - these slopes have been drawn on the corresponding locations on the diagram of volume changes in Figure 6.5(d).
- - at the first maximum after the beginning, with σz ≈ 2.135MPa, using the stress–dilatancy relation:
- – Slopes of volume evolution at strain reversals:
- – the reversal dilatancy relation [5.6] (and Table 5.3) sets here that
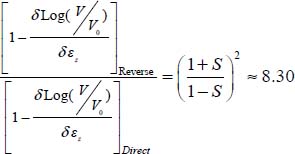 ;
; - - at strain reversal (1) under σz = 1.05 σCa(I), from motion I Direct to II Reverse, using the stress–dilatancy relation:
 ; so, after strain reversal to motion II Reverse:

- - at strain reversal (2) under σz = 0.70 σCa(II), from motion II Direct to I Reverse, using stress–dilatancy relation
 ; so, after strain reversal (2)
  ;
; - - these slopes have been drawn on the corresponding locations on the diagram of volume changes in Figure 6.5(d).
- – the reversal dilatancy relation [5.6] (and Table 5.3) sets here that
A.6.5. Dilatancy diagram for cyclic torsional shear test data
Observe that the specific coordinates defined by relations [6.3] are very similar to the coordinates already defined for simple shear (relations [6.2]) and worked in section 6.3. In this specific dilatancy diagram, it will thus yield 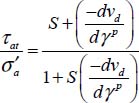 for the Direct motion and
 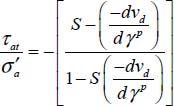 for the Reverse motion.
Observe that, in specific dilatancy diagram, the corresponding theoretical curves are hyperbolic arcs crossing here at {1,1} and {−1,−1}, as drawn in Figure 6.6.
A.7. Appendix to Chapter 7 – cyclic compaction
Here, we draw the relations for cyclic compaction under alternate simple shear motion in plane strain:
- – From the above specific form of stress–dilatancy relation in Direct motion (Appendix A.6.3), with a small direct shear motion
 , we get
  .
. - – From the above specific form of stress–dilatancy relation in Reverse motion (Appendix A.6.3), with a small reverse shear motion δ'γ, we get
 .
. - – Cumulated volume change is

and as  , we get for the cycle
  which transforms into:
 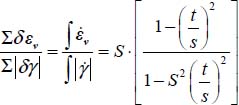 or conversely:
  .
.
These formulas allow building the diagrams in Figure 7.3.
A.8. Appendix to Chapter 8 – geostatic equilibrium: the K0 effect
Here, we describe the composite local micromechanical motions resulting into the bulk mono-dimensional settlement, associated with the geostatic stress-building in the development of geostatic equilibrium, and the elements sustaining the comparison with the Jaky formula.
A.8.1. Normal geostatic equilibrium (earth pressure at rest) internal movements
The global internal actions tensor π, which is uniaxial of vertical axis, is decomposed into two components of the same axis, but with opposite signatures:  , which allows for a null resultant in principal directions 2 and 3, those components being in Mode I Direct (+,−,−) and Mode II Reverse (−,+,+):
- – The reasoning on dissipation participations shows [FRO 01] that, in the total dissipation rate
 , the participations
  and
and  of each component are necessarily

with a typical value  , it gives a participation of 75% in total dissipation to the main component in Mode I Direct. Note that the higher the apparent inter-granular friction, the higher this participation of the main component in the total dissipation.
- – This distribution of total dissipation, together with the general features of dissipation in each component
 , and the symmetry of the global stress state (σ1 vertical and σ2 = σ3 horizontal), lead to the main features of these components of motion, summarized in Table A.2.
Table A.2. Main features of components of composite motion

- – These relations set, for each component of motion, the stress states corresponding to volume contraction or dilatancy, noting that
 , as summarized in Table A.3.
Table A.3. Correspondence between stress states and volume change conditions
| Stress state |  |
 |
 |
| Main component Mode I | Volume contraction | Volume contraction | Dilatancy (in horizontal directions) |
| Secondary component Mode II | Dilatancy (in vertical direction) | Volume contraction | Volume contraction |
| Total motion | Volume contraction | Volume contraction | Volume contraction |
A.8.2. Comparison with the Jaky formula
The process of equilibrium build-up under the action of gravity being associated with densification of the material is the reason why the comparison is done for dense to medium dense granular materials.
The relationship between “internal friction” Φ of the Jaky formula, measured by classical laboratory tests and our apparent inter-granular friction  is:
is:  where DMax is the maximum observed of the dilatancy rate during the test (relation valid for “triaxial” or plane strain tests, see also Appendix A.6.1). Systematic measurements have provided the following orders of magnitude, for various granular materials sheared under moderate confining stress, and for the usual range of apparent inter-granular friction (approximately from 23° to 45°):
- – for medium dense materials, DMax ≃ 1.5;
- – for dense materials, DMax ≃ 2.
These elements allow computing the data summarized in Figure 8.3.
A.9. Appendix to Chapter 9 – scale effects due to grain breakage
Here, we develop the micro-mechanical proof of the “Scale Effect Rule” detailed in Chapter 9.
A.9.1. Basic scale effect rule for simple particle sets
Before entering into a more general situation, let us first consider the particles from two sets of particles A and B issued from the same homogeneous mineral stock, with similar grain shapes, and characteristic diameters dA and dB, which satisfy the relations displayed in section 9.1.2:
- – the particles of both granular sets are issued from the same mineral stock, the statistics of their crushing strengths are assumed to be described by the same Weibull’s distribution (section 9.1.2, relations [9.2] and [9.3]);
- – submit the particles in these two sets A and B to crushing forces fA and fB;
- – in order to get the same probability of ruptures of particles within the two sets, fA and fB must be adjusted to the same proportion of the average resistance of particles in sets A and B, resulting in the following basic size effect relation regarding grain breakage for simple particles sets [FRO 09]:
A.9.2. The scale effect relation for granular materials
Here, we will again consider the Love–Weber relation for average stresses in granular media, which expresses the stresses from local contact forces and branch vectors between fixed material points inside the grains in contact (see section 1.3.2 in Chapter 1)
where f(n/p) is the contact force exerted by particle n on particle p, l(n / p) is the branch vector joining the centroids of particles in contact, from particle n toward particle p, and N is the total number of particles occupying the volume V in the sample granular material.
Let us now consider two geometrically similar granular materials A and B issued from the same homogenous mineral stock (Figure A.2) and let us analyze the relations resulting from this similarity, assumed to be a perfect one.
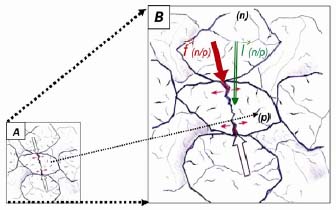
Figure A.2. Granular materials A and B in perfect similarity. For a color version of the figure, please see www.iste.co.uk/frossard/geomaterials.zip
First, these two similar granular media display similar grain shapes, the same density, and parallel grain size distributions in the classical gradation diagrams, where the abscissae are in logarithmic scale (Figure A.3).

Figure A.3. Gradations of similar materials A and B
The geometric correspondence between the two similar granular media A and B is ruled by a geometric similarity ratio DB/DA, where DA and DB are the given characteristic sizes for media A and B, respectively (e.g. maximum grain size DMax, or mean grain size D50 or any other given characteristic diameter).
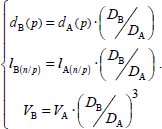
For instance, the diameters dA(p) and dB(p) for two homologous particles number p, or the branch vectors between particles n and p in contact, or the volumes VA and VB occupied by homologous representative subsets of particles in the granular media A and B are linked by
With regard to the forces and internal equilibrium in both similar materials, the following basic assumptions are recalled:
- – As the particles of both granular media are issued from the same mineral stock, the statistics of their crushing strengths are assumed to be described by the same Weibull’s distribution.
- – The friction coefficients at homologous contacts are assumed identical.
Consider now our similar granular media submitted to macroscopic stresses, close to the limit equilibrium, inducing slow motion inside both our granular media: the contact forces in our granular media in slow motion induce some grain breakage. Consider the probability of failure of homologous particles number p in our similar granular media under the effect of contact forces exerted by homologous particles n.
The relation [A9.1] shows that, in order to secure the same probability of grain breakage, the homologous contact forces should be in proportion to the crushing resistances of homologous particles  .
.
As the scaling ratio is the same for all contact forces, this relation valid locally for each contact force f(n/p) also holds globally for the complete sets of contact forces {f}
Macroscopic stresses in our similar granular materials A and B are derived from equation [A9.2]

From equations [A9.2] to [A9.4], all terms in the stress tensor formula for granular media B may now be expressed as a function of corresponding terms belonging to the similar granular media A, resulting in the following relation [FRO 09)]:
Equation [A9.5] sets the relationship between the macroscopic stress state tensors to be applied to granular media A and B in order to obtain the same probability of grain breakage during mechanical loading, and thus statistically the same amount of grain breakage during motion (QED).
A.10. Appendix to Chapter 10 – applications of scale effects to design and construction
Here, we treat the simplified three-dimensional analysis of the kinematics of settlements in dam body at impounding, leading to the equation [10.8].
The valley is schematized by a trapezoidal vertical section, with a width of L0 at its base, and with a vertical dammed section at dam height H, of Sv. As  , observe that the horizontal width of this valley L(h), may be expressed at any level by
  , and that
  .
.
Under the impounding water pressure over the upstream impervious face, the dam body will settle perpendicularly to its facing [Figure A.4(a)] and the magnitude of this settlement in the central section along the valley is (neglecting the deformations of the foundation compared to dam body settlements):
- – normally to the facing
 , where ERI is the bulk rigidity modulus corresponding to the impounding settlements;
 - – vertically under the facing
 ;
; - – the maximal value is reached at mid-height and is
 .
.
Under the effect of a vertical component δv(h) of these settlements:
- – the dam body will move down in its valley, and because of the converging abutments, the decrease in available width will be:
 .
. - – then at mid-height, the resulting horizontal compressive strain under the facing will be:
 .
. - – thus, at mid-height,
 .
.
This modulus at impounding ERI can be related to the apparent rigidity modulus at the end of the construction ERC (the only rigidity modulus known before impounding) by using the statistical correlations developed in [HUN 03], which also displays some dependence on valley shape (arching effects, etc.). With some safety margin, it leads to select a value ERI ≃ 2.7ERC. Replacing in the above expression of  , this leads directly to the relation [10.8] (QED).
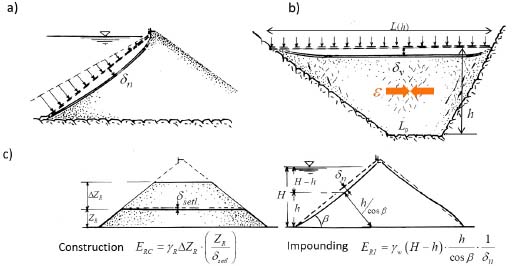
Figure A.4. Simplified three-dimensional analysis of settlements in dam body at impounding. (a) Dam section. (b) Vertical cross-valley section. (c) Simplified methods for rockfill moduli determination (reworked after Hunter et al. [HUN 03]). For a color version of the figure, please see www.iste.co.uk/frossard/geomaterials.zip
A.11. Appendix to Chapter 11 – concluding remarks
Here, we handle the question of substitution of another p-norm to octahedral norm N for numerical applications of dissipation equation.
The mathematical difficulties mentioned in Chapter 11 are linked to the lack of continuity of derivatives of this octahedral norm N; this lack of continuity also manifests in the geometry of its unit ball: an octahedron with sharp edges and sharp vertices.
Therefore, if, instead of the tensor octahedral norm N,  , we consider the following tensor norm
  with 0 < α ≪ 1:
- – this tensor norm Nα' belonging to the same family of p-norms is now with continuous derivatives to the nth order, and its unit ball becomes a smoothed octahedron with smooth edges and vertices;
- – with a value of α sufficiently small, this tensor norm Nα' is as close as required to the original octahedral tensor norm N (as N = N0').


