
CO-CREATE UPWARD: THE SPIRAL OF GROWTH
The right metrics, at the right time, with insights in the hands of the right action-oriented individual—these are critical enablers of strategic, profitable growth in the Co-Create economy. And the best way to gain access to the right metrics is with a real-time dashboard that tracks key performance drivers, or KPDs. Please pause and read that again, because this is the mission-critical message of this chapter. If you take nothing else from your reading, please remember this: in the Co-Create economy, your growth depends on getting the right customized, forward-looking KPDs in the right hands, up, down, and across your organization.
These performance drivers can’t be the same old reports from last week, last month, or last quarter; those are key performance indicators (KPIs) and many are lagging indicators—results of your past performance. For organizations in the Co-Create economy, the far more important set is comprised of leading drivers—of customer intention toward buying products and services. You can track harbingers of anticipated growth by paying attention to the following metrics, all of which we will examine in detail in this chapter.
• Sentiment—How do customers feel about their experience with our brand in all stages of their buying decision?
• Reputation—How are we perceived in customers’ hearts and minds?
• Engagement—When, where, and how do customers prefer to be engaged by us and our brand?
• Buying-Cycle Alignment—How can we increase our efficiency and effectiveness at meeting buyers along every stage of their Customer Experience Journey?
• High Performers and High Potentials—Who in our organization consistently behaves above and beyond expectations when it comes to engaging and influencing the thinking and motivation of our customers? Similarly, which individuals show a stronger level of commitment, work ethic, and eagerness to learn and grow with our brand?
In my view these are the most important performance drivers you can have. Now, how will you get them into the hands of the right action-oriented individuals at the right times? That’s where evolutionary dashboards come in.
The concept of dashboards has been around since data warehousing began in the late 1990s. These data visualization tools allow users to drill down into complex information and improve decision-making. The main appeal of dashboards is the visual interface that makes them so easy to use. (Think of the experience of being behind the wheel of your car.) One of the simplest dashboards is your business’s weekly LinkedIn page update, which shows how many people you’ve engaged, likes you’ve accumulated, shares of your posts, campaigns you’ve announced, etc.
But evolutionary dashboards take that idea further by being available on all mobile devices, with data as close to real time as possible, reflecting leading drivers, and customized for specific roles in the organization.
Nourcabuary
Dashboards are visual information displays that keep relevant key performance drivers (KPDs) readily in view. Distinct from most current dashboards are those I call evolutionary dashboards, which are specifically engineered to drive adaptive innovation. These must be based on data as close to real time as possible, feature leading drivers, and be tailored to specific roles, such as sales, talent management, or production.
In the Co-Create economy, Co-Creation of value extends to the KPD dashboard, which is customizable based on individual functions, creating maximum engagement by demonstrating individual impact on shared objectives. Going from micro to macro (as shown in figure 6.1), our need for information is driven by our roles:
• Individual contributors—How are my efforts making a difference in the larger vision for the organization?
• Managers—Do I have my finger on the pulse of what’s happening at the edge of our business where current and prospective customers live; where skills, knowledge, and changes in our behavior can have a real-time impact?
• Group or business-unit leaders—Are we agile enough to anticipate changing market demands, so that we can make appropriate course corrections and always offer a competitive value proposition in the eyes of our stakeholders?
• Executives—Is our strategy and vision for the next eighteen to thirty-six months—which is the Co-Create economy’s strategic horizon, a departure from the traditional five- and ten-year plans—sufficiently adaptable? Does it have the right balance of brand equity and human capital assets and culture to meet those shifting market demands?
• Fiduciary stewards—Are we asking the right questions of senior leadership to mitigate risk, sufficiently understand disruptive technologies and business models, and anticipate appropriate shifts in market direction with our current governance model?
Figure 6.1: Roles and KPD Dashboards
Sample Klipfolio Digital Marketing Campaign Performance dashboard. Note how data starts top left with today and presents a nutshell graphic view of spend, conversion, and other metrics. Online, a hover permits click-through to ever more granular and historical layers of data.
Each role is assigned its own KPDs, displayed to individuals on a dashboard matched to their specific roles, so each can clearly see his or her impact on outcomes and, thus, align individual and team efforts to achieve those outcomes.
An upward spiral of growth in the Co-Create economy depends on whether your organization is: 1) registering as an authentic object of interest to its most highly valued customer segments; 2) helping prospective customers and clients with their decision-making process; and 3) fueling their urge to tell their friends and business networks about their experiences. Customer evangelism, as we learned, can dramatically reduce customer-acquisition costs, freeing up resources to aim for delivering exceptional customer experiences and further creating greater Market Gravity. Evolutionary dashboards can help every function in the organization operate more effectively. Data from these evolutionary dashboards can also be used to increase an organization’s speed-to-market factor by anticipating new customer needs, allowing the organization to strategically drip new iterations, if not innovations, into the market.
By now you are probably getting curious: Where do these dashboards come from? Aren’t these “soft” drivers extremely hard to measure? How do I pin “sentiment” to a point on a scale? I will address these concerns. But first, let us explore the terrain.
Throughout this chapter, keep in mind the Customer Experience Journey discussed in chapter 4, because we build here on key insights about that journey. I will show you how the right dashboards can keep every function in an enterprise attuned to customers’ evolving, and ever-rising, expectations and needs, especially those not yet sensed. This enables adaptive innovation, which leads to increased customer retention, which can be the basis for either transformative growth to scale or for a smaller, more strategic base of deep relationships (the “Jerry Maguire” business model). That is the promise of evolutionary performance dashboards.
Let’s begin by getting my deepest concerns out on the table: the fundamental ways organizations undermine their efforts. Without solving these challenges, no dashboard can show you the way forward.
Figure 6.2: Framing

CHALLENGE: FLAWS IN FRAMING
To understand and drive the evolution of your growth, you must frame the right challenge. Not based on gut feel or intuition. Not because you’ve been in the industry for thirty-five years. Rather, your framework for data-driven decision-making must be based on a clear understanding of the outcomes you are trying to achieve and the problems that stand in your way.
Consider the following exercise, which I often use with the teams I work with.
I tell them, “You are hiking in the North Georgia Mountains when you come across a cabin. There are several dead people inside. Your job is to figure out how these people died. I will answer any yes or no question you ask me.”
Ten out of ten times, the audience begins to ask very logical questions. “Can you smell any fumes?” “Is there any sign of animal attack?” “Is there blood?” “Do you see any kind of weapons?” They start to discern what exactly happened in this cabin.
A few minutes go by in this question-and-answer activity. Then, I typically ask one of the participants, “Can you see in your mind’s eye what this cabin looks like?” Let’s say I call on Bob. Bob says “yes,” and I ask Bob to come up to the front of the room and sketch an image of the cabin. Bob begins to draw a structure—four walls, windows, a door. Maybe he includes some damage, or a fire. In a few moments he has produced some iteration of a physical log cabin structure.
I gain consensus by asking, “Does everybody believe this is a representation of the cabin?” I’m not asking for world-class art here, or forensic evidence. But structurally, does this audience believe this is what the cabin would look like?
And then I flip the page, and I draw the outline of an airplane. Because what they came across was in fact an airplane cabin that had crashed. Yet when I say “cabin,” unconscious bias leads that audience to envision a cottage in the woods.
My point is that if you frame a challenge or opportunity based on assumptions, it may be flawed. You can waste time and resources going down the wrong path because of a faulty definition. To this day I am amazed at how many leaders, teams, and organizations are thinking about “the wrong cabin.” That’s why forward-looking, collaborative decision-making based on verifiable data is so important.
Starting from the wrong frame is one challenge to an upward spiral of revenue growth. The other is lack of analysis.
CHALLENGE: NO ANALYSIS OF PAST PERFORMANCE
I would estimate that more than 80 percent of my clients don’t do any kind of win/loss analysis on their new-business efforts. They don’t understand what wins them business, and, more alarmingly, they don’t understand why they’re losing business. If you ask the sales rep, the reply is typically something like, “Well, that buyer had a brother-in-law who works for one of our competitors.” If you ask the customer the same question, you hear, “They really didn’t understand where we are trying to go.” Bad information leads to flawed assumptions and, thus, framing the wrong challenge.
If you don’t understand the key drivers of your growth, the speed of that upward spiral, the cost of that growth, the elasticity of that demand, you’ll never know which levers are under your control and which are not.
You may think you have a great idea that’s working very well, until suddenly it’s not. Rent the Runway (RTR) is a clothing and accessories rental site founded by two Harvard Business School grads in 2009. By the end of 2015, it had raised more than $120 million in venture capital and was valued around the half-billion-dollar mark. It has over 110,000 Instagram followers and 380,000 Facebook “likes”—who could resist a selfie in that stunning Badgley Mischka? Nevertheless, Fortune magazine reported in 2015 that RTR had yet to make a profit and had lost seven top executives in the span of ten months, perhaps due to what former staffers told the magazine was the company’s early days of cliquishness and Mean Girls corporate culture.
Scroll down through the Facebook comments, too, and you see just how steep their spiral was—and just how poorly they had initially anticipated how to scale their concept. “When we launched,” CEO Jennifer Hyman told Fortune, “we got such great PR that it looked like an immediate boost, but it didn’t sustain itself. It was a false positive.”1 Expanding their special events rentals to include an accessories offering was a failure. Those initial skyrocketing sales also revealed some weak areas in their execution and business plan, like getting the right sizes to customers and even having basic stock available either online or in their showrooms to offer some kind of consistent choice. “I think the hardest thing is that you’re continuously doing a job you don’t know how to do,” Hyman revealed to Cosmopolitan. “Nothing can prepare you to learn how to be a leader while your business is growing so quickly.… I try to be humble and learn from my mistakes.”2
As my teenage daughter has been known to say, when a girl needs a dress, a girl needs a dress, but the bashing that the company is still taking on social media all these years later is a testament to the importance of consistency over quantity in customer satisfaction. As a hypothetical, imagine that a company informs you—in mid-May—that those ten bridesmaids’ dresses you reserved in January for your June wedding won’t be available. Well, the internet has lots of places built on spreading that bit of unhappiness far and wide.
Since her first successful meeting with Diane von Furstenberg back in 2008, however, Jennifer Hyman has had a key contingent of backers in the fashion industry who see RTR as an ideal venue to connect their older brand to a younger demographic. And despite the problems with customer experience, RTR’s recent addition of a subscription model for business and everyday wear has apparently been successful—so far. Hyman is counting on radical changes in leadership and attention to leading drivers to remedy that shortfall. “The first core value we have is that everyone deserves a Cinderella experience,” she told Fortune. “And I looked around at the team that I had, and thought that we needed a very different team to scale us.”3
What that new team discovered when they started listening louder was that the future of RTR wasn’t so much in renting prom dresses but in giving women greater access to that Cinderella feeling every day. “How life-changing would it be to have access to hundreds of thousands of designer pieces and be able to have a new outfit every single day?” Hyman asked Cosmo. “It’s a vision we were not able to launch until we built our company and nurtured our relationships with designers. To convince women that they should have a rotating closet of unlimited options that they can wear to work, on the weekend, and at parties is a much bigger, much bolder idea.”4
Rent the Runway, by only monitoring social media rather than performing more rigorous analytics, missed early faint signals of coming missteps. In the first years when Hyman’s vision was so narrowly focused on growing their initial business model, the company lost sight of improving metrics key to any service business: have what you offer in stock and in excellent shape (materials stretch, buttons go missing, a minor stain goes unnoticed), ship the correct product on time and to the right place, and make the customer whole when things go awry. The moment RTR began to address issues like these was also the moment a new management team was brought in and a new business model was launched that responded more effectively to customers’ needs. Paying closer attention to early wins instead of losses could have allowed for more agile responses as strategies revealed weaknesses.
These two challenges—framing the wrong problem and failing to analyze past performance to drive future decisions—far too frequently undermine organizations’ growth goals by depriving them of an actionable view of the road ahead. This is where leading drivers come in.
LEADING DRIVERS VS. LAGGING INDICATORS
How can we start looking ahead as far as possible to give us the time we need to make course corrections? Begin by focusing your radar on leading drivers rather than lagging indicators. In boardrooms across the globe, leaders meet and discuss reports that are obsolete before they hit the table, because they draw on lagging indicators, everything that is past. KPIs related to financial performance, like profit, revenue, and costs, are results of past activities of the team and the company. They are all lagging indicators. Likewise, an improved customer satisfaction measure (such as an NPS score) shows the result of initiatives taken in the past, not how well you are satisfying customers today.
Unless you’re the Fed chairman, the economy isn’t within your control. But access to economic drivers is. How and where we choose to invest, how we behave based on that information—all of this contributes greatly to organizational growth, or lack thereof. In the Co-Create future, not just acquiring but agilely manipulating data will make a fundamental difference. Movies like Moneyball (2011) and The Big Short (2015)—based on Michael Lewis’s caustically hilarious examinations of, respectively, professional baseball and the recent housing bubble—have shown us how data analytics can separate winners from losers. Those who can draw actionable, real-time insights from the data gain a dramatic advantage over those who cannot. That’s why, in the Co-Create economy, we need more roles like Insight Architects who can structure massive data collection, warehousing, reporting, and analysis so it becomes a real-time, insights-driven environment.
Of course, reviewing where you’ve been is essential—as exemplified by the win/loss analysis just discussed. But in the Co-Create economy, leading drivers of growth are the signposts we use to navigate. Leading drivers highlight the activities that are valid predictors of increased revenues and profits.
It’s easy to measure lagging indicators, but it is very hard to improve upon them, or even influence them. Leading drivers, on the other hand, are often difficult to measure, but easy to influence. I think we can all relate to the experience of trying to lose a little weight. Stepping on the scale is a very clear lagging indicator that’s easy to measure. You can’t do anything now about what you ate in the last few months that led to the numbers on that scale. The way you are going to reach a diet goal is through the leading drivers of calorie intake, burn, and consistent exercise regimen. That’s where data collection comes in, hence the popularity of wearable fitness devices, which ultimately make it easier to both measure and influence the leading drivers and make decisions accordingly. As in, put down the bacon burger, and run that extra mile.
Frankly, too many managers—and even senior executives—find it hard to believe that leading drivers can directly and immediately impact their business. They can. Leading drivers are measurable, they occur before you set your strategy, and they will highlight a particular pattern or trend, allowing you with a high degree of accuracy, and thus confidence, to predict the future and adjust your efforts and resources. (I am referring to personal, team, and entire organizational growth.)
There are general leading economic drivers that typically change before the economy as a whole changes. The Conference Board publishes its Leading Economic Index (LEI) that signals peaks and troughs in the business cycle for major economies, including the United States. The Organization for Economic Co-operation and Development produces the Composite Leading Indicators (CLIs) designed to provide early signals of turning points in business cycles with a focus on qualitative rather than quantitative information about short-term economic movements. If you listen to the business news, you are constantly hearing talk of such drivers, such as new business starts, building permits in the housing market, employment outlook, and stock market dynamic forecasts.
These are valid and highly respected, but in my relationship-centric view, you also need to identify specific leading drivers for your own business that measure the depth, breadth, and potential of your relationships with customers, talent, partners, investors, and other key stakeholders.
Figure 6.3: Leading vs. Lagging
The Canyon and the Curve Ahead
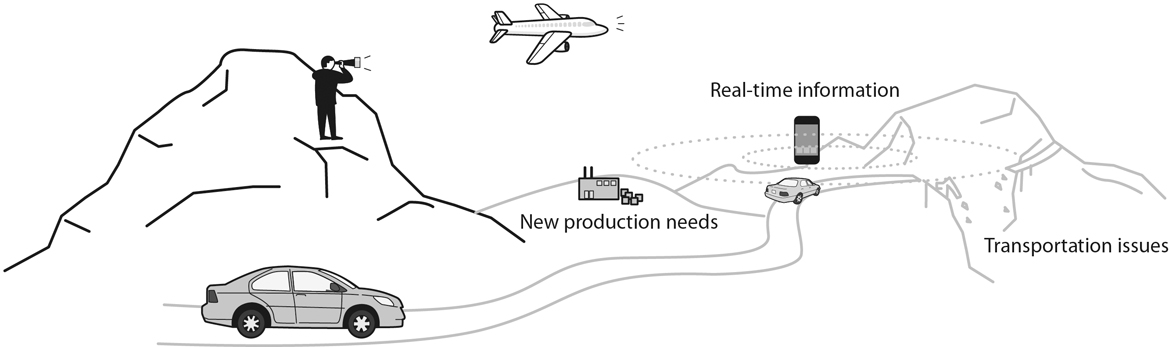
When we learn to drive, we are taught early on to look as far ahead as possible, because it gives us more time to make necessary course corrections. As a motorcycle rider, I know that the sooner I understand the curve dynamics, see the potholes or other potential risks on the road, and observe the hills ahead, the more smoothly I can find reference points for my entry, apex, and exit points and thus the safer my ride will be. And yet, from a single point of view, only so much of the road ahead is within my view.
This is where Co-Creation reveals one of its strengths. Imagine you are in a car, driving through a mountain range. One of your partners, or perhaps a customer, is sitting on top of a mountain with binoculars, looking down at that stretch of winding road. They may not see the potholes, but they certainly see what’s around the corner better than you can. Now, imagine you have a partner who’s flying above and can see the entire landscape, and an employee of yours in a car who just traveled this route an hour ago. Now, imagine you all have Waze, the Co-Creation traffic and navigation app on which drivers share real-time traffic and road information. Through Co-Creation, you can monitor leading factors that affect your experience of the journey and your ability to reach your destination safely and without potential delays. An improved experience often leads to profitable growth.
Leading drivers are crucial to understanding what is ahead. Co-Creation makes available certain leading drivers you wouldn’t be able to monitor on your own.
Leading drivers must be outcome oriented. When an organization like ThyssenKrupp Elevator tries to improve its compliance with service level agreements (SLAs), the outcome that matters is the resolution of service issues within committed timeframes and expenses. Therefore, key leading drivers that could be shown on a dashboard might include the number of incidents reported, the percentage of open incidents older than two hours, the percentage older than one day, and the average backlog of incidents per agent. By monitoring these outcome-based key performance drivers (KPDs) every day, managers can work on identifying problem areas, improving them, and thus improving SLA compliance.
Will this require a culture shift? In some cases, certainly. But the payoff is a greater degree of confidence in the decisions made and more lead time to craft those decisions. Leading drivers are not one size fits all; what outcomes are worth monitoring on a dashboard will vary by function and by role.
To summarize: leading drivers are critical to organizations’ upward spiral of growth because they give decision-makers longer runways—more time with more real-time insights—in which to make strategic choices. Of course, some are skeptical that leading drivers can ever be reliably identified and monitored, but I refute that view. General economic drivers are available, and it is possible to identify specific leading drivers in your own enterprise, as we’ll see. The goal should be deployment of evolutionary performance dashboards displaying leading drivers in real time, customized to the needs of individuals and teams in a variety of roles.
EXTERNAL AND INTERNAL LEADING DRIVERS
Earlier in this chapter I listed the leading drivers I find most valuable: sentiment, reputation, and engagement. These are leading drivers of stakeholders’ experiences external to an organization, but they also impact its performance. We will consider these first, then move on to two that are internal-facing leading drivers—those concerning buying-cycle alignment and human-capital development.
SENTIMENT
Can an organization measure how people feel about it? Yes. By listening louder, as I discussed in chapter 2, an organization can produce a meaningful metric comprised of the polarity of sentiment (positive, neutral, or negative) and the degree of fervor with which that sentiment is felt. Sentiment analysis is most easily applied to social media channels, where blogs, review sites, discussion groups, etc., collect the views expressed by “ordinary people,” creating actionable data.
Sentiment analysis makes it possible to capture nuances that are too often lost in more traditional customer satisfaction surveys or NPS® scores. I recently flew from Atlanta to San Francisco. Gates? Might as well be a cattle call. The inflight Wi-Fi (that I pay $500 a year to access) was not available on that five-hour flight. The fourteen announcements over my headphones were often repetitive and way too loud. Yet Delta keeps sending me stale customer satisfaction surveys that ask, “How were the flight attendants?” They were fine! It was the rest of the experience that had me gritting my teeth. Delta is surveying me about the wrong thing! It’s the “wrong type of cabin”—flaws in framing—all over again.
In digital conversations, consumers focus on whatever feature of the product, service, idea, or experience is bugging (or thrilling) them at that very moment. In late 2015 in the United Kingdom, Barclays Bank launched Pingit, a mobile payment service available as an app, which created lots of initial social media buzz because it made sending money to someone as easy as knowing their phone number. Using data analytics from Our Social Times to decode every post, tweet, share, like, chat, and text, they realized they had miscalculated how useful the app would be to one group of users—parents wanting to transfer funds to their minor children. They quickly added this functionality so that even younger kids with Barclays accounts could benefit, and thus captured the good feelings of a group of customers who would have been otherwise dissatisfied.5
Sentiment analysis can tease apart distinctions in natural language. Cognitive computing (which I speak about in the next chapter) will accelerate that capacity. This opens up the possibility of a more finely grained understanding of consumers’ perceptions, feelings, and potential to influence others’ calls to action.
REPUTATION
As the demand for transparency increases in the Co-Create economy, the impact of reputation becomes even stronger, affecting one’s intention to buy from a company, join a company, or invest in a company. The higher the dollar amount of the investment, the more importance and priority the unmet need is given, the more reputation matters.
Particularly in purchase decisions, reputation matters a great deal (as it does in any kind of strategic relationship). When I look at Glass Ceiling.com to consider you as a potential employer, or I do my due diligence on your investment prospectus, your reputation is a critical facet of your value proposition.
In the digital world, reputation is oxygen. You cannot influence others without it. Klout developed its social media analytics platform, which ranks its users according to their perceived social influence, because of the importance of reputation. Each user is assigned a “Klout Score” with a value between 1 and 100. Individuals use Lithium Technologies’ Klout services to improve the impact of their social activity and measure the value of their earned social media reputation, while brands use the Lithium platform to reach influencers and design user experiences for maximum social engagement.6 I’m uncertain as to Klout’s accuracy (if I drink coffee every day and tweet about it, does that make me a coffee connoisseur with a respectable Klout score in coffee? On the other hand, I’ve been a student of business relationships for over two decades, write and speak extensively on the topic, and my Klout score is 65 out of a possible 100!) and thus long-term viability, but it is an interesting perspective.
ENGAGEMENT
Engagement is a critical leading driver, because it is the closest approximation we have of mindshare. If you are not getting mindshare, it is highly unlikely you’ll get wallet-share.
Online, engagement is largely about measuring interaction with content: clicks, bounce rates, time on site, downloads, page views, likes, shares, posts, reposts, tweets, comments, etc. Offline, engagement is about inviting consumers of our value into active involvement and relationship with the brand, then measuring the frequency and fervor with which those invitations are accepted.
Lithium Technologies actually goes a few steps further than just managing reputation and reaching influencers, for they help companies—large and small, tech, retail, and B2B—create authentic online communities where there are spaces for more interactions—and the growth of reputation through engagement. For Best Buy, the $45 billion electronics and tech product retailer, they built the “Best Buy Community,” where customers can communicate directly with Blue Shirts, Geek Squad Agents, community teams, and, importantly, other customers. Customers interact with like-minded others, posing questions, rating answers, awarding “kudos,” and judging the best replies as “accepted solutions.” They may not have “bought” anything and may have even come with a beef, but the result is the Best Buy Community’s opportunity to find a solution, and that solution raises the company’s reputation and creates value, deepening the relationship on all sides.
Monitoring engagement as a leading driver requires you to mine data about consumers’ interaction with your brand, online and off. A ready example of the importance of engagement as a leading driver comes from membership associations, where associations can stay relevant to those engaged members who Co-Create innovation over time. Engagement is a reliable indication that members perceive value, receive value, and experience value’s impact in their lives. Engagement leads to the belief that “I am better off because I belong to this association.”
Engagement is what you choose to invest in, volunteer for, buy, and buy into. Engagement reflects what individuals choose to prioritize. At the same time, if you, your products, your team, or your services are not among your key stakeholders’ priorities, your future relevance is in question.
Sentiment, reputation, and engagement are leading drivers of what stakeholders are thinking, what they trust and care about, what they prioritize. A finger on that pulse is essential to your innovation and marketing functions, and thus to all the operational units that support those functions. This is why external-facing leading drivers belong on an evolutionary performance dashboard.
Internal Leading Drivers: Buying-Cycle Alignment and High Performers/High Potentials
Buying-cycle alignment and high performers and high potentials are internal-facing leading drivers rather than external, because they are about what fuels your organization’s innovation engine, not just its go-to-market strategy.
Buying-Cycle Alignment: Whether they call it a sales process, a funnel, or a cycle, too many organizations monitor how they sell, not how customers buy. Your customers and other key stakeholders have their own processes, as I discussed in chapter 4. Aligning the buying cycle means increasing efficiency and effectiveness in meeting buyers where they are in their Customer Experience Journey. To recap, in a Co-Create enterprise we see purchasing (or any kind of uptake—of ideas, credibility, repute, or even something more transactional such as employment) as the medium in which transformative relationships take place. When we become so aligned that we perceive and fulfill the unmet need of another anywhere on the cycle, the recipient of the value often becomes an evangelist and goes on to influence others. This is how customer retention drives the upward spiral of growth.
One way of measuring buying-cycle alignment is by monitoring customer on- and off-ramps, where customers step into or out of some kind of interaction with us, at which point we should ask: What unmet need might we fill, what conversation might we elicit, what demonstration might we make to engage this customer in Co-Creation? Sometimes a solution is very simple: think McDonald’s and all-day breakfast. If I can’t get an Egg McMuffin at 10:00 p.m., I’m not going to McDonald’s. That negative association may still linger the next time I want a fast-food meal, rendering me less likely to patronize the restaurant. Listening to years of customer requests (and complaints), the company did an about-face. After the spring launch of all-day breakfast in 2015, the earnings-challenged chain reported a 5 percent rise in sales by early 2016.7
High Performers and High Potentials: If you don’t have rising talent stars within your organization, it doesn’t much matter how well you are performing with external stakeholders. High performers and high potentials are leading driver metrics of your organization’s ability to meet and exceed customer expectations going forward. You must identify those in your organization who consistently exceed even the highest expectations when it comes to engaging and influencing the thinking and calls to action of your customers. Similarly, which individuals show a stronger level of commitment and eagerness to learn and grow with your brand, and have a work ethic to match? In those functions most susceptible to employee turnover, are you adequately protected by the quality of high performers and high potentials on those teams?
One easy way to apply this metric is to look at the front and back doors. Applicants across all levels should come from a solid educational foundation where they were challenged with critical thinking (a badly missing developmental asset from many of our academic institutions), have experience at high-value competitors, and, if recruited, ideally have some experience of and history with your company through on-campus contacts and internships. In other words, you shouldn’t be the first one to recognize their intellect and ambition. Who’s applying for equivalent positions at your competitors? Examining who is moving on—and why—is also informative. Some birds are ready to leave the nest because they love challenging roles and are always learning—and your company may no longer provide that for them. Others might be stuck, complacent, or unwilling to take on new workplace challenges—or they might not be a good fit in terms of culture.
For that new hire, what your organization and that individual Co-Create is a job with all its various implied relationships; for the company, it’s all the value that the individual’s knowledge, experience, and personal passion brings to his or her role every single day.
While sentiment, reputation, and engagement analysis is becoming more widely used, you are unlikely to find buying-cycle alignment or high performer/high potential talent appearing on any list of leading drivers. But if you accept my premise that a company lives or dies by its strategic relationships, the importance of these leading drivers should be abundantly clear. The challenge is to collect, analyze, and display that information in simple visualizations on dashboards adapted to the needs of individuals and teams across functional areas.
EXISTING, IMPENDING, AND CREATED NEEDS
Remember that the ultimate goal of KPD metrics is to fuel your upward spiral of growth. I expect you to use these KPDs to anticipate emerging needs among existing customers (and therefore new prospects like them) and respond with frequent innovations that keep you an object of interest.
There is a range to your target market’s types of need, and the premium to you increases the higher you ascend that scale. At the lower end are the customers’ existing needs—whatever it is they know they need, whatever value they are actively looking for. If it’s 8:00 a.m. and you’re a coffee-drinker, caffeine is an existing need. Impending needs are those your potential customers have thought of but are not urgently seeking. At 8:00 p.m., tomorrow’s cup of coffee is only an impending need. Created needs are those your market has never even imagined. If it’s 8:00 a.m. and I invite you to an invigorating group cycling class, you might discover that you focus better and get more done thanks to the neurological effects of the competitive group cycling. Aha! I’ve created a need for you. Tomorrow, you’ll call me and ask when are we going to the next class. Created needs come from strokes of insight that take ideas to a whole new level.
At the “existing” end of this scale, offerings are not unique. If a need is impending, however, there are fewer solutions offered. Thus, value increases. If you can create the need, you become a priority, an object of interest. Your target market becomes incredibly receptive to your value and loyal to you as its provider. The uniqueness of the group cycling class compels you to inquire about the very next opportunity. You begin to explore other forms of unique and challenging cycling experiences. You purchase a road bicycle and get involved with a local cycling club to train for an upcoming road race. You subscribe to cycling magazines and even attend a consumer show all about cycling for more education and opportunities to enhance your overall experience with cycling. Now I’m your go-to cycling guy.
The Co-Create economy demands a much deeper knowledge of your customers’ experiences. Day by day, what are they struggling with? What do they need? If there is no need, you have a solution looking for a problem. If there is a need, but many other people can fill it just as well as you can, you have a commodity. Ultimately, the relationships that generate sustained results for both sides are the ones that are grounded in Co-Creation of new value. They arise from your ability to understand others’ needs and demonstrate how you uniquely can address them.
This is where adaptive innovation (chapter 2) thrives, at the edge of business where the voices of the recipients of your value can be heard the loudest.
When a customer contacts you with an RFP for the solution you sell, that’s an existing need. You may be proud of the reputation that made them seek you out. But don’t be too pleased—you weren’t invited into Co-Creation of the value they seek. You just lost an important differentiator. It doesn’t take a leading driver to detect an existing need.
Impending needs give you some advance notice, some time to prepare to accommodate them, if you have been paying attention to leading drivers. Impending needs are when the customer is in the canyon but you’re perched up high and can see around the curve ahead. How can you, with the known present, extrapolate the future, start anticipating what’s coming next for your customers and key stakeholders? Start having those conversations now. The impending need you bring to their attention—this sharing the advantage of future need—is a tremendous enhancer of loyalty, and an invitation to collaborative Co-Creation that may be transformative for both sides.
In a sense, filling an impending need can be an upsell, often an if/then equation. If you’ve hired me to do the software upgrade on your content management system (CMS), then this might be a great opportunity for us to offer new training/retraining. That ups your company’s efficiency and hence performance, and raises our relationship in your eyes, making any further unique suggestions I make potentially that much more attractive.
But created needs are where legends are born. When you create a need, the recipients of that value have never even thought about it. Created needs are category makers. Consider recent tablet devices. Steve Jobs famously created a fantastically successful separate product category in tablets by recognizing that we needed something that bridged the gap between smartphone and laptop. In terms of fueling your growth spiral, creating a need has proven to deliver a significant premium. When you begin to truly understand created needs, you see them everywhere. Bottled water, increasingly capable smartphones, on-demand video and audio services, YouTube, Match.com, Spotify, the cronut, same-day delivery, Amazon Prime—these are just a few examples. Look at them all and realize that they aren’t individual products; they are often categories that did not previously exist.
Looking Beyond the Buyer
Your understanding of existing, impending, and created needs is most relevant in the customer/vendor equation, but the same concept applies with employees. Creating a job for an employee instead of finding a warm body to fill a job description is one important way to exercise Co-Creation in the talent department.
Let’s say that on a campus-recruiting visit, you meet an incredibly talented individual. Your first thoughts are probably, “How can I plug this person into an existing opening?” But then you realize talent of this caliber would be bored in that position after six months. The answer is to create a job. But you do it with them. Co-Create. Focus on the outcome: “Here’s where we’re trying to take the organization. Why don’t you come spend the summer with us and let’s figure out where you’ll be most challenged.”
As a leader, I need to realize how to take you—as you come—and craft a development program that gets you working with the smartest people. Because this is what the exceptional companies, the Googles and Intels and LEGOs of the world, are doing.
Investments work the same way. Before an investor considers a company, they ask for a use-of-funds statement. Typically, investors want to put that money into acquiring more customers to spur revenue growth.
The investor and the company put their heads together, based on the experience on both sides of the table, based on market dynamics, to discuss the best use of those funds to accomplish that goal. What’s the best way to dramatically grow the customer base? Create a need.
It’s rarefied air in that space. You’re not competing with anyone else. You have elevated the perception of the impact, the outcome you create. You are no longer lost in the noise. Of course, it’s easier said than done. It requires a greater investment in the ecosystem—understanding not just the buyers’ experience journey but also the evolving industry dynamics, the company culture, the team strengths, and the individuals leading key initiatives.
The connection should now be increasingly clear between dashboards showing KPDs based on leading drivers and the process of adaptive innovation I described in chapter 2. All that listening louder, identifying faint signals, validating critical assumptions, and iterating pilots and prototypes is designed, as you’ll recall, to keep the pace of innovation matched to, or even a step ahead of, the pace at which customers themselves evolve.
The fuel propelling your upward spiral of growth is essentially this: access to real-time, relevant leading drivers that help you identify or, better yet, create future needs that you then fill better than anyone else. Your reward will be customer evangelists who make you an object of interest with increasing Market Gravity.
Now it’s time to talk about how, exactly, the individuals throughout your organization keep their eyes on that prize. The answer is evolutionary performance dashboards.
EVOLUTIONARY PERFORMANCE DASHBOARDS
The Co-Create economy challenges companies to become much more proactive through the use of evolutionary dashboards, customized to the needs of different roles, and fed by a river of data from leading drivers. This is the only way to achieve the kind of near-real-time business intelligence the new paradigm demands. Dashboards of the future must be geared to evolution and adaptive innovation, most significantly to a refocusing on the greatest off-balance-sheet asset of any company—strategic relationships. To bring about this sea change in the use of data visualization, companies are going to need a new role at the leadership level—the insight architect.
First, let’s take a closer look at what’s wrong with current practice, how that might be transformed, and who will be needed to make that transformation come about.
What Is Wrong with Today’s Dashboards?
Unfortunately, the dashboards I’ve seen in use—when they are in use at all, which is another problem—are designed around lagging indicators. Thus, they are less functional than they should be, while also tending to be available only to a few people, with those few often quite far from the customer. In short, they are based on flawed premises concerning what the content should be, who should have it, and what they should do with that content. For example, the CTO might be able to tell that every device under his purview is functioning, but the tech in the van can’t see that she’s driving past an account with a recurring IT issue.
The Co-Create world demands much greater transparency. The sooner every individual whose efforts impact strategic goals has access to actionable insights, the better for the organization. If you want employees, customers, partners—any of your key stakeholders—to genuinely, authentically, join in the process of Co-Creation, you must give them the data that will help them think and act differently. Candor is more critical than ever. Numbers seldom lie. Dashboards tailored to role should be available to everyone from the front line to mahogany row—but sadly, this is almost never the case.
Sadly, too many of today’s dashboards are designed to reflect the past, not give a view into the future. They draw their numbers from organizational structures and accounting mechanisms that produce data based on a point in time that is already history. They are not aligned with what’s really happening.
How users consume dashboard information can also be problematic. We don’t have a common language to share the insights. Take a simple question like, “How many employees do we have?” If the answer is, “It depends,” that’s a problem. Something that should be definitive, black or white, is instead variable. “Are you talking about full-time employees only, or do you want a count that includes part-time as well?” “Are we talking about independent contractors as well as staff?” “Are we including the international teams or just talking domestic?” When every driver on the dashboard requires a conversation to properly understand it, the visual display has flunked its assignment. Dashboards customized to specific roles address this flaw. In other words, perhaps a breakdown of all the different kinds of employees is only useful to HR managers of truly large companies, where they’re tasked with tracking personnel for purposes of payroll, benefits, and headcount goals. On other department managers’ dashboards, that number would be less fine grained. On the other hand, the HR manager’s dashboard might show only top-level sales figures by product line, while the operation manager’s dashboard might show cost of labor, materials, and shrinkage during transportation.
Content that is contextually relevant is critical. One of the most powerful capabilities of a forward-thinking dashboard is the ability to explore “what if?” scenarios. In almost every instance there are levers that could, in real time, be pulled to modify and influence outcomes. Here’s what I’m talking about. If you’re an IT customer-service manager of an international organization, you’re going to want warnings of large-scale weather events as far in advance as possible. Because if your customers are hit with power outages and for some reason backup systems fail, you’re going to need extra personnel on hand to weather the tech storm. Who has training in handling the complex infrastructure? Now you’re not just prepared, you’re ahead of the game, and your SLAs will be fulfilled. An evolutionary performance dashboard allows you to simulate different scenarios, without adding undue complexity. I have seen very few existing dashboards that allow this kind of drill-down for thoughtful interaction with the content and context, in real time.
TRANSFORMING OUR USE OF DASHBOARDS
If we are going to put the right content where it can be consumed by the right roles, we need to seriously consider the following questions:
1. Who’s the audience for this specific dashboard? What data do these individuals need to make their decisions? This is why dashboards must be role specific.
2. What does this role care about? What decisions are individuals in this role responsible for, and what data and insights might they need?
3. What information do we have? Taking into account my earlier recommendations regarding external and internal leading drivers, what metrics can you produce? At what level of frequency and granularity?
4. What information is missing? You may not have a method to collect leading drivers yet. How will you close that gap? Note that the data you choose to include in any dashboard will almost certainly come from multiple sources. How will you combine that raw information into displays that easily yield actionable insights?
Figure 6.4: Dashboard Example

A sample Klipfolio social marketing dashboard.
5. How can we make it real time? Prepare for an organizational mindset shift, from just monitoring lagging indicators to anticipating real-time leading drivers.
6. How can we make it mobile? Most of us are not tethered to our desks, so our dashboards need to be mobile, and I don’t just mean mobile access to a desktop application. Think about the real estate available on your smartphone: you can’t easily draw insights from a spreadsheet with thirty-six rows and seventy-five columns. How can a dashboard display the information I need, at the time of my choosing, and on the device of my choice?
7. What is the frame of reference? Year over year, month over month, North America vs. Latin America? Data almost always raises the question, in comparison to what?
8. What is the trend? Likewise, dashboards should make it easy to connect the dots between leading drivers and current trends, between past indicators and anticipated future performance. I am baffled by how many clients tell me that “business is fantastic” but can’t explain exactly why and how.
Figure 6.4 shows a social media marketing dashboard from a clever company called Klipfolio, with information that is very helpful to the social media manager, social media marketing personnel from top to bottom, and also strategic planning and sales overall. Social media staff has the budget to buy Google AdWords and run Facebook campaigns and boosts, as well as to engage customers across platforms like Pinterest and Twitter and to make short videos for YouTube. Because some of this is pay-per-click (PPC), they need to know what works and what doesn’t in order to nimbly adjust and tune their marketing.
Of course, this is just the first screen, and behind it lies a world of increasingly granular information to guide everything from marketing segments to product design to website user experience. Within each venue, the user can determine what kind of device a customer is using; where they’ve come from and where they’re going; their physical location; how much time is spent on a page or site; and can delve more deeply into engagement. They can track Google AdWords ROI, and its real-time version can help sales and marketing follow short-term trends, particularly around events like product introductions or service and product upgrades.
With a dashboard designed in response to these questions, whatever your role, you will have content and a mode to consume it that makes it far easier to understand why something is happening, not just what is happening. An evolutionary performance dashboard has the functionality to explore hypothetical scenarios, and to drill down into the data. So sales are trending up in California? I double-click to explore why and discover that municipalities are buying our software to track and control water use after a new round of statewide restrictions. Is there perhaps a way to adapt our software to craft an app for homeowners? Where else is there drought and can we access that market? I see we have a customer there who bought more from us in the current quarter than ever before. What drove that purchasing? What does that customer know that we need to know? That our other clients could benefit from knowing? By carrying out these sorts of analyses throughout the value chain—and this is the real power of Co-Creation—insights begin to emerge. You are not just learning more about your operation but also about the ripple effects your value proposition has through the value chain.
Mobile, real-time, contextually relevant, interactive—an evolutionary performance dashboard makes visible the impact on strategic outcomes of the activity of the entire ecosystem around a company, including its customers, internal teams, suppliers, and even the media.
FRAMING SMAC—SOCIAL, MOBILE, ANALYTICS, CLOUD
In 2005, tech writers Michael Copeland and Om Malik declared that the “epic technological transformation” of cheap, powerful computer hardware (especially handheld devices), broadband internet access from almost anywhere, and a general sense of “technological openness” had ushered in computing’s “fifth wave.”8 Technological advances in the last decade have had far greater impact on the way we conduct business than the previous fifty years, they predicted—and I still agree. However, today’s version is slightly more complex than even the future that Malik and Copeland sketched out in Business 2.0. This can be attributed to four fundamental drivers of change, which are referred to by the acronym SMAC:
1. Social
2. Mobile
3. Analytics
4. Cloud.
Each (separately and together) is disrupting business and revenue models. Big Data strategist Mark van Rijmenam breaks down the key components of SMAC into analytical categories, using the human body as a leading metaphor. Social, he says, is like the hands, constantly interacting and sharing; mobile uses the senses, connecting with the world to take in the external environment. As for analytics, they’re the brain of the operation, and cloud is like the skeleton—intangible as the cloud is, it is still the structure that holds everything together.9
SMAC is not wishful thinking. “The convergence of Social, Mobility, Analytics and Cloud will lead business technology for the next decade,” van Rijmenam assures us, and SMAC will act as “an enabler for the next generation of technological trends.” As entire industries and business models are increasingly becoming digitized, “market leaders are information-based, implementing a SMAC stack; an integrated technology platform where the combined components are greater than the sum of their parts.”10 Deployment of SMAC technologies can be tied directly to business impact. That impact can be visualized on a KPD dashboard, and thus used to drive decision-making. SMAC can fuel an upward spiral of growth.
I frame the topic of SMAC technologies in terms of their impact on individuals, teams, and organizations. I will ask you to consider the application of these technologies in your business: What are you doing today, and what will become part of your strategy for the future? How will you think big but start small and find a way to scale?
By visualizing a matrix (as shown in figure 6.4), you can readily see how these questions apply.
Let’s take a closer look at the four technologies that comprise SMAC, including their significance for the individual, the team, and the organization.
Social: Social media is about collaboration, collective learning, and the collective experience. Effective use of social media results in opt-in knowledge management at scale instead of the often ignored “Reply All.” As an individual, you should be finding ways to leverage social media to learn, work out loud, and listen louder. Google alerts on relevant topics, for example, keep you on top of trends, and following industry thought leaders through their tweets, posts, and blogs always gives you something to think—and talk—about. As a team, put in place social environments that share the different team members’ experiences and access to insights for greater team efficiency and effectiveness. A team might have, for example, a closed Facebook group dedicated to a single, confidential project but also a collaboration page where partners outside the company are invited to participate. That social environment should be infused throughout your organization and across its relationships to become part of your value proposition. Some CEOs have a “morning tweet,” and many companies have monthly e-newsletters that offer global content that is relevant to all.
Mobile: As an individual, you should be familiar with common mobile apps, and you may already engage with some of them (Waze, Uber, Snapchat, WhatsApp) for several reasons. When you capture your own user behaviors—what works for you, why you use certain apps and not others—you are part of the conversation, the community, and can learn enormous amounts of leading-edge information. Do you understand that very important “front-page real estate,” where the apps that most impact our daily lives reside?
At the team level, you should be using mobile apps to disseminate information and insights to all members and leveraging the apps for team collaboration in real time. For instance, apps simplify many of the routine frustrations of collaboration, like scheduling a meeting where participants span time zones. How many cycles have you wasted to clarify the meeting is at 8:00 a.m. in San Francisco, 11:00 a.m. in Atlanta, and 4:00 p.m. in London?
As an enterprise, making mobile apps a communication channel for actionable insights is a must. Start with internal stakeholders, and then move to external audiences. Do members of your value chain, from supply partners to distributors and field reps, use mobile effectively? Maybe there is value you can offer in changing behavior for an improved experience, even, or especially, when that means opening a platform directly to customers’ use and input. If you’re a vendor and share a common inventory app, you can reduce a customer’s monthly order when you know they would otherwise be overstocked. Maybe that leads to a conversation about why an item isn’t selling in certain locations, which then leads to smarter distribution and product innovation to address geographical and seasonal preferences. As an organization, do you offer mobile payments? This isn’t just about B2C. Once consumers discover a unique personal utility, they often want to integrate it into their business at the office, making that mobile payment functionality very relevant to B2B users as well.
Are you using mobile effectively to communicate between customers, corporate, and a distributed workforce? Here is an example of a less-than-effective attempt to deploy mobile at the organizational level. A company gave an iPhone 6 with a trouble ticket app to all its field technicians, who quickly came to feel that the “half-baked” mobile app added very little value. Concerned about carrying so many devices, the technicians began to leave the company iPhones in their cars. Then a centralized dispatch tried to send a trouble ticket to one of those iPhones, which was in the car, and you can take it from there. By turning those smart devices into a dumb terminal thanks to a poorly designed mobile app, the company’s initiative failed.
You should be thinking deeply about how you can use mobile to improve your business, make it much more real-time, and bring your workforce closer to your customers. If you need a place to start, look to companies who have learned how to effectively engage consumers on their mobile devices.
Analytics: The data available to businesses continues to grow rapidly in quantity and quality, leading to deployment of analytics to cluster, segment, score, and predict scenarios. Analytics guides strategic decision-making, as discussed earlier in this chapter. What use of information can you create for yourself in order to fundamentally improve your team’s or your organization’s ability to drive growth in the Co-Create economy? Analytics requires bringing together data from multiple sources into a repository or warehouse, and this leads to the fourth driver.
Cloud: Social, mobile, and analytics are no longer constrained by geography. You are not physically bound by software that has to be installed on a server, or those shiny discs we used to call CDs, which now make fantastic Christmas tree decorations and keep the birds off the fruit trees in the garden. The cloud gives us access to content across multiple devices and platforms. With cloud storage I can edit a file in Kuala Lumpur that I created in Atlanta. As an individual, you should be leveraging the cloud, increasing efficiency and productivity with the tools it offers. Bring your team into a public or private cloud environment—perhaps by collaborating with tools like Basecamp, Dropbox, or Atlassian. As an organization, focus on increasing access for internal and external constituents using cloud technology. Tools are out there; you just have to find the right ones. A common discovery is that, by moving to the cloud, you can gain cost efficiencies through reduced infrastructure.
Technology Must Become More Strategic
I’m working with two clients now where IT appears to care more about blocking people from watching YouTube videos than disrupting themselves with deployment of SMAC for strategic advantage. We’re not talking about Bob’s Bicycle Shop; I’m having this conversation with the CEO of a fifteen-thousand-employee, $8 billion company. There is a seat missing at the C-suite’s table, and it’s not IT as we’ve known it, but rather the insight architect. Every key initiative is being held back by a lack of insight from technology. Technology is critical to the success of Co-Creation, in many ways: security, business intelligence, mobile apps, data warehousing and analytics, digital marketing, infrastructure—the list goes on. These are the nutrients of the Co-Create economy organization, and we need them in place everywhere, at every level of the company, for it to live and thrive.
Put simply, technology has that much more impact when it works in real time. Walmart and Procter & Gamble collaborated to improve their supply chain management, with a goal of eliminating excess inventory and increasing sales. Through better sharing of information between the two organizations, they were able to collaboratively forecast when to replenish P&G products in Walmart’s stores. The two firms were better able to understand their retailers and their consumers, and they made better decisions as a result.11
Think of the ripple effect of that kind of information exchange throughout the supply chain—how we get the right products into the right locations, how we merchandise those products with other products.
Co-Creation and SMAC: Travelport Labs Accelerator Case Study
Can SMAC really be relevant to the most mature companies in the most mature industries—companies that came of age long before computers leapt off our desktops and into our pockets, cars, and home appliances? The example of Travelport, introduced in chapter 5, suggests that the answer is yes. Let’s apply the SMAC framework to the innovations coming out of the company’s Co-Creation initiatives.
Two times per year, the Travelport Labs Accelerator enrolls a few start-ups into its program. Let’s view six companies from the first cohort through the lens of SMAC, as shown in table 6.1. (Note, I have only credited these companies with cloud technology if it is part of the value proposition of their customer experience. Simply using the cloud for back-shop operations isn’t enough—even your dog’s groomer is doing that by now. Using cloud for file storage is table stakes, not news.)
Table 6.1: How 6 of Travelport’s Start-Up Companies Score on SMAC
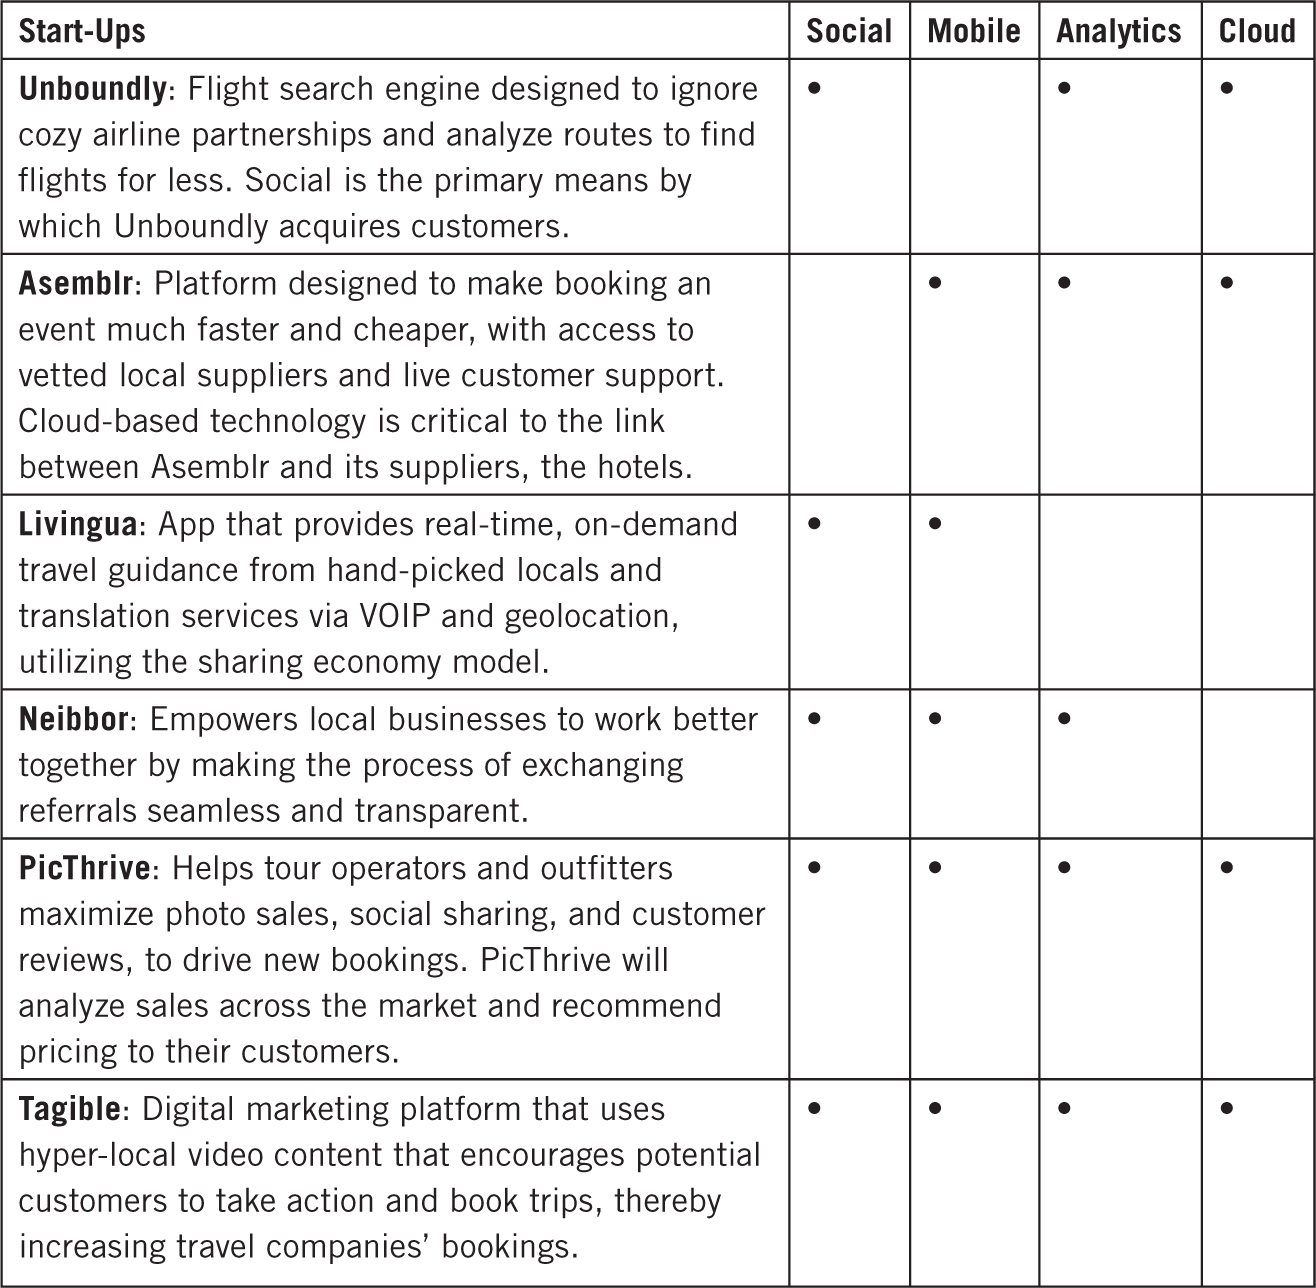
While not all Travelport-funded start-ups use all SMAC channels, note the heavy involvement in SMAC by these start-ups.
How You Respond Will Make or Break Your Upward Spiral
SMAC has tremendous potential to create competitive advantages for the companies that lead their industry. We can’t depend on CIOs alone to drive this game-changer. Technology must become more strategic, which means we need technologists who understand business and CEOs who understand SMAC.
The topics in this chapter focus on various aspects of using insightful KPDs to fuel your organization’s growth. Leading drivers, internal and external, need to be customized to specific roles and made easy to use through visual representation on dashboards. This creates the capacity for adaptive innovation, through sensing and filling existing, impending, and created needs. We need information architects on the board and at the executive table because SMAC technology is driving disruption for every enterprise, and your response will either set the course of your upward spiral or leave you on the sidelines.
TOOL 6: SMAC MATRIX
The Co-Create Toolkit PDF, available to you to download for free from CoCreateBook.com is intended to help you apply some of the key ideas you’ve just read in this chapter.
Co-created growth is transformational, because it yields net-new opportunities: previously untapped markets, customer segments, or audiences, or game-changing disruption to the value chain. The SMAC Matrix offers a lens through which to view any Co-Created market opportunity and potentially discover, facilitate, enable, or accelerate that next innovation in which the result is much greater than the sum of its parts.
This tool is designed to help you uncover the opportunities to Co-Create a market opportunity related to social, mobile, analytics, or cloud technology.
Chapter Six Takeaways
• Use leading drivers to give you sufficient advance notice to make strategic decisions and course corrections.
• Monitor key performance drivers (KPDs) using dashboards that display metrics for leading drivers of growth.
• Customize the dashboards for individuals in different roles, reflecting how their contributions drive business results.
• Use data from KPDs to anticipate new customer needs and respond with frequent innovations that help you remain an “object of interest.”
• Demand strategic technology that leverages “SMAC”—social, mobile, analytics, and cloud—to drive competitive advantage.