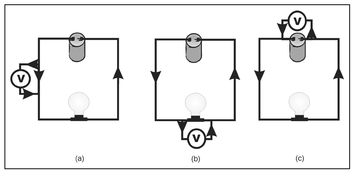
Figure 13.1. A circuit consisting of a battery as a source of current I, a light bulb, and a voltmeter indicated by the V within a circle, where the voltage is measured in three different locations.
A framework for wave-based image reconstruction was presented in Chapter 11 where wave travel time patterns for various views (wave source locations) were used. It was also noted in Sect. 7.7.1 that an out-of-focus image can be produced from EMI measurements by employing many different frequencies. This method is referred to as frequency sounding and an example of an out-of-focus image produced this way is presented in Fig. 7.19. It is possible to reconstruct a focused image from EMI frequency sounding data and, while not truly wave-based, EMI imaging has similarities to its wave-based counterpart. For example, in a cross-borehole measurement geometry (Fig. 11.3, left), the data acquired on the receiver array has 'encoded' in it information about the characteristics of all the material through which the wave has traveled (Fig. 11.4, left). An EMI measurement manifests a response to all variations in electrical conductivity that occur within a skin depth (Sect. 7.7.1) dependent volume (Fig. 7.18). The similarity between the two imaging methods ends at this point. In wave-based imaging the spatial variations in wave speed that are 'blended' in a single time shadow (Sect. 11.3) are 'unraveled' by exploiting different views. The view direction cannot be changed in EMI measurements and, therefore, it becomes necessary to sort out this blended information from changes in measured response at different frequencies.
Electromagnetic induction imaging is an emerging technique for which relatively little is known and no commercial implementing software is available. This is not the case for a conceptually similar imaging procedure known as electrical resistivity tomography (ERT). Although, as noted above, there are conceptual differences between wave-based and EMI-based imaging, they both deal with transient (time-varying) effects. Without a time-varying magnetic field, there would be no time-varying current induced in buried conducting objects. Hence there would be no induced time-varying magnetic field to give a measured response. Similarly, without a transmitted wave, travel time cannot be quantified and, without time shadows, there can be no images. In contrast, ERT is a static measurement, that is, it is not based on any time variations and, for a static measurement, the response measured at some point will be the same no matter when the measurement is made.
In Chapter 4 static magnetic fields were introduced. The concept of electromagnetics was presented in Sect. 4.4.3 where an electromagnet was created by applying a steady (static) current to a coil of wire and this produced a static magnetic field surrounding the electromagnet. The static electromagnetic field was extended to a time-varying magnetic field in electromagnetic induction (Chapter 7) generated by the application of a time-varying electric current to a coil of wire (Sect. 7.2). Finally, it was noted in Sect. 9.3 that the electromagnetic waves exploited in ground penetrating radar are characterized by time-varying electric fields and these fields exist simultaneously with time-varying magnetic fields. The purpose of this brief review is to introduce static electric fields. When a steady electrical current flows, there can be both a static magnetic field and a static electric field just like the time-varying counterparts in GPR and EMI. In ERT, images of electrical conductivity can be reconstructed from measurements of static electric fields. Since such fields are a result of the steady flow of electricity, changes in the electric field are a result of changes in the flow of the electrical current. The ERT imaging concept, as presented here, will be based on the changes in the flow of electricity in the underground that result from the presence of buried objects.
Ohm's Law is the relationship between three quantities that are used in ERT. These are electrical current, voltage, and resistance and each of these is described below.

Figure 13.1. A circuit consisting of a battery as a source of current I, a light bulb, and a voltmeter indicated by the V within a circle, where the voltage is measured in three different locations.
Figure 13.1 presents an electrical circuit that includes a battery as a current source, a light bulb, and a voltmeter for measuring voltage, depicted as the V within a circle. It is well known that, when electricity flows through a light bulb, light is emitted. For this to occur, some of the electrical energy is converted to light and this energy conversion requires that the light bulb offers some resistance to the flow of electricity. As shown in Fig. 13.1a, the voltage is measured at two points on the wire at the left side of the circuit and, as indicated by the arrows, the electrical current is flowing in a counterclockwise direction. Between the points at which the voltage is measured, the electrical current passes only through the wire, which is assumed to be metal. Since metal does not significantly resist the flow of electricity, little work must be done to move electrons through the wire over the distance shown. This suggests that the measured voltage will be low. The simple circuit is repeated in Fig. 13.1b, but here the voltage is measured between two points that are located on either side of the bulb. Since the bulb resists the flow of electricity, the battery must do more work to maintain the electrical current between these two points and, as a consequence, the measured voltage would be higher than for the measurement configuration shown in Fig. 13.1a. An additional voltage measurement position is shown in Fig. 13.1c where the voltage is measured on either side of the battery. For these measurement points, the current must flow through all the wire and the bulb. Since the resistance of the wire is quite low, the measured voltage will be high and similar to that measured in Fig. 13.1b representing the impedance of the light bulb.
Ohm's Law is the mathematical statement of the concepts depicted in Fig. 13.1 and can be expressed as
Equation 13.1:
V=IR,
where V is the voltage, I is the current, and R is the resistance. This equation simply states that voltage is equal to current times resistance. For all of the configurations shown in Fig. 13.1, the current is fixed. However, the location of the voltage measurement changes. For Fig. 13.1a, the resistance between the points across which the voltage is measured is quite low because, across this distance, the current flows through metal wire. From Equation 13.1, it is clear that the measured voltage is small because a very small number, the resistance R, is multiplied by the current I. When the voltage is measured across the light bulb (Fig. 13.1b and 13.1c), there is a larger resistance, that of the bulb, so that a large value of R multiplied by the current I leads to a larger value of the voltage V.
The simple circuit shown in Fig. 13.1 can be drawn in a modified form where the light bulb is replaced by a length of material that resists the flow of electricity more than metal wire. This element is known as a resistor. Figure 13.2 shows circuits where resistors of two different materials are used and R1 and R2 denote the resistance of the resistor materials shown in Figs. 13.2a and 13.2b, respectively. If the resistance of R2 is greater than R1, from Ohm's Law (Equation 13.1), the measured voltage in Fig. 13.2b will be greater than that measured in Fig. 13.2a. Thus, measured voltage can be used to discriminate material properties.
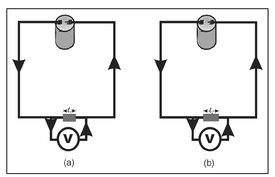
Figure 13.2. Illustration of identical circuits except that the resistor in (a) has a lower resistance, R1. than the resistor in (b), R2.
The problem with this form of discrimination is that the resistance and, consequently, the voltage, depends on the quantity of material through which the current must flow. Although the resistance R2 is greater than R1, the measured voltage for the circuit shown in Fig. 13.2b could be less than that for the circuit shown in Fig. 13.2a if the resistor shown in Fig. 13.2b is physically shorter. This is linked to the definition of voltage as being dependent on the length of resistive material through which the current must flow. Two circuits similar to those presented in Fig. 13.2 are shown in Fig. 13.3 but, here, resistors of the same material and differing lengths are considered. In Fig. 13.3a, the resistor has a length of l1 and, in Fig. 13.3b, the resistor has a length of l2. Since, as shown, l2 is greater than l1, the resistance R2 is greater than R1. From Equation 13.1,
V1 = I R1
and
V2 = I R2
so that V2 is greater than V1 in spite of the fact that the resistors are made of the same material. Clearly, for the measured voltage to be a discriminator of a material property, the size of the resistor must somehow be factored into Ohm's Law.
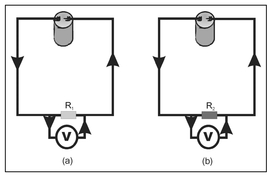
Figure 13.3. Illustration of circuits with resistors made of the same material but having two different lengths l1, where l2 is greater than l1.
A new property, the resistivity, can now be introduced that is a fundamental material property independent of the quantity of this material through which a current flows. The resistivity is usually denoted by ρ (the Greek letter rho) and is related to the resistance R, for very thin wire, by
Equation 13.2:
R = ρl
and, from this equation, it is seen that resistance is equal to the resistivity multiplied by the length of the resistor l. Equation 13.2 can used in Equation 13.1 to provide the modified form of Ohm's Law
Equation 13.3:
V = I ρ l
and, in this form, Ohm's Law can be used to compute the basic material property resistivity. This becomes evident when Equation 13.3 is used to express the voltages for the circuits shown in Fig. 13.3. Here,
V1 = I ρ l1
V2 = I ρ l2
where it should be recognized that, although the measured voltages V1 and V2 are different, both resistors are made of the same material and have a resistivity ρ. The form of Ohm's Law given by Equation 13.3 can be written as
Equation 13.4:
and either of these equations can be solved for the resistivity ρ to yield
or
Given that the length of the resistor is known, the form of Ohm's Law presented in Equation 13.4 can be used to determine a basic material property, the resistivity, independent of the amount of resistive material that is present.
The unit of electrical resistivity is the ohm-meter and it is the inverse of electrical conductivity introduced in Sect. 7.3, or the resistivity is one divided by the conductivity.
The procedure defined by Equation 13.4 for determining the resistivity of an object from the measured voltage only works when all the electrical current flows through the object. This is clearly the case for the circuits illustrated in Figs. 13.1, 13.2, and 13.3. A subsurface material can be characterized in this manner if a sample of the material is inserted into an electrical circuit to replace the resistor. Since the objective of geophysics is the non-invasive characterization of the subsurface, it is necessary to perform electrical measurements similar to those illustrated in Figs. 13.1, 13.2, and 13.3 without the need to recover a sample and this necessarily requires that an electrical current be introduced into the underground.
If a wire could be inserted into the ground such that electrons would pass out of the wire and into the subsurface, there would be a flow of electrons that behave as if they were emitted by a point source; in other words, the electrons would move radially outward from the source. This process is analogous to light emitted from a light bulb where it is well known that the intensity of the light diminishes with distance from the bulb. Similarly, the flow of electrons will diminish with distance from its source and this is also analogous to the loss of amplitude associated with waves from point sources introduced in Sect. 6.2.2 and is referred to as geometric spreading. While the total current introduced into the subsurface is I, the current at some location away from the point of injection will be less than I. This local current is called the current density and is conventionally denoted by i. Figure 13.4a shows the change in current density at various positions away from the wire source and, at each location, the current density is displayed as an arrow because current density is a vector characterized by both a magnitude and a direction along which it flows.
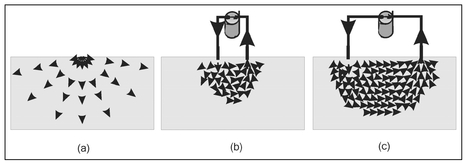
Figure 13.4. Illustration of (a) the hypothetical distribution of current density from a point source of current, (b) the current density distribution for a two-electrode configuration, and (c) the change in the pattern of current density as the electrode spacing is increased.
The current density pattern shown in Fig. 13.4a can be considered as hypothetical because an electrical current cannot be made to flow in this manner. Electricity must flow in closed circuits which means there must be a path through which electricity can flow from the source, through a material such as a wire, and then back to the source, Figure 13.4a has no return path and is equivalent to removing the wire from one of the battery terminals in Fig. 13.1. In this situation, there is no flow of electricity and this condition is known as an open circuit. To create a flow of electricity in the subsurface, two wires must be inserted into the ground—one to introduce a current and the other to provide a return path back to the current source. These wires are called electrodes and, with the use of two electrodes, the pattern of current density is no longer as shown in Fig. 13.4a. Figures 13.4b and 13.4c show the pattern of current density vectors for the two electrodes relatively close together and further apart, respectively. It is important to note that neither of these patterns is like that shown in Fig. 13.4a and, as the electrodes are moved further apart, there is a general decrease in current density.
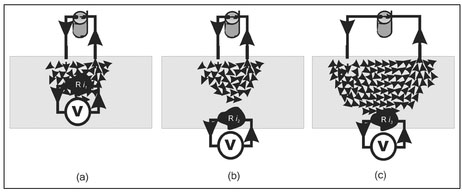
Figure 13.5. Illustration of an experiment to measure the voltage across a resistive object for different depths and electrode spacings.
Figure 13.5 depicts experiments where the voltage is measured across a resistive object. In this figure the object remains the same but its depth and the spacing between the two electrodes change. None of the forms of Ohm's Law previously considered will be valid for determining either the resistance of the object or the resistivity of the material because only a portion of the total injected current, I, passes through this buried object. Clearly, for these cases, Ohm's Law must be modified to use the current density, i, rather than the current I and this current density varies with the position of the object and the electrode separation. Fortunately, for a given electrode separation and a knowledge of the total current injected, I, it is possible to predict the current density anywhere. The current density passing through the object is denoted by i1, i2, and i3, at the object location relative to the electrode positions shown in Figs. 13.5a, 13.5b, and 13.5c, respectively. Knowing the electrode spacing, injected current, I, and position of the object, it is possible to compute the current densities i1, i2 and i3. Ohm's Law can now be used, replacing the current by the current density,
Equation 13.5:
to compute the Resistance of the object.
For each experiment shown in Fig. 13.5, the measured voltage will be different and these are identified as V1, V2, and V3 for the configurations shown in Figs. 13.5a, 13.5b, and 13.5c, respectively. Although the current density and measured voltage differ in each of these experiments, the applications of these voltages and current densities to Equation 13.5 will yield the same computed resistance or
Furthermore, if the length of the resistive object is known, the resistivity of the object can be computed using Equation 13.2 based on the resistance determined from any of the three experiments shown in Fig. 13.5.
The fundamental problem in determining an object's electrical resistivity by the experiment shown in Fig. 13.5 is that it is invasive, requiring a measurement of the voltage directly across some buried object. The next section presents the final element of the resistivity measurement process where voltage measurements are made on the ground surface.
Because the measurement configuration shown in Fig. 13.5 is invasive, it is not practical for geophysical applications. Instead, the voltage is measured at the ground surface by the introduction of two additional electrodes that are connected to the voltmeter (Fig. 13.6a). The reason this configuration works is that the current density vectors shown in Fig. 13.5 are not correct. In reality, the presence of an object having a resistivity different from its surroundings will alter the current density everywhere. However, this change will be most pronounced in the vicinity of the object. The reason this change in current density occurs is that electricity will seek to flow along paths of least resistance. Figures 13.6b and 13.6c show the pattern of current density for two different objects. These objects are the same size and position relative to the electrodes, with the only difference being that the material of the object shown in Fig. 13.6b is more resistive than its surroundings while the object shown in Fig. 13.6c is less resistive (more conductive) than its surroundings. Inspection of these two figures reveals that, for both, the pattern of current lines differs from that shown in Fig. 13.5 and, in addition, they differ from each other. For a resistive object (Fig. 13.6b), the path of least resistance for the flow of electricity is around the object and, as shown, the pattern of current density lines is drawn accordingly. The situation is reversed for the conductive object (Fig. 13.6c) where the current density lines are directed through the object since this is the path of least resistance. In both cases, the current lines around the electrodes at which the voltage is measured are different from those shown in Fig. 13.5 and, as a result, the measured voltage across these points will differ.
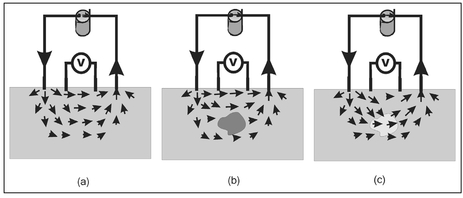
Figure 13.6. Illustration of the four-electrode configuration used in electrical resistivity measurements. Two electrodes are used to inject and withdraw the current and a voltage across two points on the ground surface are measured across the other two points. Current density vectors are shown for (a) no object present, (b) a resistive object present, and (c) a conductive object present.
A static electric field can be created whenever there is a steady flow of electric current. The presence of an object that has an electrical resistivity different from its surroundings will alter this electric field and this change is manifested in the pattern of current density vectors (Fig. 13.6). The measured voltage is related to the difference in the electric field at the two voltage measurement points and a change in the electric field, as might be caused by the presence of a buried object, will appear as a change in measured voltage. This effect is similar to the change in the magnetic field at the Earth's surface caused by the presence of a buried ferrous object (Sect. 4.4). There are also similarities between the change in the static electric field caused by the presence of a buried object and the induced field created in EMI measurements by a buried conducting object (Chapter 7). If the electric field is thought of as the field that would exist in the absence of the buried object plus a change in that electric field associated with a buried object, this 'perturbed' static electric field behaves much like the induced time-varying magnetic field in EMI. In particular, as the buried object becomes deeper the change in the electric field at the ground surface becomes weaker, that is, the electric field at the ground surface differs little from that which would be measured in the absence of the object.
Measuring the voltage on the ground surface introduces another complication in computing the resistance of a buried object. Specifically, Ohm's Law will not work because (1) the distribution of current density cannot be accurately predicted without knowing the specifics of the buried object (size, location, resistivity, etc.) and (2) the voltage is no longer measured directly across the object as it is in Fig. 13.5. In the development of the modified Ohm's Law defined by Equation 13.5 and illustrated in Fig. 13.5, it was assumed that the presence of an object did not change the pattern of current density and that the voltage is measured directly across the object. For the measurement configuration shown in Fig. 13.6, there are simply too many unknowns (too little information) to develop a viable modification to Ohm's Law.
In light of the above-cited constraints and complications, the best that can be achieved is to assume that the effect of a buried object is distributed (smeared) over the entire volume through which the electrical current flows. Given this assumption, it is possible to again modify Ohm's Law to compute a resistivity. The reason this works is that it is assumed that the electrical current flows through a material that has a uniform resistivity and, although this resistivity in unknown, there is no modification to the pattern of current density. This is equivalent to returning to the assumed current density pattern illustrated in Fig. 13.5 and, with this assumption, aversion of Ohm's Law can be used that is correct for any arbitrary positioning of the four electrodes (Fig. 13.7).
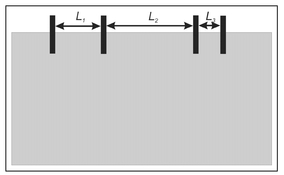
Figure 13.7. Illustration of an electrode configuration where the electrode spacing is arbitrary and defined by distances L1, L2, and L3.
It must be remembered that this procedure does not recover the electrical resistivity of the buried object but, rather, a resistivity that is averaged over the entire volume through the electrical current flows, and, if a buried object is present, it will alter this averaged value. Because this procedure does not yield the resistivity of a discrete object, the resistivity computed in this manner is referred to as the apparent resistivity and typically denoted by ρa.
The process for estimating the apparent resistivity presented in Sect. 13.4 may not seem particularly useful because, by virtue of the necessary assumptions, the apparent resistivity is distributed over some volume. This would be the case if not for the fact that, to some extent, the volume over which the injected electrical current is distributed can be controlled by the positioning of the four electrodes. For example, a closely spaced pattern of electrodes can be moved across the ground surface to identify the location of a shallow conducting or resistive buried object. Figure 13.8 displays the pattern of current density vectors for a case where the current injection and withdrawal electrodes are close together. Superimposed on these vectors is a shaded region that defines the area within which most of the current is confined.
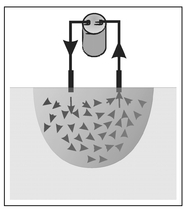
Figure 13.8. Illustration of the pattern of current density vectors where the superimposed shaded region defines the area over which most of the current flows.
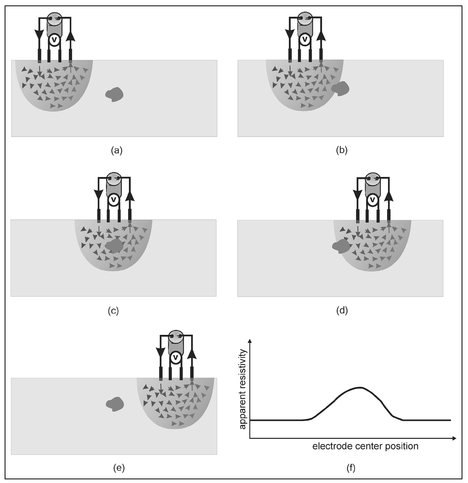
Figure 13.9. An experiment illustrating how electrical resistivity measurements and the computed apparent resistivity can be used to laterally locate a buried object.
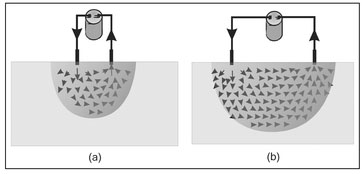
Figure 13.10. Electrode spacing can be varied to provide depth information. When (a) the electrodes are closely spaced, current penetrates only to a shallow depth and only shallow objects can be detected. However, (b) increasing the electrode spacing causes deeper penetration of the current allowing deeper features to be revealed.
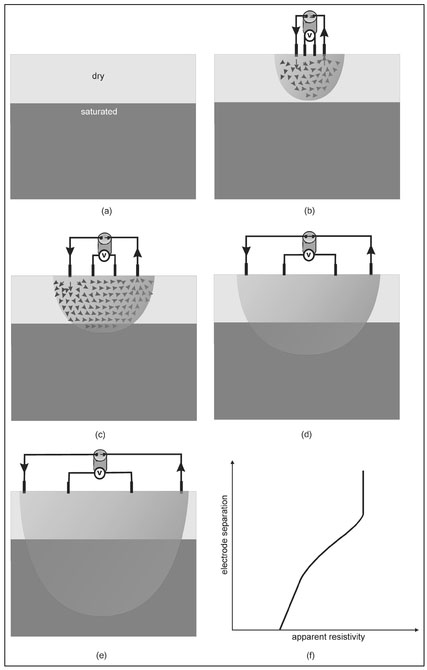
Figure 13.11. Illustration of geometric depth sounding to (a) identify an aquifer. When (b) the electrode spacing is small, no current penetrates into the aquifer. As the electrode spacing is progressively increased, (c), (d), and (e), increasingly more current flows into the aquifer leading to (f) a graph of apparent resistivity showing a decrease in apparent resistivity as a function of electrode spacing (depth).
If an object that is more or less resistive than the background occurs within this region, a change in voltage will be measured. However, if it lies outside of the shaded region, there will be no change in the measured voltage. Figure 13.9 illustrates an experiment where the approximate location of a buried object can be determined by resistivity measurements. In this experiment, the four electrodes are sequentially moved in unison so as to maintain the same electrode spacing. In Fig. 13.9a, the buried object does not occur within the region of influence of the injected current so that there is no change in measured resistivity (voltage) for this position of the electrodes. By progressively moving the electrodes to the right, a point is first reached where the buried object is partially impacted by the injected current (Fig. 13.9b). This will produce a slight change in measured resistivity. By continuing to move the electrodes to the right, they will eventually occupy a position such that the buried object is directly centered below the electrode array (Fig. 13.9c). At this point, the maximum fraction of injected current will pass through the object and the maximum change in resistivity will be measured. Further movement of the electrodes to the right will move the object out of the region of injected current (Figs. 13.9d and 13.9e) and there will be a progressive decline in the measured apparent resistivity. The computed apparent resistivity as a function of the lateral position of the center of the four electrodes is given in Fig. 13.9f. From this graph, it is clear that the horizontal position of the buried object is easily identified as occurring directly below that point where the maximum change appears. However, it should be noted that, while the location is accurate, the computed apparent resistivity does not equal the resistivity of the buried object. This is because the computed apparent resistivity is the average value of the resistivity of all the material within the shaded areas shown in Fig. 13.9 and is a direct consequence of the definition of apparent resistivity.
The example of locating a buried object by moving the center of the four electrodes is not the only way in which subsurface information can be derived from resistivity measurements. As the electrode spacing is increased, the region over which the injected current flows also increases. As shown in Fig. 13.10, with the increase in the electrode spacing, there is an increase in the depth to which the current penetrates into the underground. Because this current penetrates deeper, measurements can be made where the center of the four electrodes remains fixed but their spacing increases. As the electrode spacing is increased, information at progressively greater depths is obtained so that electrode spacing is related to object depth. This type of measurement is called geometric depth sounding.
Since the electrical resistivity of water is considerably lower than that of dry soil or rock, geometric depth sounding is commonly used in groundwater resource exploration. Figure 13.11 illustrates how this procedure works. It is assumed here that there is a relatively well defined interface between dry soil above an aquifer (Fig. 13.11a). For a small electrode spacing (Fig. 13.11b), current does not penetrate into the saturated zone and the apparent resistivity computed from this measurement is that of the dry soil. As the electrode spacing is increased, a spacing is reached where current begins to penetrate into the aquifer (Fig. 13.11c) producing a slight decrease in apparent resistivity. Further increases in electrode spacing (Figs. 13.1 Id and 13.1 le) will result in a progressively greater fraction of the current passing into the aquifer and a progressive decrease in apparent resistivity (water is less resistive than dry soil).
Figure 13.1 If presents a graph of apparent resistivity versus electrode spacing. Since increasing electrode spacing is associated with increasing depth, and the resistivity should decrease with depth as the water table is encountered, this graph should display a decrease in apparent resistivity with increasing electrode spacing. This is, in fact, the case. However, the sharp transition shown in Fig. 13.11a is manifested in Fig. 13.11f as a gradual change. This occurs because it is the apparent resistivity rather than the actual resistivity that is presented and the apparent resistivity for any electrode spacing is an average of the resistivity of all the material through which the current passes. As the electrode spacing is increased (Figs. 13.11b to 13.l1e), a progressively larger fraction of the current passes through the saturated zone leading to a gradual decrease in apparent resistivity. The apparent resistivity will never actually equal the resistivity of the saturated zone because current must always pass through the unsaturated zone to reach the aquifer so that the resistivity of the dry soil will always comprise a part of the apparent resistivity. While the graph of apparent resistivity shown in Fig. 13.11f may not seem particularly useful in groundwater exploration, there are somewhat complicated techniques by which the depth to a sharp transition can be estimated, based on the gradual change that always appears in geometric depth sounding apparent resistivity plots.
The process of characterizing the apparent resistivity of the subsurface, as detailed in Sects. 13.4 and 13.5, is limited for a number of reasons. When moving the position of the center of electrodes along the ground surface while maintaining a fixed electrode spacing (Fig. 13.8), a reasonable estimate of the lateral position of a buried object can be obtained. A corresponding estimate of object depth by geometric depth sounding is more problematic and imprecise as illustrated in Fig. 13.11. Furthermore, because the apparent resistivity is some volume-average, the computed apparent resistivity of a buried object will be quite different from the object's actual electrical resistivity.
A focused image of actual resistivity can be obtained through the application of electrical resistivity tomography. This method employs a composite of the two techniques discussed in Sect. 13.5, namely, moving the four electrodes while maintaining a fixed electrode spacing and changing the electrode spacing (geometric depth sounding). This is a form of tomographic image reconstruction that, in some respects, is similar to that presented for wave-based imaging (Chapter 11) but requires a revised concept of views as originally described in Sect. 11.1. To illustrate the ERT method, first consider a buried object, taken to have a resistivity higher than its surroundings, for the two different electrode spacings and object position shown in Fig. 13.12. For closely spaced electrodes (Fig. 13.12a), the injected current does not reach the buried object so that the apparent resistivity is the resistivity of the host geologic material indicated by the dark gray shading of the area of current density influence. Although increasing the electrode spacing (Fig. 13.12b) increases the region impacted by the injected current, this current still does reach the buried object. For this reason, the computed apparent resistivity remains that of the host material and, while large in extent, is shaded dark gray to indicate that the apparent resistivity is the resistivity of the host material. From these two experiments, it can be concluded that no object lies with the shaded regions indicated in Fig. 13.12.
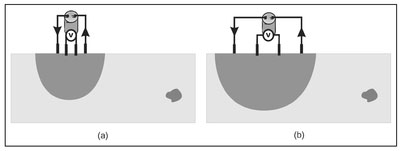
Figure 13.12. Illustration of resistivity measurements for (a) closely spaced electrodes and (b) a greater electrode spacing where a buried resistive object is not represented in the acquired data.
The situation will be different if the experiment shown in Fig. 13.12 is repeated but with the buried resistive object assuming a different position relative to the electrode placement (Fig. 13.13). When the electrodes are closely spaced (Fig. 13.13a), the injected current does not extend to the object and, once again, the apparent resistivity is that of the background material. When the electrode spacing is increased, the injected current now reaches the buried object and the apparent resistivity is elevated above that derived from that measurement shown in Fig. 13.13a. For this reason, the region of current influence shown in Fig. 13.13b is shaded medium gray. Individually, the two experiments do little to define the position of the buried object or its resistivity. However, when considered collectively, the information is improved. The apparent resistivity derived from the experiment shown in Fig. 13.13b is an average over the entire volume represented by the medium gray shading. Since the object occupies only a small fraction of the volume, the apparent resistivity is dominated by the resistivity of the host material leading to a very slight change in the computed apparent resistivity relative to the host material. Using the information from the measurements shown in Fig. 13.13a and 13.13b, both the location of the object and the estimate of its resistivity can be improved. It is known from the closely spaced electrodes (Fig. 13.13a) that the object does not lie within the area shaded dark gray. It is further known, from the larger electrode spacing, that an object must lie in the area of Fig. 13.13b. Since the object must be present in the medium gray shaded area but absent in the area shaded dark gray, it clearly must lie within the light gray shaded area shown in Fig. 13.13c where the two shaded areas shown in Fig. 13.13a and 13.13b do not overlap. The ring shown in Fig. 13.13c is shaded light gray because a different value for the apparent resistivity can be derived from this new information that constrains the object's location. Now the change in apparent resistivity between that derived from the experiments shown in Figs, 13.13a and 13.13b can be distributed over only the light gray ring shown in Fig. 13.13c rather than the larger area shaded medium gray in Fig. 13.13b. This yields an increased value of the apparent resistivity that is closer to the actual resistivity of the buried object.
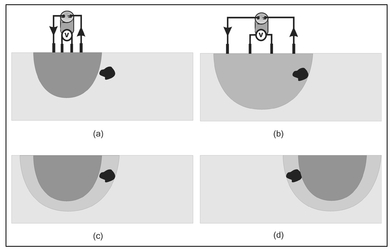
Figure 13.13. Illustration of the region of injected current influence and apparent resistivity for (a) closely spaced electrodes, (b) an increased electrode spacing, and (c) the region (light gray) within which the object's location is constrained by information derived from both electrode spacings.
The experiments depicted in Fig. 13.13 employ two electrode spacings with a common center-point for each. This is geometric depth sounding as described in Sect. 13.5 and here it is used to constrain the location of the buried object and improve the estimation of its electrical resistivity. The light gray ring shown in Fig. 13.13c is comparable to a partial image derived from a single view (Sect. 11.1). In order to form a focused image, it is necessary to created more partial images from additional views. This is done by moving the electrodes to the right of their positions shown in Fig. 13.13 and performing experiments for different electrode spacings. The results of these two experiments are shown in Fig. 13.14a where the object is again constrained to be in the ring that is shaded light gray. These two experiments comprise a second view and the light gray ring shown in Fig. 13.14a is the partial image associated with this view. The object must lie in the area where these two partial images overlap. This area is outlined with bold lines in Fig. 13.14b which shows the two partial images superimposed. By considering only two partial images, the location of the buried object is well resolved, because the object is now constrained to be within a very small volume. A precise volume averaging correction can be applied to the apparent resistivity to compute a resistivity that closely matches that of the buried object.
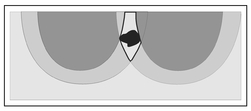
Figure 13.14. Two experiments similar to those shown in Fig. 13.13 but with different electrode positions that yield (a) a second partial image and (b) an image defined to be the region of overlap of the two partial images.
The two light gray rings shown in Fig. 13.14 are analogous to the shaded triangles associated with distinct source positions shown in Fig. 11.4 and, just as a wave-based image can graphically be reconstructed as the intersection of two triangles, a resistivity based image can be constructed as the intersection of two rings.
The two partial images shown in Figs. 13.13 and 13.14 can serve to characterize an object that is located in only a limited region. If the object was located either further to the right or left or deeper than shown in Figs. 13.13 and 13.14, the object would not be resolved in the image. To properly implement ERT, many electrode locations must be used. This will produce many views with many associated overlapping rings or partial images.
The instrument needed to make resistivity measurements can be quite simple, consisting of items that can be found in most hardware stores—a battery, voltmeter, wire, and four metal stakes as electrodes. Such instrumentation can be used to implement the ERT data acquisition procedure described in Sect. 13.6. However, such measurements would be quite slow and labor intensive since it requires frequent measurement and repositioning of the electrodes. For this reason, commercial resistivity systems are more sophisticated and expensive and consist of many electrodes that have internal switches and electronics to execute some predefined electrode switching. Using such a system, many electrodes can be placed at a uniform spacing over a given line on the ground surface (Fig. 13.15) and the electronics automatically cycle through a sequence of selections of various groupings of four electrodes such that many combinations of electrode spacings and center-positions are realized. One such grouping is illustrated by the black electrodes in Fig. 13.15.
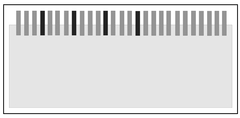
Figure 13.15. State-of-the-art resistivity instruments allow the deployment of many electrodes and various groupings of four electrodes are made by electronic switching.
Once the electrodes are placed and the cable is attached, a complete data acquisition can be accomplished in one or two hours. This is far shorter than the time required for a similar set of measurements made using only four electrodes.
Like any other geophysical method, for an object to be detected by resistivity measurement, it must exhibit a property difference with respect to its surroundings, here electrical resistivity. Also like other methods, the capacity to detect depends on its size, depth, and material property contrast. Using a large electrode spacing allows current to flow deeper into the subsurface but, at the same time, the current density is reduced as compared to a closer electrode spacing. This means that the change in voltage measured at the ground surface as a result of a deep object may fall below the instrument's sensitivity. If the object is larger, more of the injected current will pass through it causing an increase in its manifestation in the measured voltage. Similarly, if the object has a large difference in resistivity as compared to the host material, it will produce a greater alteration of the near-surface current density where the voltage is measured. Thus, as an object becomes deeper, it must also become larger and/or have a greater resistivity contrast with respect to the host geoloey in order to be detected.
There may be sites where, because of the nature of the near-surface soil, electrical resistivity will fail. This occurs when these soils are so resistive that it is impossible to create a flow of electrical current in the subsurface. This can occur in sandy soil and where the soil is poorly compacted. In dry soil, pore space is air-filled and air is quite resistive. In some cases this problem can be mitigated by pouring salt water on the ground around each of the electrodes. Salt water is a good conductor of electricity and will facilitate the desired flow of electricity.
In the past, electrical resistivity has most commonly been used for near-surface geologic mapping and, more specifically, identifying and characterizing groundwater resources. The reason for these limited applications is that because the quantity derived from such measurements (the apparent resistivity) represents a volume-averaged response, this method is best suited for defining vertical geologic structure. Even for these simple applications, resistivity measurements required considerable interpretive skills. With the recent availability of commercial software for implementing ERT, the applicability of resistivity measurements has expanded to include such problems as environmental remediation and archaeology. Here several case studies in ERT are presented and, through these studies, it is demonstrated that, with the aid of the new generation of software, excellent understanding of the underground can be achieved with modest interpretive skills.
In this book, numerous examples of the use of geophysics to find caves and tunnels have been presented. In particular, solution features were discussed in Sect. 10.1 in the search for the treasure of the outlaw Jesse James. Solution features are naturally occurring voids in limestone or other soluble rock that result from the movement of groundwater within these formations. Over time, a particular solution feature can grow into a sizable void having a roof so thin that it can no longer support the weight of the overlying rock, and a collapse will occur. Depending on the depth of the solution feature and the overlying geologic structure, the collapse can be localized or can cause the downward movement of material that extends from the void to the ground surface. In the later case, the surface manifestation of the collapse is called a sinkhole. If the horizontal extent of the area of roof collapse and the void itself is large, the vertical movement of soil may leave an open hole extending from the ground surface into the void below. More commonly, the collapse is less severe and overlying soil expands as it moves downward. In this case, there is no open hole but only a depression on the ground surface with a column of soft soil below. This structure is illustrated in Fig. 13.16a and it is quite similar to the man-made underground and surface access tunnel shown in Fig. 12.14 prior to excavation. When the solution feature is below the water table, a 'map' of electrical resistivity in a vertical cross-section might appear as shown in Fig. 13.16b.
Soluble rocks typically have voids of various sizes that will retain water and, since water is less resistive that either rock or soil, a water-saturated limestone layer will have a low resistivity relative to the overlying dry soil. This resistivity difference is represented in Fig. 13.16b by shading the limestone light gray and the dry soil dark gray. The void locally has an even lower resistivity than the surrounding rock because it contains a higher percentage of water. This region of low resistivity is presented as white in Fig. 13.16b. As a result of the large air fraction, the column of loose soil extending from the ground surface to the water table can have the highest resistivity within the cross-section and is rendered as black in Fig. 13.16b.
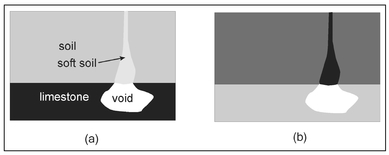
Figure 13.16. Illustration of (a) a vertical cross-section through a sinkhole and (b) a map of how the spatial distribution of electrical resistivity might appear if the void lies below the water table.
Figure 13.17a1 presents a gray scale plot of the apparent resistivity computed from data acquired in an area where a sinkhole was suspected. As discussed in Sect. 13.5, the apparent resistivity is a response that is averaged over the volume within which a current flows (Fig. 13.8). This apparent resistivity is assumed to occur at a lateral position that is in the center of the four electrodes used in the measurement and at a depth that is related to the electrode spacing. The apparent resistivity map is thus an out-of-focus image of a vertical cross-section, where horizontal position is actually the position of the center of the four electrodes used for a particular measurement, and the depth is proportional to the electrode spacing employed for that measurement. It is obvious that the pattern of apparent resistivity shown in Fig. 13.17a looks nothing like the expected resistivity cross-section shown in Fig. 13.16b. This is an example of why, by themselves, resistivity measurements have limited applicability and require considerable interpretive skills and insight. It is also evident in Fig. 13.17a that the spatial coverage of the vertical cross-section is wedge-shaped rather than rectangular. This is a consequence of the geometric depth sounding approach (Sect. 13.5) and the finite length of the electrode array. Referring to the electrode array shown in Fig. 13.15, it is clear that it is impossible to obtain information in the lower left corner of the shaded rectangular vertical cross-section without extending the electrode array further to the left. A similar situation exists for the lower right corner of the cross-section.
The focused image of the vertical cross-section after the application of ERT is shown in Fig. 13.17b. The features of interest are now quite apparent. The saturated zone (light gray) and overlying dry soil (black) can be clearly identified as can two large voids within the limestone (white) and the associated columns of loose soil (various shades of gray). Not only does this image present a clear 'picture' similar to the idealized one (Fig. 13.16b), it also provides resistivities that closely mimic the correct values, making this an excellent diagnostic for material characterization. In comparing the stylized resistivity map (Fig. 13.16b) and the actual one (Fig. 13.17b), there is clearly a difference in the resistivity of the vertical columns of soft soil. This difference is likely a result of soil moisture where, in the actual case, soil moisture is higher. When the void space within the loose soil is water filled, the resistivity will be lower than the surrounding dense soil.
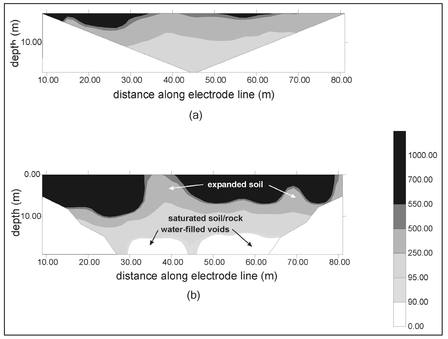
Figure 13.17. Gray scale plot of (a) the apparent resistivity and (b) the focused image resulting from the application of ERT for a vertical cross-section of the subsurface believed to contain a sinkhole.
The oldest known written version of the Old Testament, the Dead Sea Scrolls, was found in a cave near the ancient city of Qumran. Excavations at Qumran have revealed an occupation dating to the Iron Age II, approximately 800 BCE. However, the Scrolls have been dated to about 100 BCE, the period of the Second Temple. It is believed that these parchment documents once resided in a library at Qumran but were hidden in caves to prevent their capture by invading Romans.
Since their discovery in 1947 by Bedouins, 40 more caves have been searched and excavated leading to the discovery, in 11 caves, of near-complete sets of the 24 books of the Old Testament. The search continues for additional caves that may contain additional parchment documents or artifacts from this period. As part of this ongoing investigation, electrical resistivity tomography has been applied in an attempt to identify unknown caves with entrances that may have been sealed off since their ancient occupation. Figure 13.182 shows imaged electrical resistivity acquired in Qumran within a vertical crosssection below an 80 m long line of electrodes. Since a cave in this area is likely air-filled and air has an extremely high electrical resistivity, the cross-section of a cave should appear in an imaged vertical crosssection as a near-circular area of high electrical resistivity. Such an area appears in this figure at a depth of about 2 m.
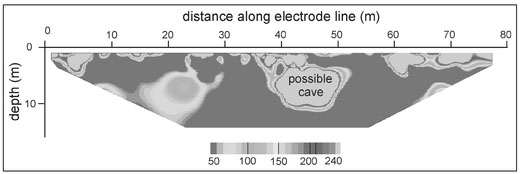
Figure 13.18. Reconstructed ERT image of a vertical cross-section displayed as false colors. As annotated, the highest electrical resistivity appears to be a cave in Qumran.
While this feature is likely a cave, it remains to be determined if this cave contains any information dating to the period of the Dead Sea Scrolls.
1. Data and image courtesy of the Unites States Geological Survey.
2. Image courtesy of Paul Bauman, Komex International Ltd.