C H A P T E R T E NC H A P T E R T E N
THE FINAL LINKAGE FROM HIGH-LEVEL STRATEGY to day-to-day actions occurs when companies link individuals’ incentive and reward programs to the Balanced Scorecard. As one plant manager noted after implementing a new reward program linked to its scorecard, “We have always had the measures. And we have always communicated them. Now our people are interested in them.” A Mercer Consulting Group, Inc., study of compensation practices in 214 companies reported that 88 percent of responding companies considered the linkage of Balanced Scorecard measures to reward systems to be effective.1 Likewise, a Hay Group study of fifteen sophisticated users of the Balanced Scorecard found that thirteen of them linked pay to the scorecard.2 Fifty percent linked compensation to their first Balanced Scorecard. Those that did not link pay quickly to the scorecard had started with a pilot implementation and were still in the process of deploying the scorecard more widely in the organization. The companies had adopted the Balanced Scorecard to reinforce their transformation from a traditional functional organization to a new customer-focused one, as the following list shows.
| Old Organization | New, Customer-Focused Organization |
| Functional | Process-oriented |
| Decision-making at top | Decentralized decision-making |
| Bureaucratic | Flexible |
| Measure tasks and activities | Measure outputs and outcomes |
| Little variable pay | Pay for results |
The linkage to pay communicated the values of the new organizational form to employees.
No consistent program emerged across the thirteen firms in the Hay study. Twelve firms built the incentive pay into the annual cash bonus plan; six had long-term incentive pay linked to the scorecard, but only one of these used the scorecard linkage alone for the long-term program. About one-quarter to one-third of total direct compensation was influenced by the Balanced Scorecard approach. Eight companies had changed their pay system to increase the alignment of employees with the strategy.
All companies used financial metrics in the incentive scheme. Typically, companies used three financial measures and assigned 40 percent of the weight to the financial measures. The most common measures were net income, operating margin, and revenues, although ROCE, EVA, and revenue growth were also often used. The companies varied in the degree of stretch assigned to the financial targets: five companies used targets that were considered easily achievable, eight used stretch targets. Payouts typically started when performance reached 75 percent of the targets.
The customer measures, receiving about 15 percent to 20 percent of the weight, were, not surprisingly, “customized” to each company’s local situation and strategy. Customer satisfaction, customer retention, and new customers were the most often used metrics. Respondents reported that their internal business process metrics—typically about two measures and accounting for about 25 of the weight—were more easily quantified than their customer perspective metrics. Often the internal process metrics—such as safety, efficiency, and new product development—were used as a multiplier, to leverage the total size of the award. As with the customer metrics, companies varied a great deal in which metrics they used. The learning and growth metrics, receiving about 15 percent to 20 percent of the weight, were, like the customer metrics, quite subjective and varied across the companies. Typical metrics were information technology deployment, employee satisfaction, individual development, and diversity.
The surveyed companies reported that having a multifunctional team design and communicate the incentive program made a big difference for employee understanding and acceptance. Companies did not want the new incentive program to be viewed as an initiative led by the human resources department. Active, continual, and effective communication of the program was also viewed as critical for success. The scorecard played a central role in overcoming the largest barrier to new incentive and reward programs: disagreement about the company’s present state and performance. The scorecard made explicit the tradeoffs involved in implementing the new strategy. Finally, continual reinforcement and commitment from the CEO was critical for the success of the new incentive pay structure.
Incentive compensation is a powerful lever to gain people’s attention to company and business unit objectives. When Brian Baker first linked incentive compensation to Mobil North America Marketing and Refining’s Balanced Scorecard, his peers at the corporation chided him about how much time his people spent studying the scorecard results each month. He responded:
I think just the opposite. It’s fabulous that people spend that time. For one hour each month, all employees are taking out the scorecard and looking at the most important things in their business and whether we were winning or losing against the targets. They’re doing this to see how much money they were going to get. We would not have gotten that same focus on the scorecard, and the individual business objectives, if we hadn’t made the link to pay.
The linkage plays two important roles: It focuses employees’ attention on the measures that are most critical for the strategy, and it provides extrinsic motivation by rewarding employees when they and the organization succeed in reaching their targets. But the particular details of how to link incentive pay to compensation differs for each of the companies we studied. No one approach has emerged as preferred or dominant.
We described in Chapter 2 the three-tier compensation plan used by Mobil NAM&R. Here we expand on that description to describe how individual business units set targets for the plan.
Each business unit assigned its own percentage weights to the measures on the scorecard. These percentages determined the relative contribution of each scorecard measure to the bonus pool. The percentages, of course, had to sum to 100 across all the targeted measures. The business units chose to weight almost all of the measures on their scorecards. Only one business unit put more than a 50 percent weight on its financial measures.
The business units also established targets for each scorecard measure, along with a performance factor that represented the perceived degree of difficulty of target achievement (see Figure 10-1). The maximum index score of 1.25 occurred when the target would put the Mobil unit as best-in-class. An average target received a performance factor of 1.00, and a factor score as low as 0.70 would be applied when the target represented poor performance or was deemed very easy to achieve. While the individual business units proposed the performance factors for each measure, they had to explain and defend them in a meeting attended by several of their peers, the executive leadership team, and shared service unit heads. Collectively, this group had a great deal of knowledge about the degree of stretch in any proposed target.
Figure 10-1 Mobil NAM&R’s Metric Performance Factors
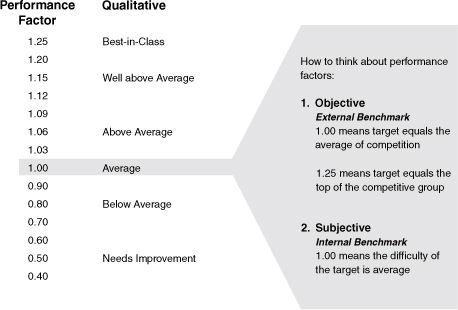
The total performance amount is calculated by multiplying the performance factor by the actual value of the measure—much the way a diving competition is scored. In a diving competition, someone who attempts an easy dive may execute it flawlessly and be awarded the top score of 10 on merit. But because the degree of difficulty was low (say, 0.8), the total amount of points awarded to the dive (8) will be low. Another competitor may try an extremely difficult dive (triple reverse with two and a half spins, with a difficulty factor of 2.8), do it satisfactorily but not perfectly (be awarded a 7.1), and yet earn a much higher total score (19.9) for the dive.
Brian Baker was a strong advocate for the indexed targets:
Historically, people were rewarded for meeting targets and penalized when they missed a target. So sandbagging targets became an art form around here. I prefer the current system where I can give a better rating to a manager who stretches for a target and falls a little short than to someone who sandbags with an easy target and then beats it. 3
Specific individuals, in shared service units, were designated to be the “metric owners.” They collected and reported the data for their assigned metric. The use of metric owners gave specific responsibility to individuals for establishing reliable processes—ones with good internal controls and validity—for reporting on Balanced Scorecard measures, a critical feature when tying the scorecard to compensation. Sharing responsibility reduced what would otherwise have been a heavy burden on a single individual to do the data collection and reporting tasks, and it exploited the expertise of specific individuals and departments for data collection.
The metric owners participated in a leveling process, for all the business units, to ensure that the targets for individual units had comparable degrees of difficulty. And by having metric owners in staff rather than line departments, there was greater independence and objectivity for the data. This point was particularly important, as large amounts of compensation would be paid, or not paid, based on the performance reported by the metric owners against the targets.
Mobil’s corporate portion of the award (the first 10 percent component) was recognized as a “below the operating profit” line in NAM&R’s reporting statement to Mobil corporate. The bonus paid to employees based on the division and business unit’s performance, therefore, was an expense charged against NAM&R’s performance. Baker himself was only compensated on the corporate and divisional financial performance. So most of the bonus his division paid to employees detracted from his personal performance metric and compensation. Nevertheless, noted Baker, “Nothing would make me happier than to pay the maximum amount to all my employees. I really believe that if we are best-in-class on all scorecard measures, the return to the company on the bonus amount I pay our employees will be repaid many times.”
The degree of alignment of individuals to the scorecard was highlighted by an incident that occurred in late 1998. Divisional headquarters received a phone call one morning from the wife of an employee who worked in the pipeline business unit. She asked whether anyone could tell her what the refinery environmental and safety indexes would be for the current month. After some investigation, someone reported back to her with the best estimates for those measures. But the headquarters people were perplexed by the phone call. Why would the wife of a pipeline employee be interested in measures about refinery operations?
Eventually, they learned that she was about to purchase a major new household appliance. She wanted to know how much she could afford to spend. She knew the formula for the bonus plan and that recent refinery performance had been falling short of target. She was curious whether a turnaround had occurred that would substantially increase the end-of-year bonus. Executives talk about the value of having all individuals aligned to the strategy. Imagine the alignment that occurs when not only the employees but also their spouses are actively discussing and trying to improve strategic performance.
Nova Scotia Power, Inc., linked 100 percent of its variable pay to the score-card. Every vice president, in a meeting with the CEO, identified which Balanced Scorecard objectives and measures were most important for the upcoming year and agreed to an incentive plan based on these measures. Each business group set three targets for the next year: threshold, midpoint, and stretch. Threshold was the minimum performance for earning a bonus. Hitting the midpoint target earned a moderate bonus, and the maximum possible bonus was earned for meeting or exceeding the stretch target.
The company used a mixture of group and individual awards. Senior management had a personal Balanced Scorecard against which a personal bonus was awarded, based on performance against the three achievement levels. Employees further down the organization tended to receive group awards, although managers had the freedom to measure people on either individual or group results, depending on the nature of the work. Most employees at Nova Scotia Power had incentive compensation plans linked to the scorecard in some way.
Gerry Isom of CIGNA Property & Casualty did not dictate a particular compensation plan. He subjectively assigned a bonus pool to each of the twenty-one business units and asked each unit to determine its own method for rewarding individuals. One unit developed an innovative Performance Share Plan (PSP) that other units all liked and subsequently adopted.4
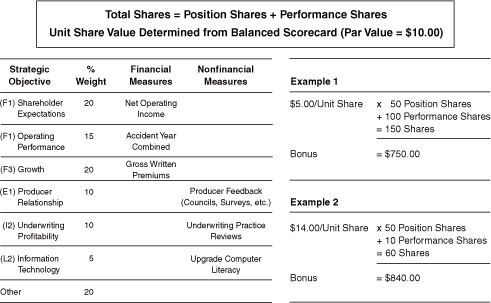
With the PSP, all employees received a fixed number of “position shares” at the beginning of each year. The number of position shares awarded depended on the individual’s job position. Throughout the year, supervisors awarded employees additional “performance shares” based on performance. All shares started out with a par value of $10 each, but at the time of pay-out, the unit recalculated the price of the shares based on its Balanced Scorecard performance. For example, one employee started the year with 50 position shares, having a par value of $10 each. During the year, she was awarded 100 performance shares, representing high individual performance. But because her business unit fell short of target for many Balanced Scorecard measures, the end-of-year price per share was $5. The employee received a bonus of $750, reflecting a strong individual performance but weak business unit performance.
Conversely, another employee at the same position level (receiving the 50 share initial endowment) performed weakly and received only 10 performance shares. But he was in a high-performance business unit whose end-of-year share price was calculated at $14. This employee received a bonus of $840 (see Figure 10-2).
The most relevant scorecard to the individual’s work—corporate, division, or business unit—determined the price for each employee’s shares. For example, the price for the shares earned by clerks working in the corporate claims processing unit was determined by the Balanced Scorecard of the business unit they supported, such as the workers’ compensation unit. Thus business unit heads received the attention and commitment not only of the people who worked directly in their department but also from people who provided service to the business unit from corporate support groups. Tom Valerio, chief transformation officer of CIGNA, noted, “It’s not a question of centralizing or decentralizing corporate staffs. It’s aligning them with the specific businesses.”
Figure 10-2 CIGNA Property & Casualty’s Incentive Compensation System
The leadership team kept raising the performance targets, and employees continued to innovate to earn the maximum score on all fourteen measures of the PSP. And the company exhibited more balanced performance, with only 40 percent of the weight assigned to the financial measures, which in the insurance industry are highly lagging indicators of the critical underwriting and claims-processing processes. Isom believes that the PSP contributed significantly to CIGNA Property & Casualty’s extraordinary turnaround: “Incentive compensation programs are all about reinforcing. If your people do a really good job on their BSC, I can’t think of a better way to reinforce their accomplishments than linking them to an incentive program. For us, the linkage has been everything.”
Winterhur International placed a great deal of weight on the reward and remuneration component of its Balanced Scorecard management system. Annually, each individual received one of four ratings based on objectives and competencies, as shown in the following list.
| Rating | Criteria for Rating |
| OS | Outstanding Performance |
| This level is achieved by few others and with no shortfalls. Objectives are exceeded; the individual may be performing regularly in situations of significantly increased responsibility, defining new standards of exceptional performance. | |
| AT | At Stretched Target |
| Performance delivers against stretched targets and may exceed some targets, with no shortfalls. This is a fully effective performer who consistently meets job requirements across accountabilities as well as the stretched objectives in the performance plan. | |
| GA | Performance Is Acceptable |
| Performance is generally acceptable and meets most objectives. Shortfalls are in noncritical areas. Some objectives are met, but definite improvements are needed. | |
| NA | Performance Is Not Yet Acceptable |
| Performance is not in line with the requirement in the performance plan and job family. This person requires a closely monitored performance improvement plan. |
Winterthur, like Mobil, established employees’ base pay at 10 percent below the median. Not Acceptable (NA) performance received no bonus, so the individual received below-median pay for the year. Acceptable (GA) performance enabled the employee to receive a 10 percent bonus, bringing total pay up to the median for that job. Stretch target (AT) performance placed the employee at the seventy-fifth percentile of pay, and outstanding (OS) performance led to pay that met or exceeded the ninetieth percentile. The awards for outstanding performance (a 35 percent bonus for middle managers and supervisors; 80 percent to more than 100 percent for members of the executive board) greatly exceeded the bonuses typically paid to European managers of any kind of enterprise, much less one in the insurance business. The executive board funding was based on the corporate Balanced Scorecard; the funding for managers and supervisors came from a budgeted pool to reward achievement of nonfinancial targets, including individuals’ performance within the job family and performance model.
As the following list shows, the weighting for the bonus was a mixture of group, business unit, and individual performance.
| Category | Group Level | Company Financial | Company Nonfinancial | Individual |
| Executive board | 20% | 30% | 20% | 30% |
| Managers/supervisors | 0 | 33% | 33% | 33% |
The group-level measures were mostly all financial and were specified by the Winterthur Group board. The company (Winterthur International) measured three or four financial and three or four nonfinancial measures. The individual measures represented up to four personal business objectives.
The particular measures used in the compensation plan evolved over time, although several measures remained the same from year to year. In any given year, they reflected the business priorities for that year. To be included, any metric had to be objectively measurable and sufficiently developed and comprehensive so that different levels of performance could be reasonably assessed across individuals. In this way, the performance awards were viewed as fair and transparent.
Texaco’s U.S. refineries could not use a formal cash incentive program because of constraints in its union contract. Outside consultants helped the company institute a “Texaco Points” program. Texaco points had a $1 par value, but they could be redeemed only for merchandise, travel, and retail awards, not for cash.
Texaco points were awarded based on plantwide results, work-group team results, and individual performance. The awards were made frequently and based on monthly, quarterly, and annual performance. In addition, supervisors could make spontaneous awards to individuals based on exceptional performance.5 The following list contains examples of the measures used in the recognition program.
| Plantwide Team | Work-Group Team | Individual |
| Safety | Throughput | Perfect attendance |
| Utilization | No unscheduled downtime | No safety (OSHA) recordable incidents |
| Expenses (excluding utilities) | Expenses | |
| Energy expenses |
In implementing the new recognition plan, Texaco Refinery and Marketing, Inc. (TRMI) managers conducted extensive in-plant orientation meetings. They also mailed to employees’ homes the brochures that described the awards that could be redeemed with Texaco points. In this way, the entire family learned about the program and participated in selecting the prizes that they would redeem with the employee’s Texaco points.
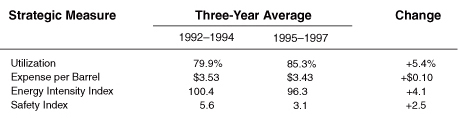
In the first year (1995) with the new plan, two plants set new records for utilization ($11 million in increased value), expense reduction (a cost reduction of $0.13 per barrel—more than $18 million saved), and safety (the number of reported incidents hazardous to EHS was reduced by 36 percent). This performance was sustained and extended in subsequent years (see Figure 10-3). The TRMI experience illustrates how a noncash reward program linked to scorecard results could be implemented even in a heavily unionized environment and at a time when the parent corporation was encountering some financial shortfalls.
Figure 10-3 Texaco Refinery and Marketing’s Business Results
Citicorp (now part of Citigroup, Inc.) was an early adopter of the Balanced Scorecard concept for its compensation plan. Like Mobil, it used a three-tier plan, but unlike Mobil, it assigned one of the tiers to individual performance. Citicorp’s three tiers were corporate, business unit, and personal performance. The business unit performance scorecard encompassed six dimensions:6
Each component of the business unit’s scorecard was scored independently into three rating categories: below par, at par, or above par. Branch managers’ bonuses were linked to the performance scorecard rating for their business unit. No bonus was awarded for an overall “below par” rating. A “par” rating generated a bonus of up to 15 percent to 20 percent of base salary, and an “above par” rating could generate a bonus of up to a 30 percent. If any of the six dimensions received a “below par” rating, the business unit could not receive an “above par” rating. This scheme provided strong incentives for managers not to underperform on any of the six performance dimensions.
UPS did not have a formal link between its Balanced Scorecard and individuals’ compensation. But this formerly privately held company had recently granted the right for all employees to purchase UPS stock.7 The Balanced Scorecard helped employees understand how their local actions contributed to the calculated company stock price. Thus, while not having the performance share linkage of the CIGNA Property & Casualty plan, the UPS plan did use a stock price calculated on Balanced Scorecard measures—for the company, financial measures plus the nonfinancial POA metrics—to motivate and reward employees’ local actions.
Even government organizations have linked incentive pay to their score-cards. For the City of Charlotte, City Manager Pam Syfert initiated a gain-sharing program in 1996 to motivate efficiency among city employees. A citizen’s advisory group, consisting of human resources professionals from the city’s major private sector employers, had requested this program. The program paid up to $600 per person, about two weeks’ pay for lower-paid employees, based on two components. The first, worth $300 per employee, would be paid if the city achieved targeted budget savings of, say, $ 3 million. This savings could be accomplished by doing the required work with fewer than budgeted people and by savings from the privatization program. The second component was based on achieving selected local objectives from the unit’s Balanced Scorecard. The city’s HR department reviewed and approved each business unit’s objectives and goals to validate that the targets were sufficiently challenging. As the city became more experienced with the incentive plan and the measurability of the key objectives, Syfert hoped to expand the amount of money that could be awarded under this incentive program.
The only generalizable finding from all of the company experiences in linking compensation and reward to Balanced Scorecards is that they do it. We have yet to encounter an organization, well along with its Balanced Scorecard implementation, that either has not or does not intend to tie incentive compensation to achievement of targets for Balanced Scorecard measures. Some companies had yet to make the link to incentive compensation, but the reasons related to lack of readiness, not opposition to the concept.
Several design issues arise when tying compensation to the Balanced Scorecard:
 Speed of implementation
Objective versus subjective measures
Team versus individual
Frequency of updates
It is reasonable for companies to be cautious in tying compensation to the scorecard. In fact, we have been somewhat surprised about how quickly most companies have moved to the linkage. This may say more about the dysfunctionality of the companies’ previous incentive compensation system than about the desirability of rapid deployment of a Balanced Score-card incentive system.
One reason for deferring the link to compensation for six to twelve months is that the initial scorecard represents only a tentative statement of the unit’s strategy. The scorecard expresses hypotheses about the cause-and-effect relationships among the measures for creating superior, long-run financial performance. As they translate strategy into measures, executives formulate hypotheses about the linkages among the measures. They may not be completely confident that they have chosen the right measures. So they may be naturally reluctant to expose the initial measures to the efforts by highly motivated (and compensated) executives to achieve maximal scores on the selected measures.
For example, one of Mobil’s initial revenue growth measures was a year-to-year increase in gasoline volume relative to the industry growth rate. With all the attention devoted to this measure, Mobil achieved its first-year target. Executives, however, didn’t feel as successful as they thought they would with the achievement. Subsequent reflection and discussion revealed that their market segmentation strategy was intended to increase the percentage of sales in the premium grades, rather than in the more commoditylike regular product. So in the second year, the measure was modified to emphasize growth in sales of the higher-margin premium grades of gasoline, distillates, and lubricants.
A second reason for delay is that companies may not have good, reliable data for many of the measures at the early stages of their program. Companies’ initial Balanced Scorecards often have several missing measurements, typically in the customer and learning and growth perspectives. Companies have to develop new processes that will generate the data for these new measures. Operating an “unbalanced” compensation scheme during the initial year, with the more objective and reliable data from the financial and internal business process perspectives, may send the wrong initial message to employees: “We can’t measure what we want, so we have decided to want what we can measure.”
A third reason for the delay is that unintended or unexpected consequences could result from how the targets for the measures are achieved. This concern arises when the initial Balanced Scorecard measures are not perfect surrogates for the strategic objectives, and when the actions that improve the short-term measured results may be inconsistent with achieving the long-term objectives. Executives may wish to see how managers achieve performance targets in scorecard measures to assess the likelihood of how easily the system can be distorted. CIGNA’s Gerry Isom, who was among the fastest to tie incentive pay to his organization’s new scorecards, made it known to everyone that he was prepared to override the reward tied to any measure if he felt that the underlying process had been manipulated or not managed well.
Several executives stressed to us the importance of having compensation-based measures be more objective and outcome-based, rather than being measures of tasks and activities. For example, they don’t want to reward the completion of initiatives and projects on time or to count the number of visits or phone calls made. They want compensation tied to the outcomes from these efforts: new customers signed up, number of new products and services sold to existing customers, and sales from new products. As another example of problems with subjective measures, many organizations tie commissions and compensation to a customer satisfaction measure. This often leads to dysfunctional behavior when salespeople and others with direct customer contact coach customers about how to respond to surveys or posttransaction third-party interviews. It is preferable to measure customers’ actual behavior—repeat purchases, purchases of new products and services, and referrals to new customers—not their attitudes.
Another design issue is how many measures should be in the compensation plan. Many executives want the compensation plan to be simple—say, no more than four to seven measures—feeling that employees cannot understand a system with upwards of two dozen measures. Often companies do use only a subset of their scorecard (the Super Bowl approach described in Chapter 9) for this reason, to increase focus and reduce confusion. But we are also impressed with Mobil’s success in having employees understand and influence more than two dozen measures on both their business unit and divisional scorecards. A well-constructed strategy scorecard will not be as confusing as an ad hoc collection of two dozen metrics such as might arise from a stakeholder or KPI scorecard. The metrics derived from an integrated strategy map (see Chapter 3) should reflect a single strategy with only two or three strategic themes (e.g., revenue growth, cost reduction, and asset intensity). Employees can picture the cause-and-effect linkages that integrate the different performance driver and outcome measures.
Individual versus team metrics involve managing several tradeoffs and tensions. Mobil adopted a system that had no individual rewards, whereas several other companies (CIGNA, Winterthur, and Citicorp) used a mixture of organizational and individual rewards. Team-based rewards encourage cooperative behavior and group problem-solving. They encourage employees to identify issues and suggest solutions outside their normal, day-to-day responsibilities. On the other hand, team and organizational rewards can lead to what economists call the “free-rider problem,” whereby individuals do not get the full benefit from their own initiatives and actions and can benefit from the good ideas and hard work of others. So they have some incentive to slack off and ride on the coattails (the source of the free-rider problem) of their coworkers.
The free-rider problem can often be mitigated in environments of high-visibility, where many people can observe and evaluate the effort and contributions of individuals. When sanctions other than pay can be deployed, the consequences of the free-rider problem can be minimized. In such circumstances, organizations get to enjoy the benefits from group problemsolving and having employees contribute suggestions to influence outcomes outside their day-to-day responsibilities and accountabilities, without paying a free-rider penalty.
On the other hand, such tasks as personal selling or breakthrough product innovation may require individual dedication and brilliance. In such settings, organizations may sensibly wish to provide explicit incentives that reward successful outcomes.
Some scholars advocate weakening the relationship between performance and individual pay. Jeffrey Pfeffer of Stanford Business School wants to deemphasize individual performance-related pay and shift more of the compensation, as Mobil has done, to organizational performance.8 This shift acknowledges how organizational performance today increasingly depends on the consequences of collective behavior and performance. Several empirical studies indicate that the economists’ free-rider problem could be less serious than purported, that individuals may be more influenced by peer pressures and social relationships than by individual merit pay. Pfeffer and others emphasize that many high-performing organizations motivate people by providing a fun place to work, excellent interactions with colleagues, clear statements of mission and purpose, and the freedom to act in ways that will make a difference.
Clearly, the Balanced Scorecard can be used to give a sense of overall purpose and mission, as many organizational behavior scholars advocate. And it can provide the measurement system for collective, organizational performance. Just how to choose the appropriate mix between group and individual rewards will be the subject of ongoing debate and mixed evidence. We don’t know of good rules on how to manage these tensions and tradeoffs. We would expect some companies, such as CIGNA with its Performance Share Plan, to attempt to get the benefits from individual and collective actions by using a mixture of individual and group rewards. Others, such as Mobil, will choose to foster teamwork and collective responsibility by using only group rewards.
An explicit, formula-based compensation plan tied to many nonfinancial measures from a Balanced Scorecard runs a risk of inflexibility. Consider companies operating in Internet time, where tactics and action plans may have to change rapidly owing to technological innovation, unexpected competitor initiatives, new competitors, and shifts in consumer preferences. While the basic strategy of these companies—attract new customers in targeted segments, deepen and broaden relationships with existing customers, reduce cost to serve—may not change, the value proposition, internal processes, critical skills, and information technology required to implement the strategy may have to undergo frequent updates. If a compensation system gets tied to nonfinancial metrics based on a now-obsolete set of processes, companies can find it difficult to execute frequent mid-course changes.
The issue of midyear changes in a Balanced Scorecard did not arise in our initial set of adopting companies—integrated petroleum companies, retail banks, construction companies, and insurance companies. The competitive environment for these companies was not subject to rapid change and obsolescence, so the strategy and the tactics for implementing the strategy varied slowly from year to year. Companies, however, that anticipate frequent within-year changes may wish not to link their incentive pay to a multitude of Balanced Scorecard measures in the four perspectives. Such a tight linkage will constrain rapid adaptation, because many people will have committed to actions based on the compensation plan derived from the previous strategy.
Companies in rapidly changing environments can base their incentive pay on customer outcomes and long-run financial performance, such as stock price or EVA over a three- to five-year period. In this way, their reward system is focused on long-term value creation, and they retain the option of modifying their Balanced Scorecard measures, particularly the performance drivers and leading indicators, without having to adjust their compensation plan. Used in this way, the Balanced Scorecard retains its powerful role for communication and alignment, as discussed in earlier chapters. And by not tying the scorecard too closely to compensation, the companies have the freedom to adapt the scorecard quickly to new circumstances.
All of the companies we studied either made or were planning to make explicit linkages between the Balanced Scorecard and incentive pay. Often the incentive pay plans extended for the first time down to the front lines and back offices of the organization. The details of plans varied across companies. Some used team and organizational-unit rewards only; others used a mixture of individual and organizational rewards. Many organizations used several layers of incentives to reward performance at the corporate, division, business unit, and individual/team performance levels. Because of the attention given to incentive pay plans, managers must avoid the dangers of introducing plans too quickly, before good measures have been determined and good data for the measures are available. When all individuals understand how their pay is linked to achieving strategic objectives, however, strategy truly becomes everyone’s everyday job.
1. “Rewarding Employees: Balanced Scorecard Fax-Back Survey Result,” William M. Mercer & Co., London, 20 May 1999.
2. Experience reported in M.A. Thompson, “Using Strategic Rewards as a Cornerstone of the Balanced Scorecard” (paper presented at the Balanced Score-card Collaborative Best Practices Conference, Making Strategy Everyone’s Job: Using the Balanced Scorecard to Align the Workforce, Cambridge, MA, 22-23 June 1999). Hay Group research conducted by Todd Manas and Michael Jensen.
3. R. S. Kaplan, “Mobil USM&R (A): Linking the Balanced Scorecard,” 9-197-025 (Boston: Harvard Business School, 1996), 9.
4. The CIGNA plan was initially reported in B. Birchard, “Closing the Strategy Gap,” CFO Magazine (October 1996).
5. TRMI tracked how many spontaneous awards each supervisor made. It discovered that it had to coach and counsel several supervisors who found it difficult to reinforce good behavior or to learn how to say “thank you” to their employees, which is not always a native skill for oil refinery supervisors.
6. See R. Simons and A. Davila, “Citbank: Performance Evaluation,” 9-198-048 (Boston: Harvard Business School, 1997).
7. UPS became a public company in November 1999. At that point, the value of employees’ stock holdings was determined by an active public market rather than an internal formula.
8. J. Pfeffer, “Six Dangerous Myths about Pay,” Harvard Business Review (May-June 1998): 109-19.