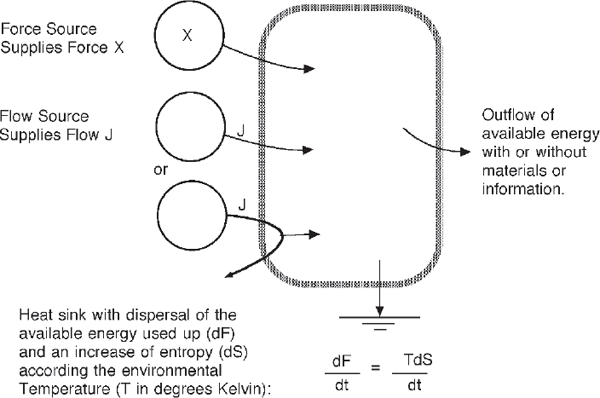
THE BEHAVIOR of each of the energy system modules was described with definitions of symbols in fig. 2.10. For each module there are equations that describe the operation of the module in its simplest form, that is, when it has no special complications because of its sources and links to other units. The equations implied by the systems symbols will remind various scientific and engineering readers of familiar equations in their fields and help connect their knowledge to the symbols. More complete discussion of each symbol is given elsewhere in relation to energy and systems concepts (Odum 1983).
SOURCE (FIG. 2.10A)
Figure A1 has two main kinds of sources, one that delivers a force and one that delivers a flow. The following are some of the appropriate equations:

FIGURE A.1 Frequently used sources and sinks.
X= k Force constant
J=k Flow constant
X = kt Force as ramp
J=kt Flow as ramp
X = sin kt Sine function
STORAGE (FIG. 2.10B)
Figure A2 shows the storage process and ways it is represented in several systems languages when input is a constant flow J. It can be called a Von Bertalanffy module, after the author who made its equation the center of general systems theory (Von Bertalanffy 1968). The outflow path combines second law dispersal and outflow of usable energy. With a constant source there is exponential asymptotic growth, called a first-order process in engineering.
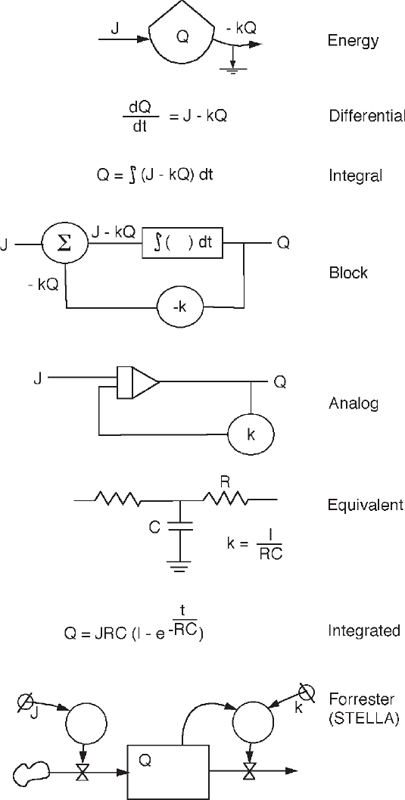
FIGURE A.2 Simple storage (tank symbol, the Von Bertalanffy module) expressed in several ways (fig. 2.10b).
Figure A3 shows the rate at which potential energy is generated and stored (power) and its efficiency of energy transformation e as a function of the backforce loading X2 described in figs. 3.1 and 3.2b. The available energy dispersed to the environment, with its entropy increase, is the difference between useful power input minus the useful power transformed and restored. The derivation starts with an expression for the power of output storing potential energy, with one term for the effect of the driving force and one for the effect of the backforce from the storage. Coefficients are simplified by consideration of the special case when forces are equal and the system is stalled and by the coupling principle (Onsager’s principle) that the effect of one force on a second flow equals the effect of the second force on the flow of the first. The loading ratio Z is substituted to obtain power output as a function of loading, and the input power is held constant. An expression for maximum power was found by setting the derivative to zero. When loaded for maximum power storage at steady state, the ratio of output to input force and efficiency is 50% minus the energy losses due to second law dispersal, represented by f in the equations.
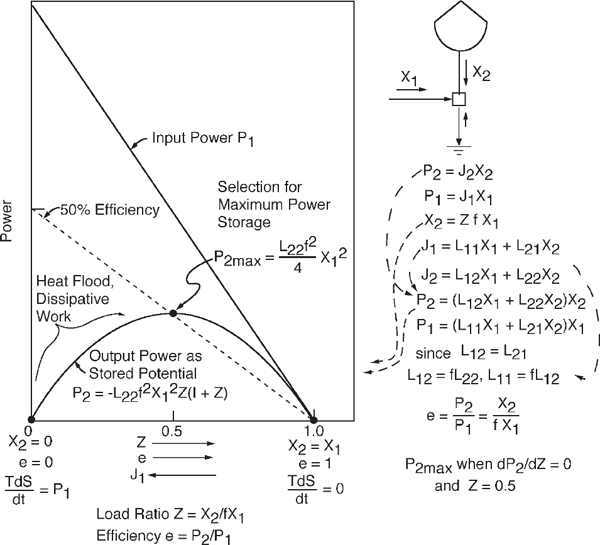
FIGURE A.3 Relationship of power to loading and efficiency of an energy transformation that stores potential energy when the input force X1 is constant (Odum 1983; Odum and Pinkerton 1955). See fig. 3.2.
However, most transformations in the real world, if not all, also involve a hierarchical concentration that requires additional available energy to be used. Thus, the equations in fig. A3 represent an upper limit to efficiency that is possible when energy transformations are selected for maximum power. A more complete explanation of the derivation was given in our original article (Odum and Pinkerton 1955).
Using the equations in fig. A3, fig. A4 relates power and efficiency of potential energy storage when the backforce loading X2 is constant but the input force X1 varies, as in devices that receive solar energy.

FIGURE A.4 Relationship of power and efficiency of an energy transformation that stores potential energy when the output load (backforce X2) is constant but the input force is varied. See equations in fig. A3 and examples in figs. 3.3c and 3.5.
HEAT SINK (FIG. 2.10C)
The heat sink module (fig. 2.10c) represents the dispersal of available energy accompanied by an increase in entropy S. Heat sink equations relate the dispersing heat Q to the loss of available potential energy F and to the rate of entropy change S, where T is the sink temperature on the Kelvin scale.
dF/dt = dQ/dt = TdS/dt
MISCELLANEOUS BOX (FIG. 2.10D)
No equations are implied until details are diagrammed with other symbols in the box.
INTERACTION (FIG. 2.10E)
The interaction module in its simplest form has a production output that is the product of the local input forces at the site. Figure A5 explains the output of an interaction module as a function of a varying input force X1 when one of the input forces is supplied by a local storage X2 that becomes limiting because it is supplied by a constant, limiting flow J.
CYCLING RECEPTOR (FIG. 2.10F)
Figure A6 shows the production output of the cycling receptor module, in which energy transformation is limited by the quantity of material recycling within the module. The relationship sometimes is called the Michaelis–Menten equation, after the first application to a biochemical processes in which the enzyme was recycling (Michaelis and Menten 1913). This module can receive pure energy flows (without materials). In photovoltaic cells electrons recycle as part of the energy transformations of incoming light.
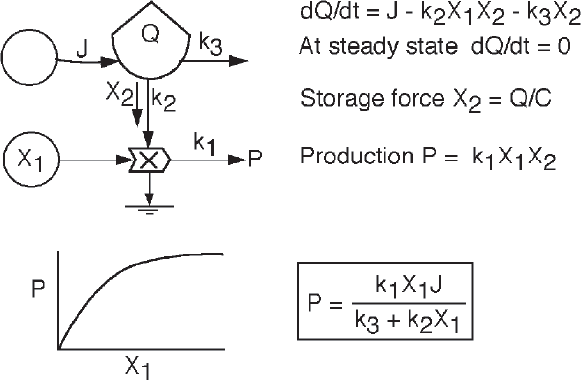
FIGURE A.5 Performance characteristics of a productive interaction (work gate) symbol (fig. 2.10e) when one of the input flows J affecting the local available energy Q is constant and becomes a limit when the other force X1 increases.
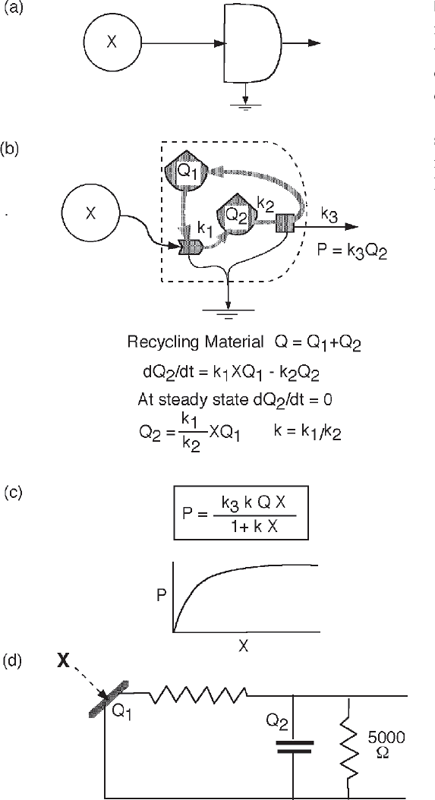
FIGURE A.6 Properties of the cycling receptor module (fig. 2.10f) with energy transformations that use an internal cycle of materials to interact with the input energy source. (a) Summarizing symbol; (b) component pathways and relationships; (c) output response with varying input intensity; (d) passive electrical analog circuit using a photovoltaic cell.
PRODUCER (FIG. 2.10G) AND CONSUMER (FIG. 2.10I)
Figure A7 shows the response of autocatalytic configurations of self-maintaining units such as producers and consumers. In fig. A7a, with a constant force source (energy unlimited), the growth is exponential. In fig. A7b, with a constant flow source, the growth is S-shaped. In fig. A7c, S-shaped growth results in a logistic equation when there is a recycling material that becomes limiting even though the input force is maintained constant. In fig. A7d, S-shaped growth results when there is backforce from the storage.

FIGURE A.7 Autocatalytic configuration often implied within a producer symbol (fig. 2.10g) and the consumer symbol (fig. 2.6i). (a) Exponential growth when the source is constant (constant force with unlimited energy); (b) S-shaped or logistic growth when the source is limited to a constant flow (J = constant) at the source; (c) logistic growth when there is constant input force, but the quantity of necessary recycling material is limited; (d) logistic growth when there is a backforce and a constant input force.
GREEN PLANT PRODUCER (FIG. 2.10H)
The combination of modules from a cycling receptor and one or more self-maintenance modules forms a system that combines the separate equations.
SWITCH (FIG. 2.10J)
This module refers to any action that has on or off positions controlled by some code of input combinations that are above or below thresholds according to the various combinations of digital logic, which must be specified for full description (e.g., “AND,” “OR,” “NAND,” “NOR,” “XOR”).
EXCHANGE (FIG. 2.10K)
This module refers to countercurrent control where J1 is a flow of commodities, goods, or services, J2 is money flow, and p is price. J1 can be in any units.
J2 = pJ1.
Price may be determined from outside markets. On the other hand, in a large system the price may be the variable determined by the ratio J2/Jr
CONSTANT GAIN AMPLIFIER (FIG. 2.10L)
This module has the same function used in electrical engineering for operational amplifiers, except as used here there is no automatic change in algebraic sign between input from the left X and transformed output P.
P = GX, where G is the gain.
The module applies only when energy flow for the amplification (gain) J can be drawn from an unlimited source through the upper pathway:
J = kGX
ACTIVE IMPEDANCE (FIG. 2.10M)
This module in its simplest form has the response characteristics of an electrical inductance (see texts on electrical engineering). Backforce is proportional to acceleration.
ONE-WAY VALVE (FIG. 2.10N)
This module has the response characteristics of an electrical diode with flow proportional to force, with backforces expressed but no backflow.
ADDING JUNCTION (FIG. 2.10O)
Two flows of the same kind join, and the output flow is the sum of the inputs. If the two flows are of different kind, then they interact, and the module in fig. 2.10e applies.
SPLIT (FIG. 2.10p)
One flow divides into two flows of the same kind. The sum of the outputs equals the input. If the outputs are of different kind, then the outputs are co-products, and the box symbol in fig. 2.10d or the interaction in fig. 2.10e applies.
EQUATIONS FOR ECOSYSTEM MINIMODELS
The computer simulations of growth in storage as a function of time in figs. A1, A5, A6, and A7 are given in Odum and Odum (2000), which includes the programs on a CD-ROM.
The minimodel in appendix fig. A8 simulates the coupled processes of production and respiration in four languages, as discussed in chapter 2.
The minimodel PIONINFO in fig. A9 simulates the changes in diversity accompanying cyclic succession, climax, pulsed consumption, and restart (Odum 1999) discussed in chapter 6 (fig. 6.14).
The minimodel PULSE in fig. A10 (Odum and Odum 2000) simulates the repeating oscillation of growth, pulsed consumption, and recycle discussed in chapter 3 (fig. 3.13).
The minimodel CLIMAX in fig. A11 simulates succession, discussed in chapter 6 (fig. 6.12).
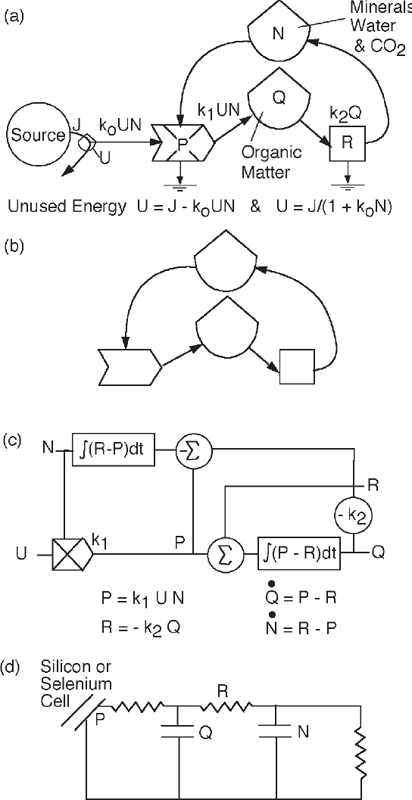
FIGURE A.8 Diagrams of the production (P) and respiration (R) system in 4 languages: the symbiotic relationship of photosynthetic production and total system respiration in the biosphere (or other closed-to-matter system). (a) Energy network diagram; (b) mineral cycle diagram; (c) differential equations diagrammed for operational analog simulation; (d) equivalent circuit (passive electrical analog language) (see fig. 2.4).

FIGURE A.9 Details and equations for the simulation model PIONINFO (Odum 1999) discussed in fig. 6.14. The model simulates repeating succession, with pioneers appearing first, replaced with main biomass structure, leading to climax diversity, a surge of consumption, and regrowth again.
FIGURE A.10 Details and equations for the simulation model called PULSE (Odum and Odum 2000) discussed in fig. 3.13. The model simulates the repeated cycle of product accumulation alternating with frenzied surges of consumers.

FIGURE A.11 Details and equations for the simulation model CLIMAX (Odum and Odum 2000) discussed in fig. 6.12. The model simulates growth of a system that first generates net production and biomass and uses its structure and seeding of species to develop diversity that reinforces gross production.
REFERENCES
Michaelis, L. and M. L. Menten. 1913. Die Kinetik der Invertinwirkung. Biochemische Zeitschrift, 49: 333–369.
Odum, H. T. 1983. Systems Ecology, an Introduction. New York: Wiley. 1994. Reprinted as Ecological and General Systems. Boulder: University Press of Colorado.
Odum, H. T. 1999. Limits of information and biodiversity. In H. Loeffler and E. W. Streissler, eds., Sozialpolitik und Okologieprobleme der Zerkunft, 229–269. Vienna: Austrian Academy of Sciences.
Odum, H. T. and E. C. Odum. 2000. Modeling for All Scales, an Introduction to Simulation. San Diego, CA: Academic Press.
Odum, H. T. and R. C. Pinkerton. 1955. Time’s speed regulator, the optimum efficiency for maximum power. American Scientist, 43: 31–343.
Von Bertalanffy, L. 1968. General Systems Theory. New York: Brazilier.