SYSTEMS DEPEND on power, which they use to develop structure and functions that self-organize according to laws of energy transformation and use. As suggested by Alfred Lotka in 1922, maximum power results from self-organization according to the natural selection of systems designs. This chapter explains energy laws, including the maximum power principle and its control of production, growth, competition, succession, energy storage, diversity, and the oscillatory pulsing of all systems.
POWER
In human affairs the word power often refers to the effectiveness of action or the capability of action. Great military power implies large military bodies involving many people and machines and exerting a directing force over large areas. Great political power suggests command of large numbers of votes and a wide influence on government systems and on the actions of many people. Great economic power implies control of large amounts of money and of influences that can be bought with volume spending. Almost everyone understands in a qualitative way what power means in human affairs, but few equate general concepts of power with scientific measures.
In science and engineering, power is defined precisely in terms of measurable units as the rate of flow of useful energy. Scientific definitions of energy and power are quantitative. Energy can be measured in such units as the calorie, the joule, the British thermal unit (Btu), and the erg. The flow of energy (power) is a rate measured in time units such as calories per day, watts (joules per second), or horsepower (l hp = 10.688 kilocalories (kcal)/min; 1 Btu = 0.252 kcal; 1 kcal = 4,186 joules).
The ability of a machine to accomplish a function is determined by its power rating, with a large number indicating a large role. For example, the functions provided by an air conditioner, a heating system, or a locomotive are described by their power deliveries. Although nearly everyone is familiar with power ratings of household appliances and automobiles, our educational system has rarely emphasized that the affairs of people also have quantitative power ratings and that the important issues of human existence and survival are as fully regulated by the laws of energetics as are the machines. It is possible to put calories-per-day values on human institutions, on the flows of energy in cities, on the power needs and delivery of activities of nations, or on the relative influences exerted by humans and their environmental systems. However, different kinds of energy and power are not comparable in their abilities to do work until they are put on a common basis as empower (chapter 4).
Most people think that society has progressed in the modern industrial era because human knowledge and ingenuity have no limits, a dangerous partial truth. Twentieth-century progress was power enriched. Progress evaporates whenever and wherever power is limited. Knowledge and ingenuity are the means for applying power subsidies when they are available, and the development and retention of knowledge also depend on power (chapter 9).
HEAT AND THE PRINCIPLE OF ENERGY DEGRADATION
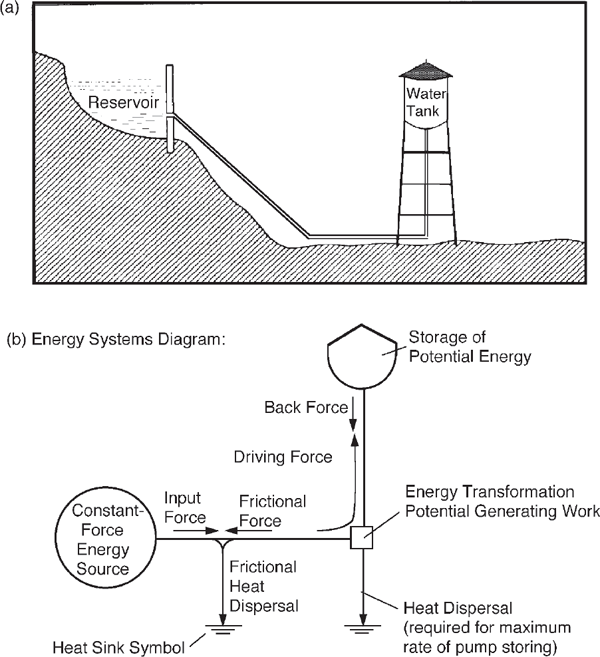
The most important reality about energy flow is the principle of energy degradation, illustrated by the heat sinks in energy flow diagrams. In fig. 3.1a water in the mountains contains potential energy, which drives flow and the work of pumping water into the tank. For any process, some of the available potential energy must be dispersed along the way as unusable heat. In other words, the potential energy of water in the mountains can be connected to some process if the arrangement allows part of this potential energy to go to waste in the form of useless dispersed heat. In textbooks on energetics this principle is called the second law of thermodynamics. A general waste dispersal is shown with the heat sink symbols. In terms of further use, the energy has gone “down the drain” as heat. Potential energy is also called available energy.
Heat is the state of energy consisting of the random motions and vibrations of the molecules. An object is hot when its molecules have increased vibration and motion. These motions tend to spread from a hot body to a cooler one by random wandering and bumping that transfers and disperses the energies of these motions. It is this random dispersal that ultimately is responsible for spontaneous energy transformations. The wandering pulls other processes coupled to it. Energy can flow only if some of it is dispersed by heat flow into the sink. Without such energy dispersal, the downstream energy storages would push back with as much force as the upstream source. If we try to arrange an energy flow to operate so that the heat drain is eliminated, the process simply will not work. The heat drain sometimes is called the energy tax necessary for operation.
The energy that goes to the sink is not actually destroyed as energy but ends up as the speeding, bouncing, shaking velocities of billions of molecules, each going in a different direction. This motion is disorganized, however, and cannot be harnessed except when one object has more of this energy than another next to it. If the energy that flows down the heat tax drain (fig. 3.1b) is evenly dispersed in the environment as random heat energy, it can be said to be lost as potential energy, although it still exists as molecular motion.
FIGURE 3.1 Example of an energy flow (power circuit) from a source through pathways that have frictional backforces to a point where there is a storage of the energy, doing work against potential generating backforces. (a) Schematic picture of water system from the mountains, with energy being restored (“pump storage”); (b) energy network diagram using symbols defined in fig. 2.10.
The first law of energetics states that energy in processes not involving inter-conversion of energy and matter is neither created nor destroyed. It is conserved. Thus, in fig. 3.1 all the calories flowing in from the potential energy source on the left must be accounted for in the storage and two outflows. However, the second law states that the potential energy, which is the energy available to carry out additional processes, is used up. It is degraded from a form of energy capable of driving phenomena into a form that is not capable of doing so. In recent years the available potential energy has been called exergy.
Thus we may restate energy laws: Energy is neither created nor destroyed, but in any real process the availability of potential energy is lost. In our culture these ideas are implied in some favorite expressions of our common sense: “You can’t get something for nothing,” and “Perpetual motion is impossible.”
Absence of Heat, Third Energy Law
If something has no heat, then its atoms and molecules are at rest, with no motion. This condition is called absolute zero, and the Kelvin scale of temperature has absolute zero as its lowest value. (On the Celsius–centigrade scale absolute zero is –273 degrees). No place has been found that is this cold. In the depths of space of the universe the temperature of matter is about 3 degrees Kelvin. In chapter 7 of this book are measures of complexity. One of these, entropy, measures the complexity of molecular states, which depend on the heat content. Where there is no heat, the molecules fall into simple arrangements like crystals. As a third energy law, it is said that the entropy at absolute zero is zero.
The One-Way Direction of Power Delivery
Because of the power drain needed for a process to function, any operation involves a one-way processing of energy with the availability of the potential energy lost as the energy is dispersed into unavailable form. Thus, any procedure is unidirectional, and use and reuse of potential energy are not possible in the processes on Earth.1 The unidirectional nature of energy processes is reflected in such common expressions as “Time and tide wait for no man” and “Use it or lose it.”
What Fraction of the Power Goes Down the Heat Sink?
What fraction of the power flow must go down the compulsory tax drain? What law governs the quantity of this loss? Let us consider the arrangements of weights in the Atwoods machine in fig. 3.2, where weights falling on the left raise them on the right. The falling of a weight is an inflow of power from the potential energy of the weight’s high starting position. The energy contributed is a product of the mass of the weight times the velocity of the weight. The raising of a weight is a flow of power into potential energy storage as the weight is lifted. The falling weight does the work of lifting the other weight. The ratio of energy stored to the energy input used is called the efficiency.
When the weights are equal, the system, if it operated, would convert all its potential energy inflow into useful, reusable, stored potential energy. The efficiency of this arrangement is 100%. However, for such an arrangement to result in motion and energy transfer is contrary to the principle of energy degradation (second law). Common sense also tells us that the two weights, being balanced, remain still, and nothing happens. Situations with balanced forces of opposing energy storages are said to be reversible.
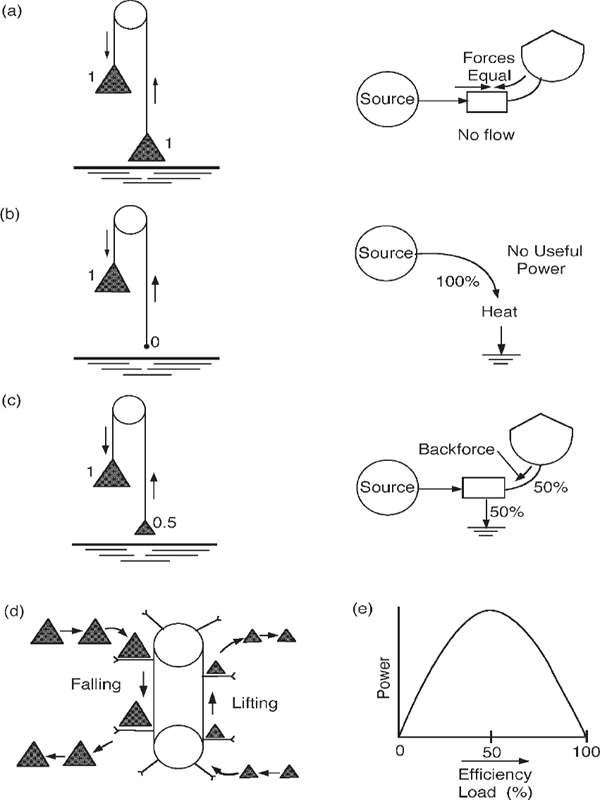
FIGURE 3.2 Atwoods machine: The fall of one weight supplies the force to raise another. Diagrams of energy transformations with 3 different conditions of loading of input and output weights. Energy flow diagrams are shown for each. (a) Reversible stall when backforce and input forces are equal; there is no flow, no power delivery. As the loading approaches the stall, efficiency approaches 100%. (b) With no load, there is a free drop at maximum speed, discharging heat to the ground. There is no output power for load-lifting work. (c) Maximum rate of power storage with intermediate loading. (d) Arrangement for a series of weights dropping and lifting in steady state. (e) Useful output power as a function of the load and efficiency based on equations in appendix A3 from Odum and Pinkerton (1955).
In the middle diagram (fig. 3.2b), the weight on the right is zero. Now the weight on the left can drop without drag from any weight on the right. The potential energy stored in the weight flows rapidly out of its storage state into the kinetic energy of the falling weight. When the weight stops at the bottom, all the concentrated energy of the falling object goes into heating the object and the surface it hits. Very shortly, that heat is dispersed evenly in the environment in the invisible motions of the molecules. Because there was no weight on the right-hand side, all the potential energy went into the heat drain and none into the useful storage process of elevating a weight. The process in fig. 3.2b is thus very fast, dispersing all the potential energy and storing none because it does not lift a weight.
Figure 3.2c is an intermediate arrangement. The weight on the left is about twice that on the right. In this example the weight on the left falls slowly, and part of the energy is stored as available and useful potential energy for further processes. The rest of the energy is dispersed into the heat drain, unavailable for further work. The loading arrangement in fig. 3.2c is the optimum one for processing the greatest amount of useful power in lifting work. If the loading weight is greater than one-half, the process of storage is slower; any loading weight that is less wastes too much in the heat drain.
If one weight falls, the efficiency of energy transfer is about 63%. With the arrangement in fig. 3.2d, a series of weights fall one after another in a kind of steady state, dragging a belt that raises weights one after another on the other side. For a steady state arrangement the optimum efficiency that maximizes the output work is 50%. Figure 3.2d summarizes the relationship of output power and efficiency of transfer.2
MAXIMUM POWER, DARWIN, LOTKA ENERGY LAW, AND FOURTH ENERGY LAW
Whenever it is necessary to transform and restore the greatest amount of energy at the fastest possible rate, 50% of it must go into the drain (Odum and Pinkerton 1955). Nature and society both have energy storages as part of their operations, and when power storage is important, it is maximized by adjusting loads, as demonstrated in fig. 3.2. In the 19th century Darwin popularized the concept of natural selection, and early in the 20th century Lotka (1922) indicated that the maximization of power for useful purposes was the criterion for natural selection.3 Darwin’s evolutionary law that applied to organisms thus developed into a general energy law that applied also to selection of design relationships. In other words, systems that prevail are those with loading adjusted to operate at the peak of the power efficiency curve of fig. 3.2e. During self-organization, these systems reinforce (choose) pathways with the optimum load for maximum output.
Power Transformation for Varying Energy Sources
The explanation of the effect of load on efficiency in fig. 3.2 considered situations in which the potential energy available from the source was constant. However, in many situations the available source of energy varies, but the loading of the energy-using system is set to be useful on the average. In this case the efficiency is inverse to the energy concentration. As the energy availability increases, the efficiency decreases, as shown in appendix fig. A4.
Photosynthetic Production and Varying Sunlight
The sunlight energizing the biosphere and society varies daily, seasonally, and annually. Plants have adapted by developing green chlorophyll structures to receive this energy and transform it into growth and other useful work.
In the first step of photosynthesis, photons separate electrons from organic structure, which gains a plus charge as a result. In other words, the green pigmented structures of plants are natural photovoltaic cells. As shown in fig. 3.3a, the plus charges of most plants interact with water to make oxygen, and the minus charges drive the load of organic production biochemistry.
In laboratory biophysical research, the output of isolated chloroplasts was measured for different reaction loads. The result was the power–efficiency curve in fig. 3.3b, quite like the theoretical curve in fig. 3.2e. In other words, there is a thermodynamic optimum efficiency for maximum production at intermediate light.
If the load is constant but the input energy is varied, fig. 3.3c results. The efficiency decreases with increasing input power. As predicted from the equations (appendix figs. A3, A4), the efficiency is inverse to the light intensity (fig. 3.3c).
Given a longer time, plants adapt to light levels by adding or decreasing the chlorophyll so as to maximize the energy conversion. Ireland and Oregon are dark green in winter because oceanic clouds shade the light, so plants need more chlorophyll to catch enough energy from the scarce light.
Photoelectric Ecosystem
In very shallow (10 cm [2.5 inches] deep or less) fertile waters, temperatures, dissolved oxygen, and acidity (pH) have wide diurnal ranges to which most plants are not adapted. A carpet of matted blue-green algae develops, often with brilliant color in summer sunlight. The ecosystem develops a 0.5-volt difference between the positively charged upper surface and negative charges under the mat. The steep voltage drop pulls negatively charged nutrients released by respiration under the mat up to the photosynthesizing algae. The properties of this photoelectric ecosystem were studied by transferring cores of the algae mats to tubes (fig. 3.4a), which delivered electric power in response to changing load, not unlike a silicon photovoltaic cell (appendix fig. A6). The parabolic curve of power output is another example of the inverse power efficiency principle that guides the adaptation to solar energy.
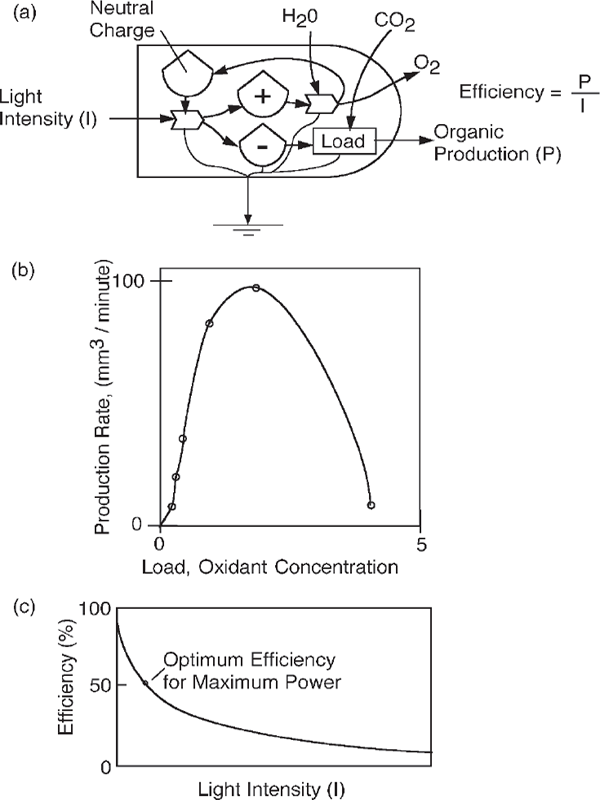
FIGURE 3.3 Efficiency of plant cells using chlorophyll to transform solar energy into organic matter. (a) Energy systems diagram showing the first step, a photovoltaic process receiving light photons; (b) efficiency of light transformation where light intensity is constant and physiological load is varied (Clendenning and Ehrmantraut 1950); (c) photosynthetic efficiency as a function of varying light intensity using equations in appendix fig. A4.
Tropical Forest
The principle that efficiency of photosynthetic production decreases with light intensity applies to large ecosystems as well as to isolated chloroplasts and algal mats. Recent studies measure the photosynthetic production of landscapes from the rate of turbulent exchange of carbon dioxide eddying down from the atmosphere into the ecosystems. Figure 3.5 is a graph of photosynthetic efficiency as a function of light intensity in an area of tropical forest measured with this free air method (Ryan 1990).
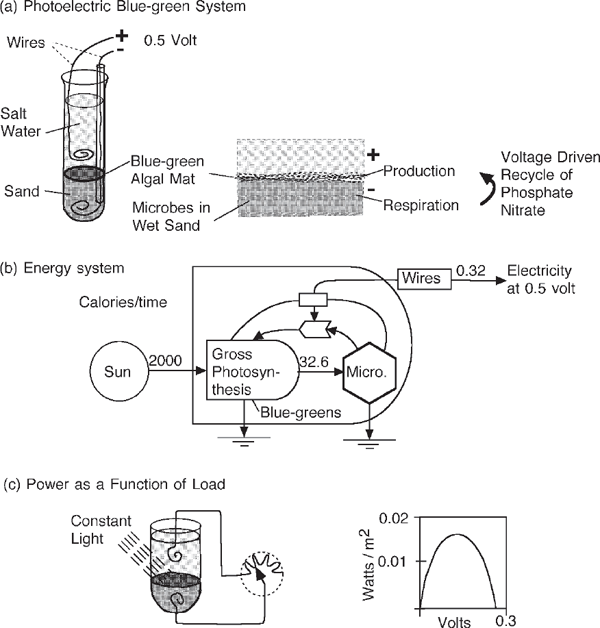
FIGURE 3.4 Blue-green mat ecosystem and its photoelectric characteristics. (a) Blue-green algal mat growing in a test tube made into a photoelectric cell by connecting platinum wires to oxidized waters above and reduced organic sediments below; (b) energy systems diagram; (c) power delivered as a function of load while light is constant. See maximum power discussion in fig. 3.2 and appendix fig. A3. Micro., microbes.
KINDS OF WORK: STORING, PROCESSING, AND ACCELERATING
When power from a potential energy source is flowing through and driving a useful process, we are accustomed to describing the process and its output as work. Thus mechanical work is done when weights are lifted or objects are arranged.4 However, not all work is mechanical. Work is the output of any useful energy transformation.
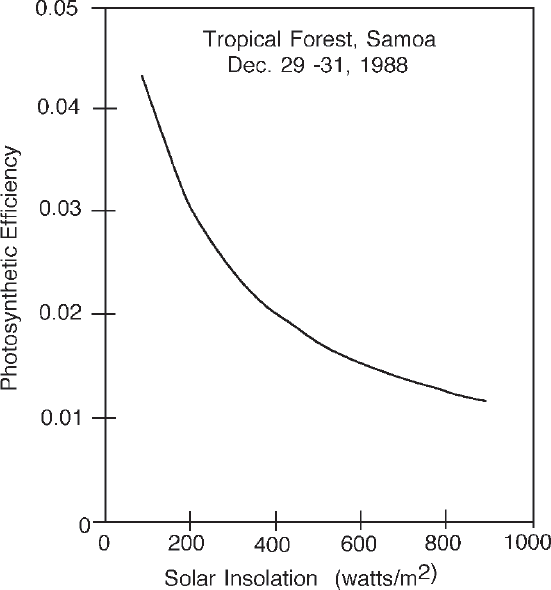
FIGURE 3.5 Efficiency of forest photosynthesis as a function of light intensity in a tropical forest in Samoa (Ryan 1990).
Let’s distinguish between three kinds of work. The first, storing work, has already been illustrated in fig. 3.2. Maximum power flow in storing energy at maximum speed requires a 50% drain. Such power involves the force of one potential energy source directed against the backforce from another potential energy storage. The energy of the process can be measured either by the energy stored or by the total power flow, which is twice the storage rate when the process operates in optimal fashion. Most energy transformations also involve a spatial concentration of energy, which uses up some of the available energy, causing efficiencies to be less than what is required just for storage (chapter 4).
In processing work, power flows from a potential energy source and passes through the system, arranging matter but affecting no storage and no final acceleration. All the energy eventually disperses into the heat drain, but first useful work is accomplished. For example, if we arrange books in a library or trucks in a parking lot, power is delivered into temporary motions, which are then stopped, with energy being transformed by the various frictions of the disordering and stopping motions. Arrangement of structure is a principal task in preserving or establishing any kind of order, whether it involves the maintenance of a living being or the operation of an industry. Thus work done against frictional forces to accomplish necessary and useful ends without storage disperses all the available energy. The energy of the process is not measured by the energy stored, for none is stored, but it may be measured by the power delivered to accomplish the work. Processes of this kind represent much of the work of human beings, such as the typing and filing of a secretary or the handiwork of a carpenter. In industrial planning it is customary to measure work of this type by the time required to do the job when efficient procedures are used. To convert data on work time into power figures, we may multiply time by the energy flow through the human being doing the work for a full day. This flow includes the actual work plus the necessary maintenance of the human being’s biological systems that allows the work to be done.5
A third kind of work is acceleration of matter. Potential energy from a source increases the speed of objects. Thus we may throw a ball and pass energy from body storage into the kinetic energy of the ball. If the ball is thrown in a place where there is little or no friction, as in outer space, 100% of the energy may go into kinetic form. At first glance, this conversion may seem an exception to the principle of energy degradation because no heat is dispersed into a drain. But this class of energy flow is only a relative energy transfer and not a typical energy transformation. In 1902 Einstein indicated that a process of acceleration, such as throwing a ball on one planet, would look like deceleration when viewed from a second planet traveling by in a direction opposite that in which the ball was thrown. Any process whose direction depends on the place from which we are looking, when viewed from the universe, has no unique direction.
Acceleration is work against an inertial force, but inertial force is defined, in turn, as a backforce against acceleration. This circular reasoning started by Newton made it possible to state that a force always has an opposing force. Work done in acceleration requires no heat sink dispersal, and the energy stored in kinetic form is still available to drive other kinds of work. Therefore it does not fall within the second principle of energetics, which applies to processes with real power flows that exist regardless of the position from which we observe them. A pendulum operating in a vacuum is an example of energy changing its relative form from potential to kinetic and back without involving the second principle of energetics.6
Thus energy flows involving accelerations and work against inertial forces are not energetic transformations in the same sense as those involving loss of potential energy. When we accelerate matter, it is not like the true power delivery for useful processes that entail heat drain. When matter is accelerated, potential energy is changed from a resting form to one with a velocity relative to the observer. Thus kinetic energy and the energy in the magnetic fields that form around flowing electric charges really are interchangeable forms of potential energy. However, if we stop the motion with frictional force, energetic degradation results. Thus the many accelerations and frictional decelerations involved in most operations constitute processing work. In a real way, frictional forces are necessary to the processes of work that support society. If there were no friction, there would be endless pendulum motions.
ENERGETIC DETERMINISM AND CAUSAL FORCE
In the affairs of forests, seas, cities, and human beings, potential energy sources flow through each process, doing and driving useful work of one of the types mentioned. The availability of power sources determines the amount of work activity that can exist, and control of these power flows determines the power in human affairs and in their relative influence on nature. Every process and activity on Earth is an energy manifestation measurable in energy units. We may say that phenomena are energetically determined. Many people prefer to call the role of energy a constraint because they believe factors other than energy are causal.
The common use of the cause concept7 is another manifestation of energetic determinism. As we have already stated, power delivery from a potential energy source involves the expression of a force X against some opposing force. Power (P) is the product of the force X and flow J; see equation 3.1. The amount of force can be scientifically defined by dividing the power JX delivered by the velocity of motion J.
Important processes are unidirectional because of the energetic degradation that makes them irreversible. We may designate the input force X as the causal force because it goes in the same direction as the flows.8 Flows J induce friction, but if there were no frictional heat dispersal the flow would not go spontaneously.
Power = Flow × Force,
P = J × X. (3.1)
Frictional forces develop to balance input force and exist only against a flow. Because force X is proportional to the power delivery JX, most everyday ideas of causal force are also statements of the ability of the energy source to deliver power and are adequately measured by energetic data. Units either of force X or of power JX can be used to measure causal action.
When we apply the concept of force to social groups, movements, and influences, we must consider program sequences and groups of associated physical forces involving power flows through a population. Whether we examine a simple process such as the fall of an apple or a complex cluster of millions of related processes in a military campaign, we can measure the causal actions as power delivered from a power source through the action of forces. For the complex world of environmental systems and the economy, it is usually easier to measure the energies in fuels involved than to determine all the component and transient physical forces exerted.
The existing power budget in an unchanging system does not necessarily measure the power available to focus on a new causal action, although powerful systems often are capable of flexibility in the use of their flows or in tapping new sources as needed. Power to do new things depends on new power development or a shift in the use of power.
All the flows of available energy in the environment are in use by our life support system already. When we set up a water wheel, a windmill, or a solar collector to use energy for a new purpose, we divert the energy from its existing use. We should not do this until we are sure that the new use contributes more to the economy than the old indirect use.
ENERGY ON SYSTEMS DIAGRAMS
The energy network language given in fig. 2.10 represents the networks of energy flows in a useful way and includes the requirements and limitations of energetic laws. Here a pathway of potential energy flow is represented by a line, and if it is inherently unidirectional, incapable of reversal, it is marked with an arrow symbol (fig. 2.10n). The potential energy storages are marked with the tank symbol (fig. 2.10b), which indicates a source of causal force along the pathway lines. The force is in proportion to the storage whenever the storage function is one of stacking up units of similar calorie content. Most ecological and civilization systems have such storage.
We uphold the second energetic principle by drawing the network so that any process has some potential energy diverted into the dispersed random motion of molecules (heat). The downward flow into the heat sink is symbolized by an arrow directed into the ground (fig. 2.10c). The first energy law is upheld by having all inflows balance outflows into storages, into the heat sink, or into exports. The many kinds of work done against frictional forces are illustrated by arrows that flow from the potential energy storage tanks into the heat sink. Whenever a work process is necessary for a second flow, facilitating the other flow by the work done on it, the arrow interacts with the second flow (fig. 2.10e; appendix fig. A5). For example, the work of people on a farm facilitates the flow of sunlight energy into food storage, although the energy of the workers’ food, which sustains them during the period of work, is converted into heat by their metabolism (fig. 2.10i).
Whenever an energy flow is transformed and restored into a tank (fig. 3.1) at the optimum rate for energy storage, part of it must go into the heat drain. If pathways of a system must pass over hills or valleys, over which the flow must be pumped, temporary additions of energy are needed. These pathways are called energy barriers. An energy carrier that crosses the barrier must increase in potential energy temporarily and hence must lose available energy to the heat sink. An ordinary arrow symbol barb is placed on a line if the pathway receives no backforces from downstream storages. In this case the only backforces are frictional.
Flow in Proportion to the Populations of Forces
Each line of the energy network diagram represents a population of forces acting against frictional forces to cause a flow of energy either alone (as in heat flows, wave energy flows, or light) or associated with a flow of materials (such as minerals or organic matter). For the energy diagrams of population phenomena given in this book, when driving forces balance friction, flow J is proportional to population of active forces N:
J ∝ N, (3.2)
where the forces usually are from populations of events working together or in succession. Equation 3.2 states that the rate of flow of such stored energy packages as minerals, money, or work is in proportion to the number of forces acting and to their individual magnitude. For example, the total body metabolism, money expenditures, or nitrogen excretion of a population of people is in proportion to the number of people involved.
For a circuit of particular conducting tendency, the proportionality in equation 3.2 can be measured by L, a constant characterizing the friction in the pathway, sometimes called conductivity:
J = LN. (3.3)
The reciprocal of conductivity L is the resistance R:
R = 1/L. (3.4)
An example from electrical systems is Ohm’s law, which states that the flow of electrical current is proportional to the driving voltage (electrical force) according to the resistance R of the wire. Another example from groundwater geology states that the flow of water through the ground is proportional to the water level head according to the conductivity of the aquifer, which depends on its flow through porous earth (Darcy’s law). Chemical reactions depend on the population of molecules acting along pathways and on resisting energy barriers and temperature. The energy systems language has helped apply concepts of flows and forces to ecological and social systems also.
Constant Current and Constant Force Sources
Energy flows may be further classified according to the kinds of driving energy sources and the properties that result as we use them for work. Constant flow sources keep the current constant. For example, an old-fashioned waterwheel dipping into a steady river flow may take varying degrees of energy from the river, but there is no change in source flow. Another example is the steady fall of leaves in some tropical forests, providing energy to the soil organisms. If earthworms use all of the organic matter, it does not increase the litterfall. Sunlight is another example. There is nothing the plants can do to bring more sunlight to their leaves.
Constant force sources deliver a constant force to the user, even though the energy consumer uses more and more. Because no energy source has infinite resource, it cannot provide a constant force beyond its limit. For example, if a dam has a very large reservoir holding the water pressure constant, we can open various turbine tunnels to obtain the same pressure in each tunnel. As long as we do not draw enough water to change the water level appreciably, the force exerted will be constant. The energy source in this instance is a constant force source. Small drains on large batteries are pushed with constant force. A bird colony would have a constant force applied to bird reproduction if the zookeeper kept the food concentration constant regardless of the number of birds eating.
AUTOCATALYTIC GROWTH
When resources are not limiting, systems grow. This happens when the concentration of available energy is fairly constant. The resource exerts a nearly constant input force, at least for a while. Consistent with the maximum power law, the products of growth are used to accelerate the capture of more energy so that growth goes faster and faster (fig. 3.6). The systems diagram for this situation (fig. 3.6c) shows the products of production (in storage tank symbol) being fed back (to the left) to amplify capture of more energy. This kind of system was called autocatalytic in chemistry, but the name is now in general use for any system of this design. The mathematics of this kind of growth generates exponential equations and growth graphs, and the name exponential often is used for such growth acceleration. Such circular stimulation is called positive feedback and mathematically produces exponential-shaped growth curves (fig. 3.6d), as Malthus showed long ago.
When available energy levels are large enough, the system develops a self-interaction to accelerate even faster, a superacceleration (fig. 3.7). The feedback of products amplifies in proportion to the self-interactions, which mathematically is the square of the storage. Heinz Von Foerster et al. (1960) used superacceleration to model the growth of the U.S. economy. The economy was in superacceleration until 1973, after which availability of energy was not as constant. The American pattern of rapid weedy growth involved high levels of cooperation in the economic and cultural frenzy to exploit. For example, the mining law of 1872 gave priority rights for mining resources over surface use of land. Later, there was an oil depletion allowance that encouraged oil development by tax exemption.
COMPETITION FOR ENERGY SOURCES
When energy supplies support accelerating growth, users with faster growth rates outgrow and displace others. It is inherent in the mathematics of the exponential growth process that the differences in growth rates increase. The competitor (species or business) with the better reproductive performance is self-amplifying, and the discrepancy between the two stocks increases. Competitive overgrowth often is shown in laboratory experiments if other controls are removed (Gause 1934; DeWit 1960). For example, one of the two species of water fleas growing in fig. 3.8 overgrew the other during the period when energy supplies were in excess.
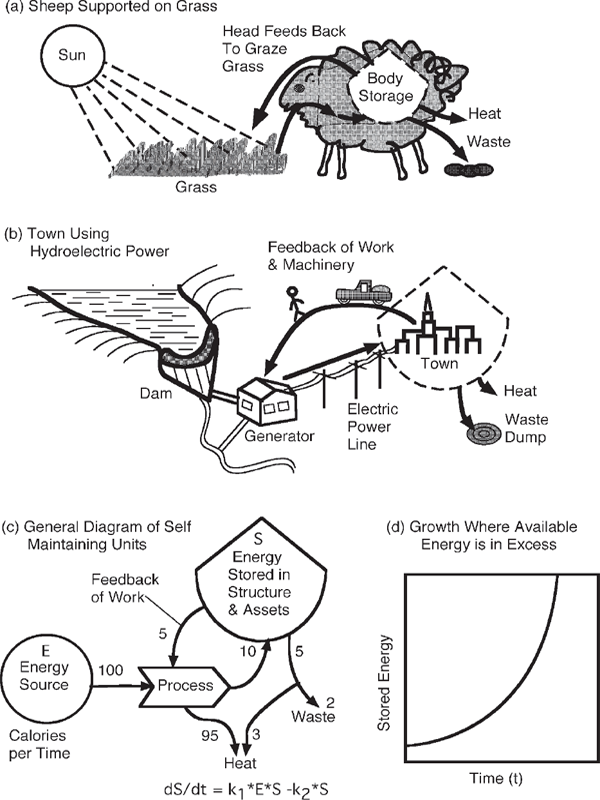
FIGURE 3.6 Autocatalytic growth where available resources are in excess. (a) Sheep living off grass; (b) village living off hydroelectric power; (c) autocatalytic feedback of storage to amplify inflow; (d) graph of accelerating exponential growth. The rate equation implied by the diagram in (c) is dS/dt = (k1 * E * S) – (k2 * S).
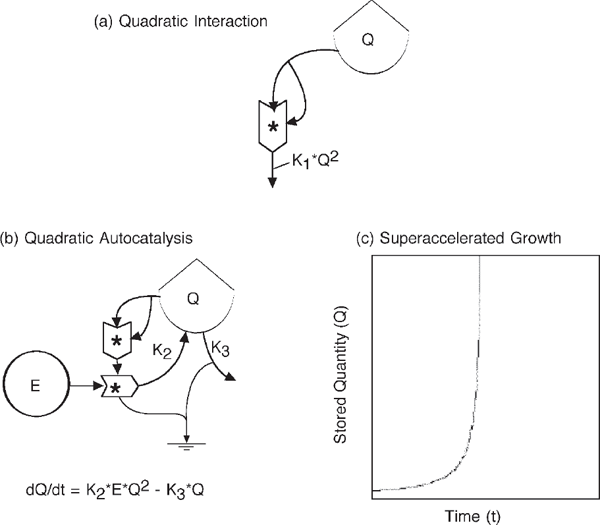
FIGURE 3.7 Superaccelerated growth from quadratic interactions. (a) Quadratic output of population interaction; (b) growth with quadratic autocatalytic feedback; (c) graph of superaccelerated growth.
AVAILABLE ENERGY IN WATER AND OTHER CHEMICAL SUBSTANCES
We are not used to thinking of water, fertilizer, and air as available energy, but they are forms of potential energy. Any inflowing reactant to a process makes an energy contribution to that reaction. When calculations are made,9 the potential energy value of the water to cause cleaning processes (its chemical potential energy) is ten times the value of the water used for hydroelectric purposes (in areas of ordinary topography). Water can be more valuable as a chemical energy than as a hydroelectric energy source. The available energy in freshwater reaching the sea drives oceanic currents along coastlines.
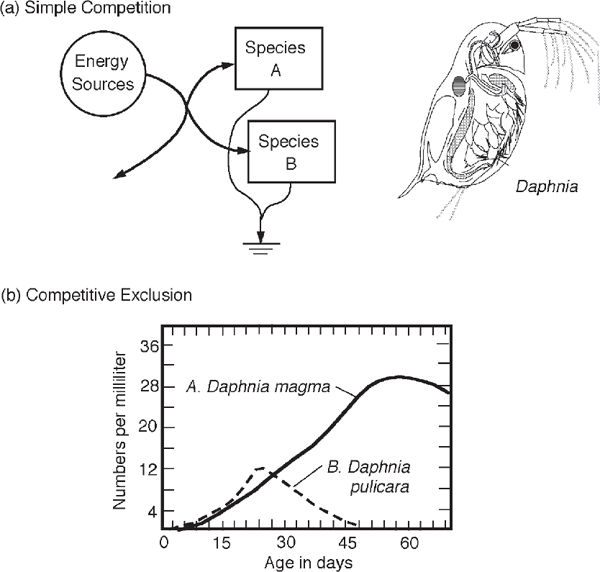
FIGURE 3.8 Competitive exclusion where 2 species of Daphnia compete for available resources (Frank 1957).
FACTOR CONTROL AND THE PRODUCTION PROCESS
The production processes that support growth usually need more than one kind of input. Each input involves a flow driven by a force. For example, fast-growing cattails in a wetland in fig. 3.9 catch the sunlight with their leaves and inorganic mineral materials such as phosphorus with their roots. The input of sunlight is pure energy. An input of phosphorus is a chemical substance, but it has the energy content of its chemical concentration.10 Both are required to make this weed’s organic matter, much of which is buried as peat. The systems diagram (fig. 3.9a) is drawn to show only the factors that may become limiting and thus control growth. Photosynthesis requires other inputs (fig. 1.3g), but they are not limiting to the cattails in this situation. The wind, which supplies carbon dioxide to the leaves, and the water needed for photosynthesis are in excess.
A work process that generates a second flow in proportion to its necessary activity is mathematically a product function and therefore is indicated by a pointed box symbol containing an × or * to indicate multiplication (fig. 2.10e). Such a box indicates a controlling role of the flow in short supply. Such pathways are called limiting factors, and the work can be thought of as a control valve on the other flow (fig. 3.10, appendix fig. A5). Some of these interactions derive their driving potential energies from their own storages and thus are autocatalytic, multiplicative positive feedbacks (fig. 3.9a, appendix fig. A7).
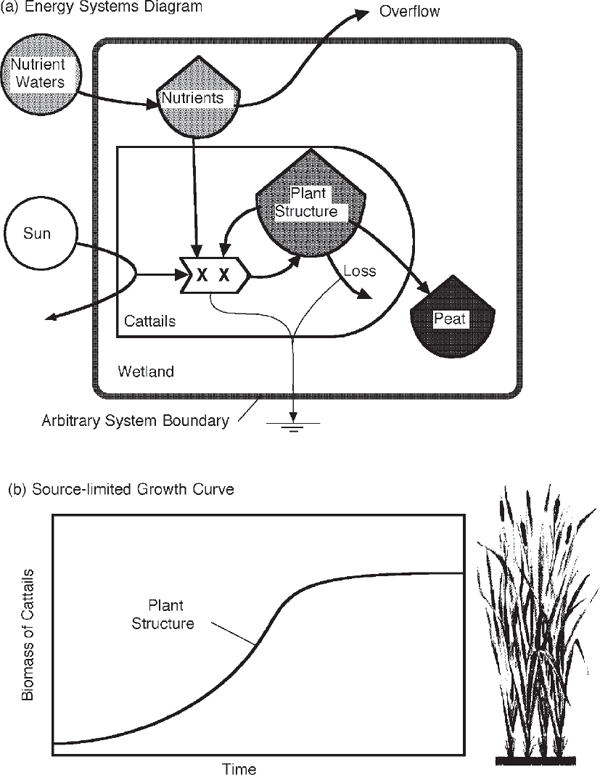
FIGURE 3.9 Fast-growing, weedy cattails in a wetland. (a) Energy systems diagram showing the net production and deposition driven by sunlight and nutrients; (b) the S-shaped growth curve that results with an externally limited flow source.
The interaction symbol is used most often for inputs that have multiplicative actions when they join. If a water valve is turned on, the water flows according to the turning action’s effect on the water pressure. The flow is a product of the two input factors. We often think of the one with less energy but higher quality as the control. Work is done in the interaction, and the process is controlled in the same way that a gate controls water in irrigation ditches. We used the term work gate in Environment, Power, and Society. The interaction symbol usually has a multiplicative interaction of two different forces to generate a product. In many fields this is called a production function. Used potential energy is dispersed into the heat sink.
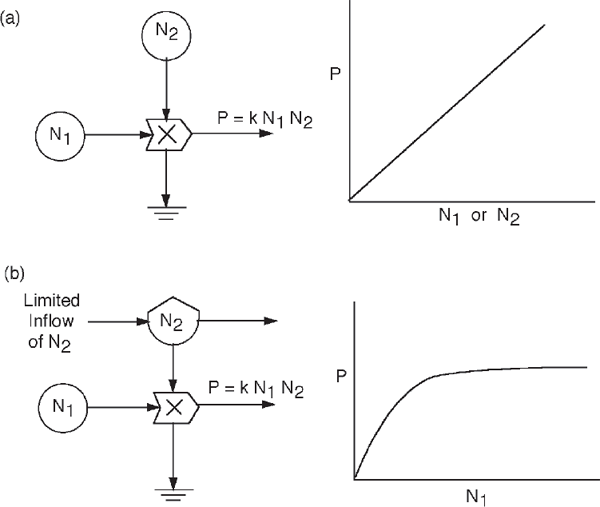
FIGURE 3.10 Production (P) by an interaction process that is in proportion to the product of 2 forces, N1 and N2. (a) Production where conditions are maintaining local forces or concentrations constant; increasing either increases production and input flows. (b) Increase of force N1 increases production but with diminishing response because the inflow of N2 is limiting. See equations in appendix fig. A5.
In the chemical industry the reaction between two inflowing chemicals is proportional to the probability of the molecules encountering each other, and this probability depends on their concentrations. The output of the reaction is a function of the product of the concentrations of the two chemicals at the reaction site. This is an example of the interaction in a production process. As shown in fig. 3.10a, varying either of the two reactants increases the output proportionately.
However, if one of the inflowing reactants is limited at its source, either from outside the system or from some restrictions in recycling within the system, then increases in the other concentration cause the output to increase, but at a diminishing rate, until the output is dependent solely on the limitation of the reactant in short supply. The characteristic response of such curves, called a rectangular hyperbola, is shown in fig. 3.10b (appendix fig. A5). The limiting factor concept, by which the amount of some small limiting nutrient such as phosphorus determines the flow of some process such as agricultural production, has become well established since the time of Liebig. Responses of plant production to nutrients follow the limiting factor hyperbola in fig. 3.10b (appendix fig. A5). Thus the symbol implies a limiting factor control action when the flows are limited.
Many energy sources important to the processes of civilization are also limiting factors, although few people dealing with public resources have given them their appropriate calorie values. Large quantities of energy go into processing water for economic use, but many substances such as water and minerals have been regarded as free goods, partly because their real wealth values were not realized, and no dollar values were assigned until human work was involved. In chapter 4 we evaluate all resources on a single basis according to nature’s work in generating them. Then the real wealth measures are compared with market values in chapter 9.
ENERGY IN PRODUCTION PROCESSES
All inputs and outputs of an interaction or production process contain available energy, but each is a different kind of energy. In fig. 3.9 solar energy is large in quantity but low in quality, whereas the chemical potential energy in the nutrient input is small in quantity but of high quality. The output of organic matter is intermediate in quantity and quality. For example, Alkire (1965) evaluated the energy flow of fish used by Pacific atoll inhabitants. For about 125 kcal that humans spent in fishing, the production yielded about 720 kcal of organic matter, and the fish required even larger energy inputs of food. As we explain in the next chapter, calories of different kinds should not be considered equal.
LIMITING NUTRIENTS AND LINEAR PROGRAMMING
Many production processes need inputs of several kinds of necessary materials, any one of which can limit output. Biological production requires several kinds of nutrient materials: nitrogen, phosphorus, potassium, and others in appropriate ratios (table 2.1).
Where there are two or more kinds of producers and two or more kinds of materials used, there is an optimum ratio of producers that uses and recycles materials for maximum output. The system may be analyzed by a mathematical approach called linear programming in order to determine the optimum ratios of the units. For example, in fig. 3.11a there are two parallel agricultural producers consuming phosphorus and nitrogen fertilizer. Each crop has its characteristic ratio of use of two nutrients, and the system of fertilizer supply is providing them in a nitrogen/phosphorus ratio of 7:1. The model also applies to two species of phytoplankton algae in the sea, each drawing from the nutrient supply upwelling from deepwater reserves in a ratio of nitrogen to phosphorus of 7:1.
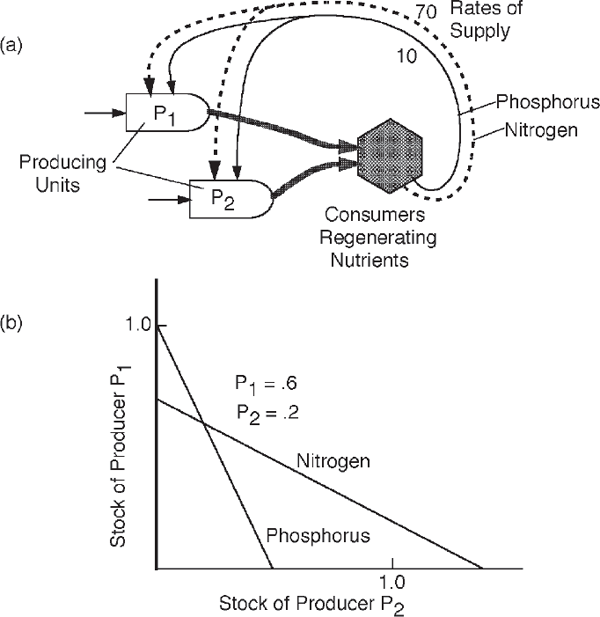
FIGURE 3.11 Linear programming of a system of 2 producing plant units, P1 and P2, each with characteristic rates of phosphorus and nitrogen use. Rate of supply of the fertilizer units is 7:1. Equations for use of 10 units of phosphorus and 70 units of nitrogen inflowing per day are as follows: phosphorus, 10 P1 + 20 P2 = 10; nitrogen, 100 P1 + 50 P2 = 70. If selection works to adjust the ratios of P1 and P2 so that total phosphorus and nitrogen use leaves no accumulations or shortages, then an optimum is located by the intersection of the lines. Reasonable figures for plankton are in milligrams per liter.
The effects of each unit on each process are expressed by terms in the two equations (see figure legend), one for phosphorus and one for nitrogen. Each line is plotted on a graph that relates the two producers, P1 and P2. Where the two lines intersect in fig. 3.11b, use of the incoming fertilizer nutrients is complete, without wastes or shortages. During self-organization, selection by the closed loops of recycling nutrients adjusts the ratio of the weights of P1 and P2 so that there is no leftover resource (where the lines in fig. 3.11b intersect).
GROWTH ON LIMITED SOURCES
When its main energy source is flow limited, growth of a dependent unit soon levels off because it cannot increase its energy use beyond what is inflowing. The weeds growing in a wetland can accelerate at first when there is plenty of light and soil nutrients, but growth levels off (fig. 3.9b) after the ground is completely covered with green foliage absorbing as much light as possible and drawing into its roots as much of the nutrients as possible. Thereafter, its production process (interaction) is source limited, as shown in the energy systems diagram (fig. 3.9a).
CONCEPT OF SUCCESSION
A concept of ecological succession was developed by R. Clements at the end of the 19th century from studies of the sequence of plants, animals, and physical changes that occurred when lands were abandoned to natural processes and seeded with organisms from surrounding forests. Often there was rapidly accelerating growth by a few weedy, rapid colonizing species, soon displaced by a higher diversity of longer-lasting plants and animals. Figure 3.12 contrasts the simple, early stages of growth with the later, more complex ecosystem that puts its energy into sustaining larger structures and relationships instead of growth. The mature stage was called a climax. The ecological model of succession and climax has now been applied to national policy under the name sustainability. But seeking a constant level of civilization is a false ideal contrary to energy laws.
THE PULSING PARADIGM
A century of studies in ecology, and in many other fields from molecules to stars, shows that systems don’t level off for long. They pulse. Apparently the pattern that maximizes power on each scale in the long run is a pulsed consumption of mature structures that resets succession to repeat again. There are many mechanisms, such as epidemic insects eating a forest, regular fires in grasslands, locusts in the desert, volcanic eruptions in geologic succession, oscillating chemical reactions, and exploding stars in the cosmos. Systems that develop pulsing mechanisms prevail. Figure 3.12 includes the downturn for reset that follows ecological climax. In the long run there is no steady state.
Figure 3.13 shows how growth and pulsing over a longer period can generate repeating patterns. By averaging over many cycles you can calculate average storages and rates of energy processing. The model generates pulsing with two connected units. One, a producer, grows and accumulates storages; the second, a consumer, goes into a frenzy of consumption and generates a pulse of activity based on its use of the accumulations.11 Our universe is full of such pulsing pairs on every scale of size and time. Rises and declines in the Mayan civilization of Mexico have been attributed to the gradual net accumulation of environmental resources, soils, forests, and fisheries, followed by a frenzied period of net consumption. The pyramids and temples are symbols of unsustainable achievement (fig. 3.13c).
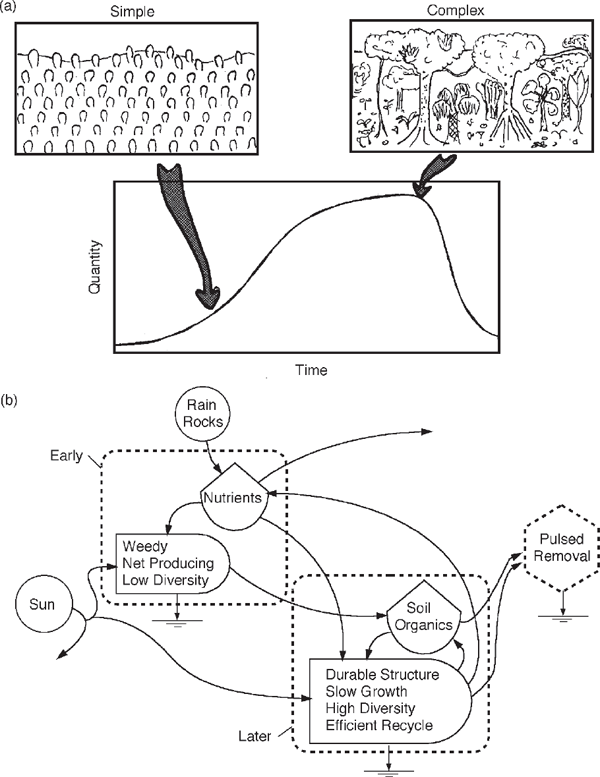
FIGURE 3.12 Growth and diversity in succession, climax, and restart that begins with available energy and nutrients to be colonized. Power is maximized at first by low-diversity overgrowth and net production and later by durable structures, high-diversity division of labor, and efficient recycle. (a) Growth curve and diversity sketches; (b) simplified energy systems diagram with dashed frames to indicate the parts of the system that are important in the 3 regimes.
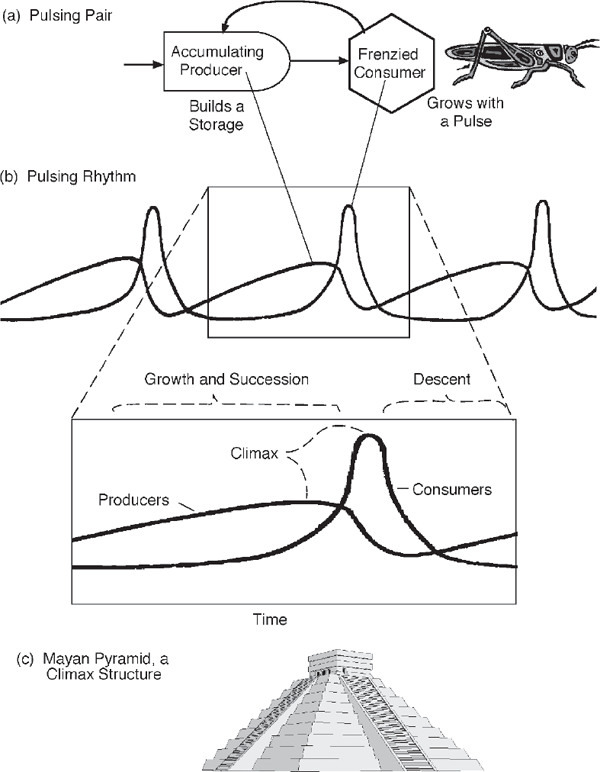
FIGURE 3.13 Pattern of repeating pulses produced by accumulating production followed by frenzied consumption. (a) Energy systems overview; (b) result of simulating a simplified model to explain the pulsing paradigm. Appendix fig. A10 has details and equations. (c) Mayan pyramid, a climax structure of human civilization in the past.
Perhaps a consensus has emerged that ecological succession is best regarded as a time span within the pulsing cycle (Holling 1986; Odum 1983; Odum et al. 1995). For more, see chapter 6 and fig. 6.14.
OVERGROWTH AND DIVERSITY
The maximum power principle explains why early succession minimizes diversity and later succession maximizes diversity. The first priority of a system is to maximize energy intake, to cover the area with energy receivers quickly, with units adapted for most rapid growth (Yount 1956; Kent et al. 2000). The system reinforces the uncontrolled expression of the ecological principle of competitive exclusion (Gause 1934), which states that one of two populations of self-duplicating organisms, when given excess resources to expand with Malthusian growth, will overgrow and displace the other. Figure 3.8 diagrams this kind of competition with an example.
The second priority is to maximize efficiency in its energy processing. When there are no excess, unused resources to be found, a high diversity of cooperating units develops, with better efficiency and division of labor. Succession such as that in a rainforest develops a higher diversity of species and repair mechanisms that give the system resilience to disturbances such as wind damage and atomic radiation (Odum and Pigeon 1970). chapter 7 explains the relationship of energy to diversity and other kinds of complexity.
When resources are in excess, maximum power is achieved by the uncontrolled overgrowth of a few species specialized for quick capture of energy and materials. They do it by throwing up flimsy structures quickly. In human society we have the example of the American colonization of North America with weedy structures, fanatic elimination of diversity, capitalistic elimination of competitors, and laws written to facilitate growth. Religious reasons were used for displacing native people, a process that maximized the growth and power of the colonists.
It is a well-known property of growth acceleration that the competitor that starts first wins out. Thus in capitalism enterprises that begin by borrowing money to get a quick start win out as long as resources are not limiting. Later, after all sources are in use, they are replaced with more diversity, more controls, and longer-lasting structures. But many, if not most, people believe humans are somehow above the limits of energy resources. Ignorance about energy develops during times of accelerating growth.
UNDESIRABLE WORK, SHORT CIRCUITS
As power levels increase, problems with excess power develop. Potential energy either is stored or drives a work process. Energy does not flow quietly if available energy is above the threshold for autocatalytic development. When storages are large, there is an immense concentration of ability to drive processes that will dissipate the energy accumulation. If no special protection for the stored energy has been arranged, opportunistic circuits may be connected and the energies discharged in disorder. Storage packages in nature need special protections, and most animals and plants divert energies into such protection, into special skin, bark, or individuals specialized to protect the group. In human systems the police perform one such function by protecting storages. The costs are the necessary part of having such a network.
A transformation of potential energy stalls if it is overloaded by efforts to accomplish too much potential generating work, but if underloaded it tends to develop additional work. If we arrange for a flow of concentrated energy to disperse the energy directly into the environment, the heat releases will become so concentrated that localized heat gradients will develop to do work while the energy is dissipating. The electric short circuit, the forest fire, and the waterfall are examples of potential energies released into heat with resulting eddies, structural damage, or work done on the environment.
A related example is found in human populations, when support is provided without work being required in return. If an idle population does not have to engage in a regular work process, it tends to set up various unorganized activities. If no organized outlet for human contributions is arranged, unrest, mob actions, irresponsible reproduction, and social eddies can result, at least until a new closed-loop system evolves by selection. The giveaway of support in human affairs can be an energy short circuit.
CANCER AT MANY LEVELS
Whereas the overgrowing acceleration of early succession has its place, there is always a possibility for runaway competitive exclusion of one part of a network using another part as excess resource. Pathological overgrowth is a fearsome, ever-present danger against which all surviving systems must be protected by organizing influences.
When a well-organized system is disrupted and its controls are destroyed, the parts may go into Malthusian competitive exclusion and in the process destroy the remnants of the system. When this happens with cells in humans, we call it cancer. In biological systems there are many kinds of cancer.
The exact causes of cancer have been difficult to identify primarily because so many influences are capable of disordering the normal control systems. Radiation, chemicals, and senescence can interfere with the controls and release the dreadful competitive exclusion growth. These disturbing agents may be additive. Once started, the cancer gains control of the system’s energy sources.
Our environmental crisis, with its many stresses and disorders, is producing cancer at many levels. Its chemicals are causing cell cancers. The disordering of ecosystems is turning well-controlled networks into widely exploding, erratic growths of species that seem as cancerous to the ecosystem as are cancerous cells in the body. Cancerous capitalism is explained in chapter 9.
The biggest cancer of them all is the human population itself. Removed from its normal controls by modern medicine, global population has accelerated past 6 billion. Using fossil fuel, some human populations have gone into a mode of competitive exclusion, consuming resources, setting up subcompetitions in their cultures and races, and generally draining the operating capital of the world toward its collapse. How will our system restore the controls and cut off the fuel supplies to the runaway components?
MAXIMUM POWER AND THE EXPLOSION OF HUMANITY
Two centuries ago human societies were still agrarian, based mostly on the environmental energy flows from the solar-based climate, oceanic resources, and earth processes. Cultures and civilizations grew and dispersed, first in one place and then in another, as energy resources were accumulated and consumed in frenzied pulses of local, momentary growth. Like ecosystems, human societies alternated between the stages of simple overgrowth and climax periods of complexity and diversity. These patterns of society apparently maximized power in both the short run and the long run, like those of other self-organizing systems.
Then ways of using fossil fuels were discovered, and a huge quantity of highly concentrated potential energy became available. Society was newly driven with an energy source of the constant force type. For the last two centuries available energy has not been source limited. Growth has been possible on a much larger scale of space and time. As can be predicted from the maximum power principle, humanity and its economy surged into global growth that is still under way. It has been a time of early successional overgrowth, competition, wars of conquest, capitalism, and uniformity. But to understand better, let’s postpone consideration of the power basis for society until we introduce additional energy principles in chapters 4, 5, and 6.
SUMMARY
The universal dependence of all systems, including human society and its economy, on available energy and energy laws was introduced with the help of energy systems diagramming. Production, growth, and consumption require that available energy (exergy, potential energy) be used up in work processes and the energy dispersed in degraded form. The natural processes of design selection during self-organization cause the systems to develop that maximize power intake and useful consumption. In each energy transformation an optimal intermediate efficiency is selected that maximizes power.
Production processes depend on the necessary inflowing ingredients, which can be limiting. When potential energy and material resources are available in excess, overgrowth of simple units prevails with autocatalytic growth and competitive exclusion. Later in succession, when available inflows are fully in use, the designs that maximize power have high-diversity units with more structure and storages, symbiotic interactions, efficiency, and recycle of materials to eliminate material limitation. But each period of accumulation is ended with pulsed consumption and restart, a pattern that apparently maximizes power in the long run. The surge of growth and reorganization of humanity in the last two centuries on rich fossil fuels has also produced pathological short circuits, cancerous drains, and disruption of the global life support system.12
BIBLIOGRAPHY
Alexander, J. 1978. Energy basis of disasters and cycles of order and disorder. Ph.D. dissertation, University of Florida, Gainesville.
Alkire, E. W. H. 1965. Lamotrek Atoll and the inter-island socioeconomic ties. In Illinois Studies in Anthropology. Urbana: University of Illinois Press.
Clendenning, K. A. and H. C. Ehrmantraut. 1950. Photosynthesis and hill reactions by whole chlorella cells in continuous and flashing light. Archives of Biochemistry, 29(2): 387–403.
Curzon, F. I. and B. Ahlborn. 1975. Efficiency of a Carnot engine at maximum power output. American Journal of Physics, 43: 22–24.
DeWit, C. T. 1960. On competition. Verslagen van Landboukundig Onderzoekingen Netherlands, 66: 1–82.
Fairen, V. and J. Ross. 1981. On the efficiency of thermal engines with power output. Journal of Chemical Physics, 75(11): 5490–5496.
Frank, P. W. 1957. Coactions in laboratory populations of two species of Daphnia. Ecology, 38: 510–519.
Gause, G. F. 1934. The Struggle for Existence. New York: Hafner.
Holling, C. S. 1986. Resilience of ecosystems: Local surprise and global change. In W. C. Clark and R. E. Munn, eds., Sustainable Development of the Biosphere, 292–317. Cambridge, UK: Cambridge University Press.
Jammer, M. 1957. Concepts of Force. New York: Harper & Brothers.
Kent, R., H. T. Odum, and F. N. Scatena. 2000. Eutrophic overgrowth in the self-organization of tropical wetlands illustrated with a study of swine wastes in rainforest plots. Ecological Engineering, 16(2000): 255–269.
Lotka, A. J. 1922. Contribution to the energetics of evolution. Proceedings of the National Academy of Sciences, 8: 147–151; Natural selection as a physical principle. Proceedings of the National Academy of Sciences, 8: 151–155.
Odum, H. T. 1983. Systems Ecology. New York: Wiley.
Odum, H. T. and R. F. Pigeon, eds. 1970. A Tropical Rain Forest. Oak Ridge, TN: AEC Division Technical Information.
Odum, H. T. and R. C. Pinkerton. 1955. Time’s speed regulator: The optimum efficiency for maximum power output in physical and biological systems. American Scientist, 43: 331–343.
Odum, W. E., E. P. Odum, and H. T. Odum. 1995. Nature’s pulsing paradigm. Estuaries, 18(4): 547–555.
Patten, B. 1985. Energy cycling in the ecosystem. Ecological Modeling, 28: 1–71.
Rabinowitch, E. T. 1951. Photosynthesis, Vol. 2. New York: Interscience.
Richardson, J. R. 1988. Spatial patterns and maximum power in ecosystems. Ph.D. dissertation, University of Florida, Gainesville.
Ryan, S. 1990. Diurnal CO2 exchange and photosynthesis of the Samoa tropical forest. Global Biogeochemical Cycles, 4(1): 69–84.
Von Foerster, H., P. M. Mora, and L. W. Amiot. 1960. Doomsday: Friday 13 Nov. A.D. 2026. Science, 132: 1291–1295.
Yount, J. L. 1956. Factors that control species numbers in Silver Springs, Florida. Limnology and Oceanography, 1: 286–295.
NOTES
1. When energy is transformed in successive stages in circular pathways, the available energy decreases, but it is possible to trace some energy through many loops, as studied by Patten (1985).
2. The curve for power as a function of loading and efficiency is a parabola (appendix A3 from Odum and Pinkerton 1955). Later derivations were published by Curzon and Ahlborn (1975) and Fairen and Ross (1981).
3. Because every real process requires power, the maximum and most economical collection, transmission, and use of power must be one of the primary selective criteria. The criterion for natural selection has often been considered simply the maximum possible reproduction and survival of the species concerned, a principle that, operating alone, would make shambles of any multispecies system through destructive competition.
4. The scientific, quantitative definition of mechanical work characterizes it as the product of a force times the distance over which that force operates. Any process involves a force and an opposing force, and any process involves work done in operating the forces for a distance. The force that is used to overcome resisting backforces flows from a potential energy source and is the means for delivering power. The opposing forces may be from other potential energy sources, from the friction that opposes any velocity, or from the inertial force that opposes any acceleration in the absence of other forces.
5. See chapter 2, note 3.
6. In electric transformers, energy is transformed from one electric coil to another by the surges of electric current, which cause temporary magnetic fields created by one coil to induce a current flow in the other coil. In coils of different properties, the voltage of the electrical power may be changed as desired. When side effects are eliminated, such transformers pass power approaching 100% efficiency. One may wonder whether such energy transfers are exceptions to the second principle of energetics. Transfer of electric energy by transformer is yet another kind of acceleration of matter (charged electrons in wires), once again a relative process. As viewed from one position, energy changes its apparent form from electric potential to magnetic field energy. Viewed from a different position that is moving in the opposite direction, the transformation appears to be from magnetic field energy to electric potential energy. The energy transformation is only a relative one.
7. See Jammer (1957) for a review of force causality concepts.
8. In the past some physics textbooks, in trying to emphasize the concept of balance of forces, made the point that there is no cause or effect. This half truth applies to problems of static force balance and accelerations not involving heat-dispersing work processes and energy degradation.
9. The potential energy in chemical concentrations of gases and solutions in the biosphere where the pressure is nearly constant is Gibbs free energy (DF), a logarithmic function of the concentration. For example, there is more available energy in rainwater than in seawater. The presence of 3.5% salt in seawater reduces the concentration of the water to 96.5%:
ΔF=ΔFo + nRTln (C2/C1);
ΔF=0 + (1/18 mole/g)(1.99 cal/deg mole)(300°K)[ln (96.5/100)].
The result is 1.18 cal/g, or 4.6 kcal/gallon. Additional energy may be included in water, depending on the kinds of molecules dissolved in the water as it is used in industrial and living activities.
10. The Gibbs free energy in phosphorus concentration can be calculated using the concentration relative to average concentration in the biosphere and the Gibbs equation. The result is about 83.5 cal/g.
11. The model (fig. 3.9a) for cattail growth implies the following equations:
dN/dt = Jn – (K1 * N) – (k2 * Rs * N * S);
Rs = Js/[1 + k3 * N * S)];
dS/dt = (k4 * Rs * N * S) – (k5 * S) – (k6 * S);
dPt/dt = k6 * S,
where S is plant structure, N is nutrient concentration, Jn is inflow of nutrient waters, Js is inflow of sunlight, Rs is residual unused sunlight in plant tissue, and Pt is peat accumulation.
12. This model was discovered by John Alexander (1978) and its spatial and temporal properties simulated by John Richardson (1988). For details, see appendix fig. A10.