WHEREAS THE classical energy laws (chapters 1–3) explain much of what happens in single processes, energy hierarchy principles relate processes between scales. This chapter explains how the energy hierarchy accounts for spatial organization and distribution of pulse intensity, stored quantities, and material concentrations. The fundamental principle offered in this chapter is not only that energy organizes hierarchical patterns but that energy is itself a hierarchy because the many calories flowing through numerous small units in a network converge to form units with fewer total calories but with larger size and territory. The energy hierarchy provides a measure emergy, spelled with an m, for evaluating work on all scales in units of one scale, a concept of natural value.
Energy transformations form a series in which the output of one is the input to the next. Available energy decreases through each transformation, but the energy quality increases, with increased ability to reinforce energy interactions upscale and downscale. For systems organized on many scales from small to large territory of influence, a maximum power design develops in which each scale is symbiotically connected by feedback loops with the next. Energy transformations organize that converge energy, materials, and money to centers. With increasing scale, storages increase, depreciation decreases, and pulses are stronger but less frequent.
ENERGY TRANSFORMATION AND QUALITY
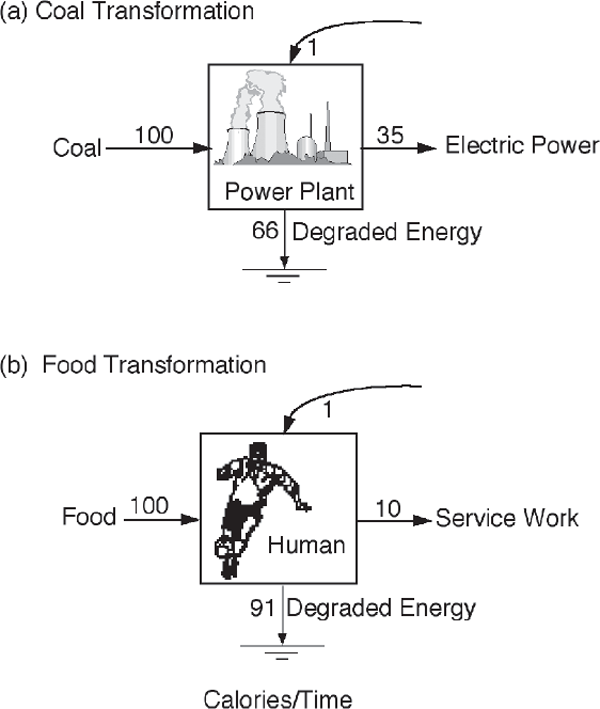
An energy transformation (fig. 4.1) is a conversion of one kind of energy to another kind. For example, coal fuel is burned in a power plant to generate an output of electric power. Or a person transforms food to generate an output of human services. As required by the second law, the input energy with available potential to do work is partly degraded in the process of generating a lesser quantity of the output energy.
FIGURE 4.1 Energy transformations with steady state energy flows, (a) Coal transformation into electricity; (b) transformation of food into human services.
Efficiency
Efficiency is the traditional measure used to represent energy transformations. It is the percentage of input energies that is output energy. See examples in fig. 4.1.1
Control Inputs
Most energy transformations are controlled by small inputs of high-quality energy, as shown on top of the boxes in fig. 4.1. In most energy texts these energy flows are ignored because they are small, but their effect is major. The few calories of the control inputs have as much effect on the output power as the many calories of lower-quality intake, as explained with fig. 3.10.
In one sense, the output energy usually is regarded as an increase in quality because more available energy was used to make it. There is some consensus that such high-quality outputs can accomplish more useful work if coupled to amplify other lower-quality energy flows according to their potential. This coupling of high- and low-quality energies to maximize useful output is the energy matching principle. In these examples a calorie of electric power can do more than a calorie of coal. A calorie of human service contributes more than a calorie of food. As explained in chapter 3, transformed energies can maximize power by feedback interactions that capture more resources. Recall the example of autocatalytic reinforcement in fig. 3.6.
Although one can imagine an energy transformation that does not generate something that aids useful work, it is reasoned that such transformations will not be selected by the natural self-organizational processes that reinforce the individuals and connections that generate more useful power.
As we explained in chapter 1, for purposes of evaluating energy budgets, we can aggregate or disaggregate depending on our scale of interest. For example, in fig. 4.1b we show human service work as one aggregate process, but we could have shown the human as a series of connected transformations by the organs, tissues, and cells within the body.
ENERGY TRANSFORMATIONS IN A SERIES
When energy transformations are connected in a series, the outputs of one transformation are the inputs to the next, except that some of the outputs go back to the input process, interacting and controlling the input. Figure 4.2 shows energy flows in a series with three transformations. Each calorie of energy flow is represented as a separate flow line in fig. 4.2a to help readers visualize the way available energy decreases through the transformations and disperses into degraded heat when its ability to do work is used up. The stepwise decrease in power flow between transformation units is shown as a bar graph in fig. 4.2b. The transformation units are represented as an energy systems diagram in fig. 4.2c.
A LAW OF ENERGY HIERARCHY
When many units of one kind combine to support another kind of unit that feeds back control, we describe the organization as a hierarchy. As shown in the typical energy transformation system in fig. 4.2a, energy flows decrease in steps to the right. Many calories of lower quality on the left support fewer calories to the right. In other words, energy transformations are hierarchical.
To explain why energy organization is a hierarchy, consider a military organization. We call the organization of an army a hierarchy because many privates are required to support the action of sergeants, and many of these to support lieutenants, and so on. Conversely, high-quality control actions feed back from lieutenants to sergeants to privates. The military organization is a special case of the energy hierarchy (fig. 4.3).
The author proposed the universal hierarchical self-organization of energy systems as a fifth energy law (Odum 1987, 1988): All the energy transformations known can be connected in a series network according to the quantity of one kind of energy required for the next (fig. 4.4). Note the reinforcing feedbacks that appear to be universal (but often ignored) by which each transformed power flow feeds forward or backward so that its special properties can have amplifier actions.
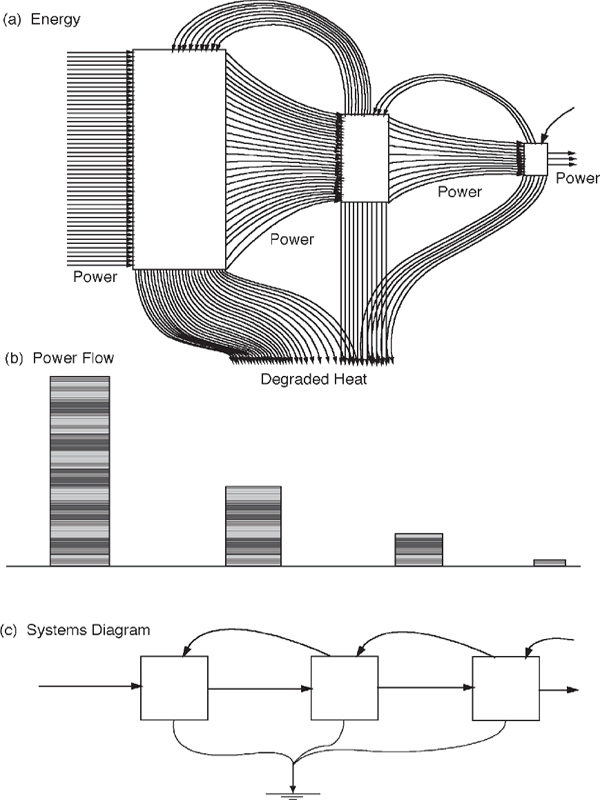
FIGURE 4.2 Hierarchy of converging energy flows and transformations. (a) Picture of power flows with each line representing a flow of 1 calorie per time; (b) useful power output of each transformation process (flows out of each box toward the right); (c) energy systems diagram.
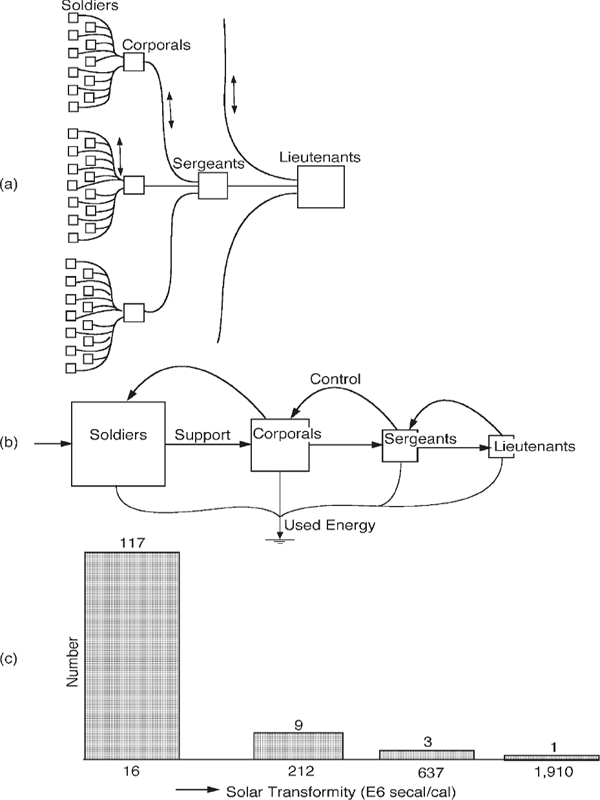
FIGURE 4.3 Flows of energy in a military hierarchy (Odum 1987). (a) A schematic diagram of military organization, (b) an energy systems diagram including control actions, and (c) the number of units of different transformity.
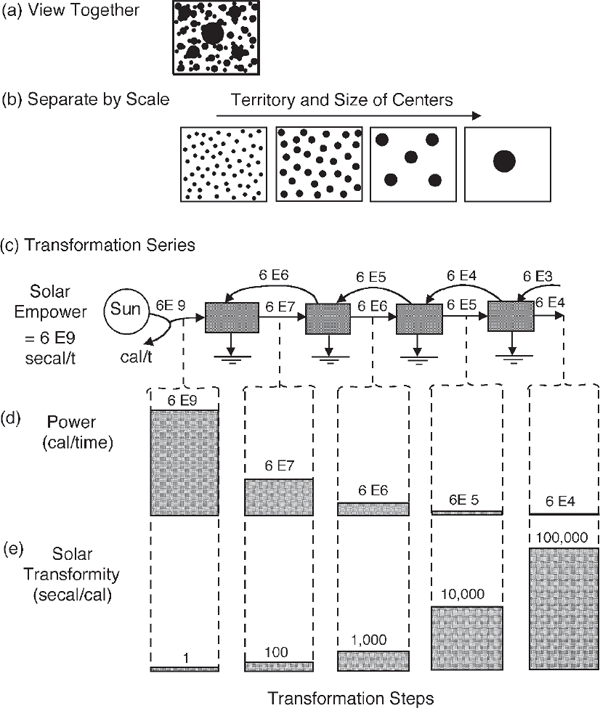
FIGURE 4.4 Energy transformations connected in a series. (a, b) Size and territory of the units composing each; (c) energy systems diagram of transformations with values of energy flow on pathways; (d) useful power flowing between transformations; (e) transformities.
EMERGY AND EXERGY
In recent years the terms available energy and exergy (spelled with an x) have been used for energy that still has the potential to do work. For one kind of work process, the more exergy, the more work. For example, using more electrical exergy causes more water to be pumped with an electric pump.
Unfortunately, different kinds of available energy (exergy) often have been added as if they are equivalent measures of work. In fig. 4.1b it is incorrect to say a calorie of food is equivalent to a calorie of human service. It makes no sense to say a calorie of sunlight is equivalent in work done to a calorie of electric power.
Where energies of different kinds from different levels in the universal energy hierarchy are to be compared or their effects combined, they need to be expressed in units of one kind of energy. A new measure was defined: Emergy (spelled with an m) is the available energy of one kind previously used up directly and indirectly to make a product or service. The energy required for the transformations is no longer in the product or service, but emergy carries the memory of the availability that was used up. Emergy is a new kind of state variable. The units of emergy2 are defined with the prefix em- (e.g., emcalories, emjoules, em- Btus). In the energy transformation series in fig. 4.4, the solar emergy is the same for all the flows in the chain. In this book we use solar emergy as the common measure, although in the past coal emergy and electrical emergy have been used for some comparisons. The abbreviations used for quantities of solar energy are as follows: solar emcalories (secal), solar emkilocalories (sekcal), and solar emjoules (sej).
Figure 4.5 is an example of an energy transformation series (solar energy–wood–coal–electric power–night lights). Abundant energy from the left supports one unit of electric light power on the right. This series uses the three kinds of energy that drive the geobiosphere: the sun, the tide, and deep earth heat. These are combined in the figure into one source expressed as solar emergy units (2.4 E6 solar emcalories per time).3 The useful power decreases sharply with each step.
EMPOWER
The flows of energy through a network carry their emergy, a property of their nature relative to the universal energy hierarchy. Whereas power is useful energy flow per time, empower is emergy flow per time. In the energy chain in fig. 4.5, the empower flow is 2.4 E6 solar emcalories per time. The energy that was required is no longer a part of the product, but emergy is a property that represents its history and implies its importance. It remains with the product and the product’s products until the available energy is gone. Emergy disappears when the available energy is used up (degraded).
COMPARISONS
In Environment, Power, and Society, tables summarized the power in various processes of our civilization and the globe to show the importance of energy. However, to see how important an energy flow is, we need to express it as empower. In table 4.1 the energy content (kcal/cm3) being consumed by four different processes is expressed as solar emergy per unit volume (sekcal/cm3), and the power flows of the processes (kcal/cm3/day) have been expressed as solar empower (sekcal/cm3/day).
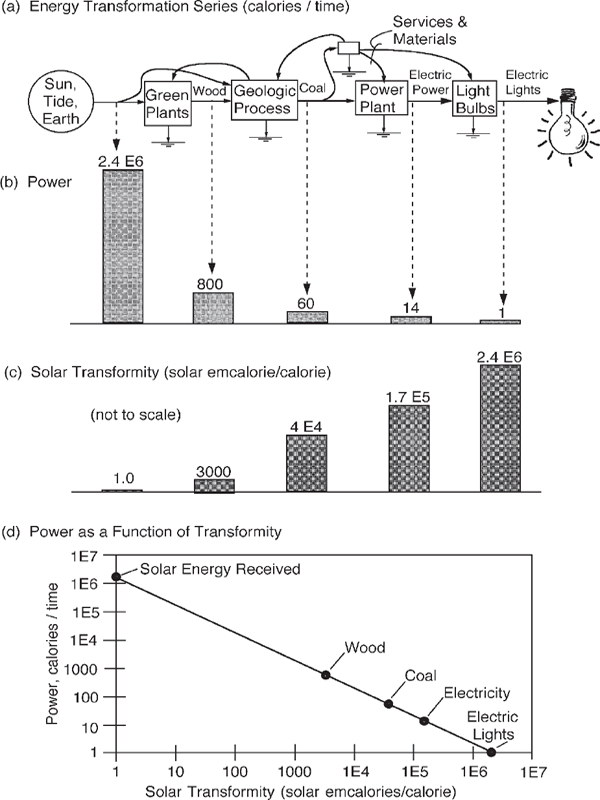
FIGURE 4.5 Example of an energy transformation series from solar energy through biomass to electrical lighting. (a) Energy flows and transformations; (b) bar graph representing the decrease of available energy at each step; (c) transformities increasing at higher levels to the right; (d) graph showing power as a function of transformity.
TABLE 4.1 Comparison of Some Fuels and Consumers
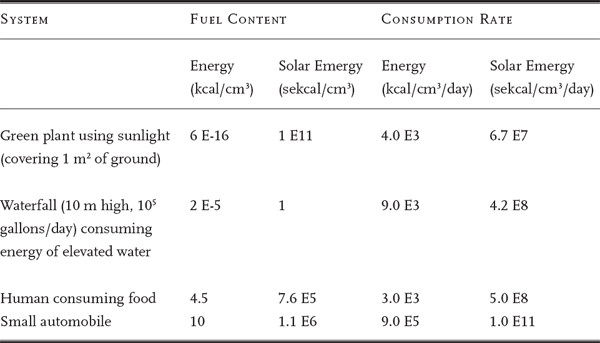
TABLE 4.2 Comparison of Power Flows
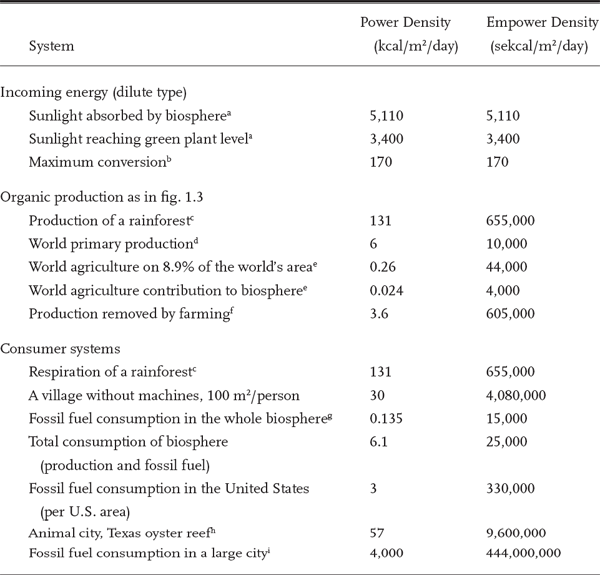
a Sellers (1965): 3.67 E18 kcal/day; 5.1 E14 m2/earth, 29% reflected.
b At high light intensities 10% of visible light is converted to organic matter; visible is 50% of total sunlight.
c Odum and Pigeon (1970).
d Hutchinson (1954). This figure is defined as the sum of daytime net photosynthesis measured by metabolic substances released or absorbed by the medium of plant cells (such as oxygen) plus the nighttime respiration. The actual gross photosynthetic process is much greater than can be measured in this way because there is fast internal cycling (making and using) in the day, stimulated by photorespiration and by the impetus of storages in the various sites of reaction in the cells of the plants. Adding night respiration is an objective procedure but one that apparently underestimates the amount of the daytime cycling. Therefore the figure given is much too small as a measure of gross production. In recent years maps of the world’s primary production have been published using much lower values from radiocarbon uptake studies in bottles of seawater from the tropical oceans. These world averages are one-tenth of the figure in the table. In one respect, most of these radiocarbon measurements were mostly erroneously calculated so that they represent neither the basic gross inflow of carbon into the cells nor the net accumulation but something in between. However, as a measure of the food available to other food chains they are useful, showing how little of the gross primary production gets outside of the plant cells over much of the earth. The actual net production is even less than these maps show.
e U.S. Department of Agriculture (1970). Production is first calculated per unit of agricultural land (4.55 E13 m2) and then per area of the biosphere (5.1 E14 m2).
f [(40 kcal/m2/day)(Agricultural lands)]/(Area of earth).
g Revelle et al. (1965).
h Copeland and Hoese (1967).
i 0.025 people/m2; 1.6 E5 kcal/person/day.
Power density is the flow of energy per unit area per unit time (kcal/m2/day). It is a measure of the intensity of energy use per area. Table 4.2 summarizes power (energy flows) per square meter for various levels of the global system of humans and environment. Note that the power density decreases from sunlight to fossil fuel consumption. However, their importance is evident when power density (kcal/ m2/day) is converted to empower density (sekcal/m2/day).
INTERBRANCHING NETWORKS
Although we often isolate a simple chain in our minds or in drawings to think about a system (for example, figs. 4.2, 4.3, and 4.4), real systems form more complex networks, as we showed with the house in fig. 2.11. If each energy transformation is connected to the ones that supply inputs and use outputs, an interbranching network results (fig. 4.6a). Like the single chain, the flow of power decreases from left to right while the quality increases. Perhaps it is time to recognize the energy hierarchy as a fundamental property of the universe in which each kind of energy has its place. To put it more simply, large quantities of low-quality energy are the basis for but controlled by small quantities of high-quality energy.
Similar phenomena on different scales were called isomorphic structures by Len Troncale (1978, 1988). Gerrit Feekes (1986) wrote a book titled The Hierarchy of Energy Systems from Atoms to Society in which he described the way energy is associated in comparable ways with structures and processes on different scales of living organisms and their psychological organization.4
TRANSFORMITY
One can relate all the forms of energy in a series of energy transformations to one form of energy by calculating their transformities. Transformity is defined as the calories of available energy of one form previously required directly and indirectly to generate one calorie of another form of energy.5 The units of transformity are emjoules per joule, or emcalories per calorie. For example, in fig. 4.5 the solar transformity of electric power is 1.7 E5 solar emcalories/calorie. Transformity is the emergy divided by the energy. In this book we use calories as the measure of energy, solar emcalories for emergy.
Solar transformity = (Solar emergy/Time)/(Energy/Time),
which is the same as
Solar transformity = (Solar empower/Power),
with the units solar emcalories/calorie.
Although we use joules in other books, transformity is numerically the same:
Solar emcalorie/Calories = Solar emjoules/Joule.
In the energy transformation chains in figs. 4.4, 4.5 and 4.6, the energy decreases at each step, but the emergy is the same. Hence the solar transformity increases. In fig. 4.5 solar transformities rise from 1 for sunlight to 2.4 million solar emcalories per calorie for electric lights. Transformity increases with each energy transformation. It is a measure of the increasing quality of energy as it is passed through successive transformations. Transformity measures the position of each kind of energy in the universal energy hierarchy.
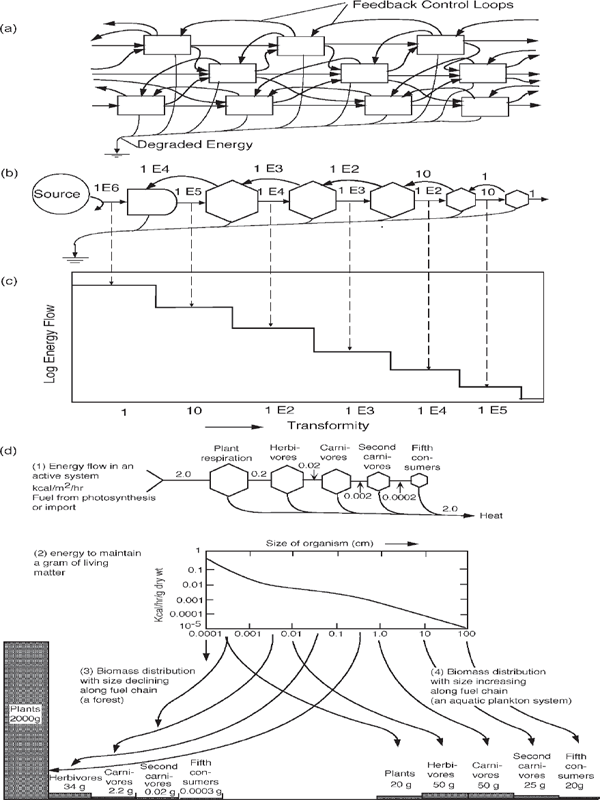
FIGURE 4.6 Patterns of the energy hierarchy. (a) Web of energy transformations in series; (b) network aggregated into a web; (c) power as a function of transformity on double logarithmic scales; (d) relationship between a steady energy flow and the mass of living structure maintained. (1) Diagram of a representative energy flow between compartments of the food chain. (2) Graph of the respiratory metabolism of organisms as a function of their individual size (based on data in Zeuthen 1953). (3, 4) Two distributions of mass estimated by dividing the energy flow by the energy per gram maintenance requirements given in (2). Different sizes cause masses to vary, even though the energy flow is the same.
GRAPH OF POWER AND TRANSFORMITY
A useful way to represent energy in relation to the hierarchy is the plot of energy (power or storage) as a function of the transformity (fig. 4.5c). Because transformity is a measure of energy quality, we sometimes call this a quantity–quality graph. In a series of transformations the energy flow steps down with each transformation, and transformity increases accordingly, causing a plot on regular (arithmetic) coordinates to be very hollow and cover only a small range.
Usually we use logarithmic scales, where each tick represents a tenfold increase. The horizontal scale has transformities beginning with sunlight and increasing to the right 1, 10, 100, 1000, 10,000, etc. The quantity of energy flow (power) on the vertical axis is also plotted on a logarithmic scale. When the graph represents a series of energy transformations with the same emergy, the energy flow and transformity are inverse (fig. 4.6c). The following definitions are obtained by rearranging the definition that follows from the hierarchy law:
Power = Empower/Transformity.
Sometimes we call a power–transformity plot an energy transformity spectrum:
Energy flow = Emergy flow/Transformity.
On the graph with logarithmic scales (fig. 4.6c), the relationship is a straight line. For example, in fig. 4.5d the line connecting points for the solar–coal–electricity–light series is straight.
TYPICAL TRANSFORMITIES
As explained further in chapter 5, the earth receives its main energies from sunlight, tide, and the hot interior of the earth. Almost everything else on Earth is derived from these flows through the complex web of energy transformations in atmospheric, oceanic, geologic, biological, and societal systems. The more transformations that occur at successive levels in the global hierarchy, the higher the transformity and the less the actual energy, although the small energies at high levels have great impact (e.g., birds of prey, earthquakes, information storms). Figure 4.7 summarizes some of the transformities of environment and society.
SPATIAL DIMENSIONS OF ENERGY HIERARCHY
The self-organization of energy into hierarchies explains how and why phenomena over the surface of the landscape form spatial centers of energy transformation on all scales. Small centers converge their outputs to larger centers that represent the larger scale. These converge to even larger centers at the next level, as suggested by the sketch in fig. 4.8a. The hierarchy of towns, cities, and villages, so vivid in maps, is an old principle of geography. The hierarchy of small spatial centers of human settlements converging to larger centers was described by Al-Muqaddasi in 986 AD and further documented by Christaller (1966).
Ecologists have documented the pattern of small centers to larger centers in the relationship of leaves, branches, and tree trunks and in such animal cities as nests of ants and termites. Extensive studies on geomorphology, stream branching, hydrology, and energetics of watersheds were made by Luna Leopold (Leopold and Langbein 1962) and others (Jarvis and Woldenberg 1984). The flow of water self-organizes hierarchies of water channels converging on larger streams.6
So by what mechanisms are energy hierarchies and spatial organization of centers linked? Because energy decreases with each transformation, the downstream products have less energy to feed back and amplify. However, if systems converge the transformation products to centers spatially, they concentrate these flows so that the feedback out from the centers is concentrated enough to have a strong effect by spreading its useful work over the contributing area. The pathway arrows inward and outward in fig. 4.8 show the manner by which an area is both a center’s support and its territory of controlling influence. Systems prevail that form hierarchical centers spatially, a design that helps maximize power and empower.
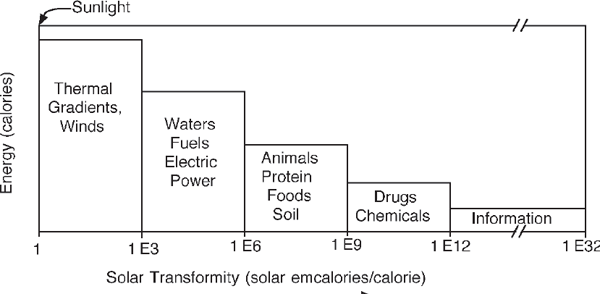
FIGURE 4.7 Some transformities of environment and society (Odum 1996).
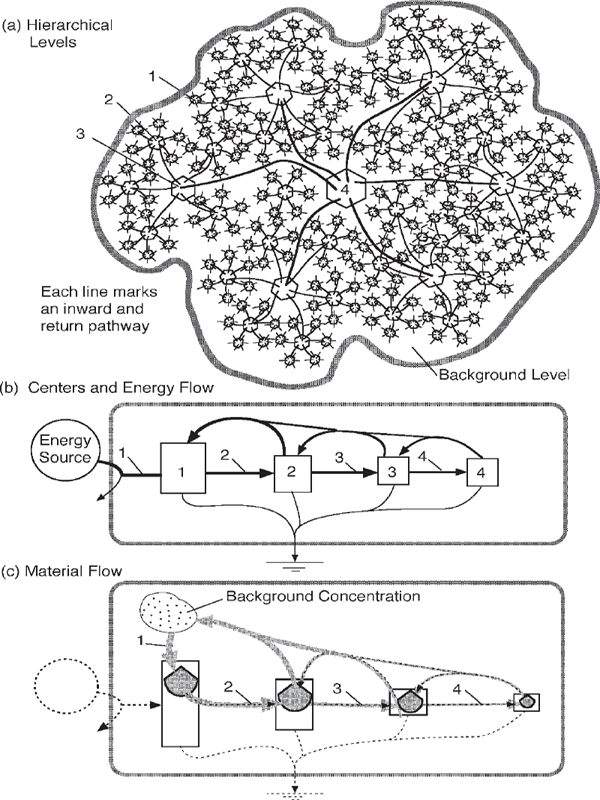
FIGURE 4.8 Spatial pattern of energy hierarchy with transformed energy becoming more concentrated in centers. (a) Spatial pattern of converging pathways; (b) energy systems diagram showing transformations and transformity increasing to the right; (c) diagram of energy-driven processes concentrating materials to the right and recycle to the left.
The cascade of similar structural patterns on different scales can be generated by fractal models according to Mandelbrot (1983), a well-known way to understand hierarchical snowflakes, tree branches, and flowers. The energy hierarchy is a fractal cascade with fractions of energy inflow transmitted through each energy transformation. That fractal forms are so abundant is another evidence of the energy hierarchy law.
PULSING INTENSITY IN THE ENERGY HIERARCHY, THE TEMPORAL DIMENSION OF ENERGY HIERARCHY
The accumulation–pulsing sequence (fig. 3.13) is observed on all scales, but the pulsing appears to be more concentrated in time at the higher levels (to the right in our diagrams). With less energy with which to feed back and reinforce, the higher levels can achieve concentration not only through spatial concentration but also by storing for a longer period and discharging in a shorter delivery time. Figure 4.9 shows how the larger the scale, the longer the accumulation time, and the more concentrated in time is the feedback to the supporting territory. Jorgensen and associates (1998) found that ten ecological phenomena, including photosynthesis and avalanches, fit the straight-line, logarithmic plot of frequency as a function of magnitude of change (fig. 4.9). Many examples were found by Daeseok Kang (1998) in plant and animal populations in lakes and oceans. Strength of floods is proportional to the scale of contribution and inverse to their frequency. Doxiadis (1977) found many people taking small trips and a few people with longer trips, expressing their areas of influence. Pulsing follows from the hierarchical self-organization of energy. In other words, the higher levels can do more with less by accumulating for longer times and delivering sharper pulsing.
PULSE ADAPTATION
Pulses from a larger scale often are called catastrophes, although they are inputs of high-transformity energy with the ability to cause large responses. Systems that prevail have to draw benefit and adapt to catastrophic pulses. A recent summary of anthropological views (Hoffman and Oliver-Smith 2002) recognizes the human responses to catastrophic pulses such as terrorist attacks as a normal part of the culture and genetics that have been self-organized into human society.
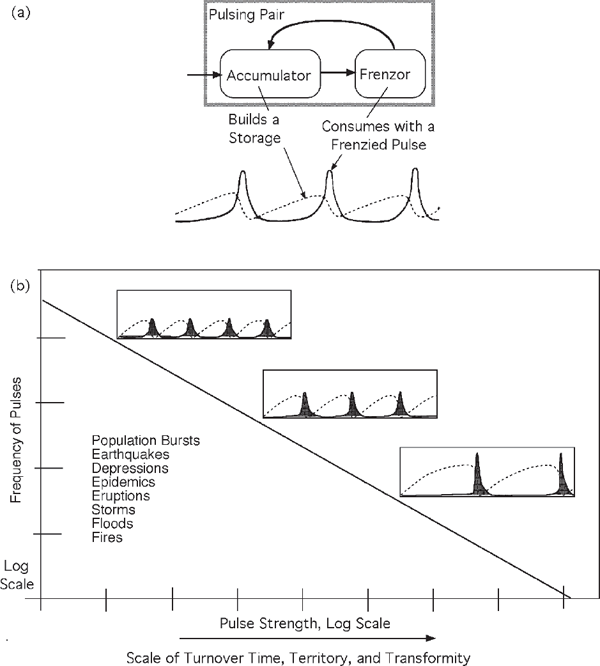
FIGURE 4.9 Pulsing patterns of energy hierarchy. (a) Accumulator–frenzor design that generates performance-increasing pulses. (b) Inverse relation between number of pulses and their strength. Example: earthquake frequency and intensity on the Richter scale (log of energy).
HIERARCHICAL STORAGE OF ASSETS AND TURNOVER TIME
Usually each energy transformation process has an associated storage from which the autocatalytic feedbacks originate. There are feedbacks within the transformation unit and longer feedbacks that go to other energy transformation units (fig. 4.10). These storages fill and discharge as part of the accumulations and frenzied pulses. The size of the storages per area that is maintained increases along an energy transformation series. This is a necessary consequence of the selection for longer periods of accumulation at higher levels. To have a longer period of accumulation for levels with less energy flow requires a larger storage. Larger storage concentrations also have larger volume–surface ratios and longer depreciation times. Figure 4.10a shows larger storages with position in the energy hierarchy. It is well known that the size of many animals increases along the food chain even as the total energy flows diminish.7 For example, data from C. S. Holling in fig. 4.10b show the biomass of animals increasing with their territories of support and action (home range).
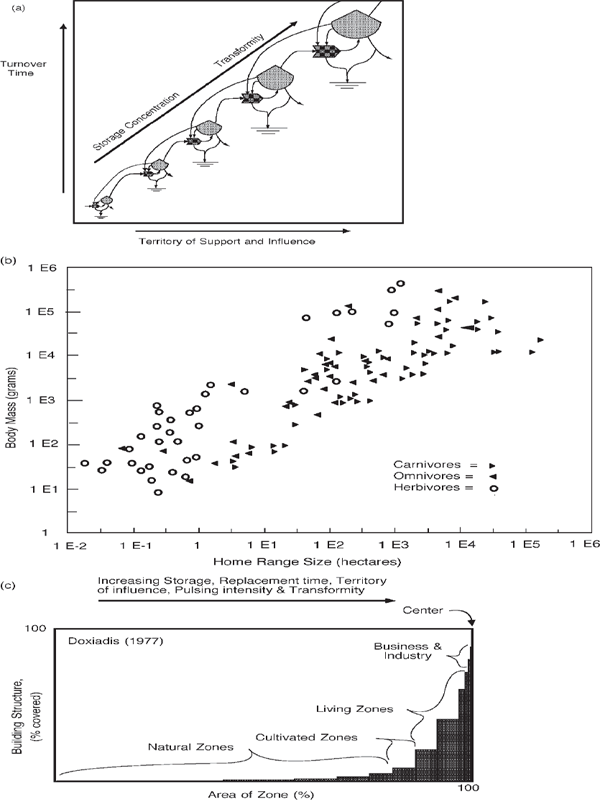
FIGURE 4.10 Energy transformations on a scale diagram of territory and turnover. Storage concentration increases with scale. (a) Scale diagram showing the increase of transformity and storages. (b) Biomass of animals related to the territories of support and influence (composite of figures from Holling 1992). (c) Building structure of human civilization related to zones surrounding hierarchical centers (modified from Doxiadis 1977).
EMERGY STORAGE
As explained in chapter 2, growth and succession on any scale require and are accompanied by development of the storage necessary to maximize the energy intake with feedback pumping. When resources from transformations are stored, both energy and emergy accumulate. The emergy is the sum of the inflowing empower required to generate the storage, overcoming any necessary depreciation. Emergy storage is the product of the energy going into storage and its transformity. Some emergy storage may be lost by transport away for other use; some emergy is lost if the energy or material content of the storage is allowed to disperse.
Ecologists Ramon Margalef (1958) and Sven Jorgensen (1997) have suggested that maximum power occurs through the building of biomass storages. In a population of animals the biomass often is the hierarchical center. For example, visualize the spider at the center of its web. Troncale (1988) found the mass of biological entities increasing as the square of the size.
Everyone who has observed skyscrapers and skylines is familiar with the accumulations of structural mass that develop in the center of cities. Figure 4.10c shows the relationships of building mass concentration in urban centers, first explored by Doxiadis (1977).
TERRITORY, TURNOVER, AND TRANSFORMITY
In recent years it has been customary in many fields to show that territory and turnover time (replacement time) are correlated and useful for registering the scale of phenomena. We can summarize some of the principles of energy hierarchy by relating territory, turnover time, and transformity. An energy transformation series has been plotted as the diagonal of fig. 4.10a, which has the usual coordinates of territory and turnover time. As the figure suggests, a series of energy transformations really is a passage between scales of size and time in which transformity becomes a third measure of scale. Transformity measures the position of something in the universal energy hierarchy. Veizer (1988) did the fundamental work to show how the sectors and cycles of geologic process form such a diagonal series.8
If it was not clear before, by representing systems with series of energy transformation modules the energy systems language (fig. 2.10) automatically arranges items of a system in order of the scale properties (turnover time, territory, and transformity). When we diagram a new problem, our first task is to arrange the sources and components from left to right in order of transformity.
ROLE OF THE ENERGY HIERARCHY IN CONCENTRATING MATERIALS
According to the second law, concentrations tend to disperse spontaneously (fig. 4.11a). For example, a concentration of salt in water diffuses under the influence of movements and oscillations on smaller scales. To concentrate something or maintain a concentration, available energy has to be used up in some transformation process that increases concentration. See the pumping relationship in fig. 4.11b. The potential energy of a chemical concentration is its Gibbs free energy.9 When a substance is concentrated, its Gibbs free energy is increased somewhat, but much more available energy is used up concentrating it at the optimum efficiency for maximum power (chapter 3). Note the relationship of driving energy to the concentrating process in the energy systems diagram (fig. 4.11b).
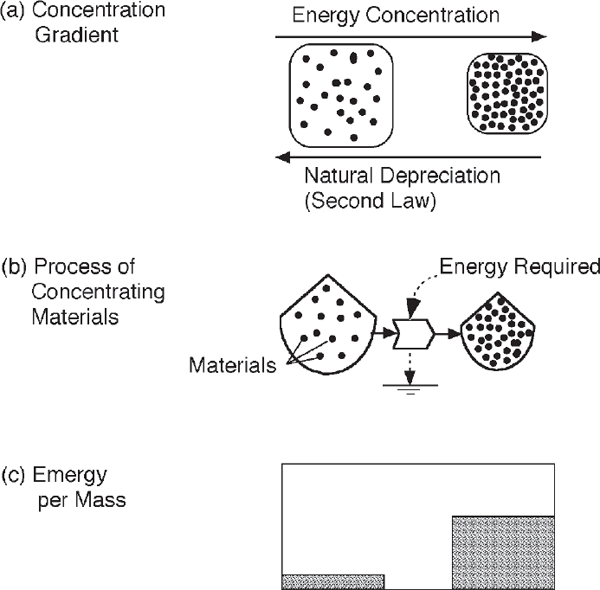
FIGURE 4.11 Use of available energy to concentrate substances. (a) Concentration and the second law; (b) energy availability required to concentrate materials and energy; (c) increase of stored emergy with concentration.
Because available energy is used up in each transformation step, there is less and less available energy to do further concentrating. This means that there has to be an inverse relationship between the quantity of materials concentrated and the number of steps (levels) of concentration. Just as the quantity of concentrated energy has to decrease with scale, so does the quantity of concentrated materials, also because of the nature of the energy transformation hierarchy. Figure 4.12b shows the inverse relationship between the quantity of materials concentrated and the degree of concentration for an energy transformation series with one emergy source.
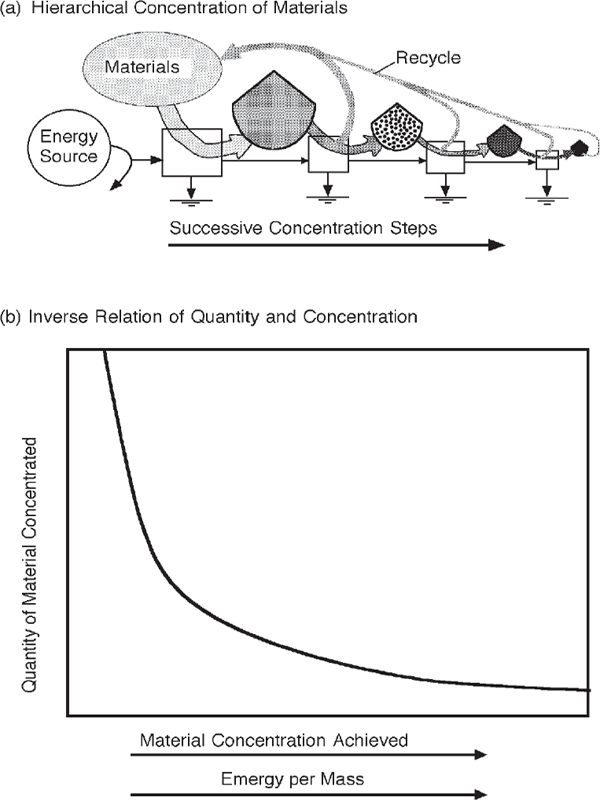
FIGURE 4.12 The distribution of materials caused by the transformations of the energy hierarchy. (a) Systems diagram showing decrease of materials with each step up in concentration; (b) materials concentrated as a function of concentration.
SPECIFIC EMERGY FOR EVALUATING BIOGEOCHEMICAL CYCLES
Whereas materials by their concentration have available energy and emergy relative to their surroundings, it is often more convenient to represent materials according to the emergy per unit mass, which Sergio Ulgiati (2001) called specific emergy. The materials of the universe can be arranged in a series according to their values of emergy per mass (fig. 4.12b).
It has been customary for a century to draw chemical cycles of ecosystems, organisms, and the earth, but there has been no accepted pattern for arranging components and flows. The energy-based law of material hierarchy suggests that material diagrams can be made more thermodynamic and uniform by using the energy systems convention that arranges components and flows of materials from left to right in order of their emergy per mass values. Flows to the right represent increases in concentration, whereas cycles back to the left indicate dispersals of material to larger area, with loss of emergy concentration (fig. 4.12a). For example, figs. 2.8 and 2.9 contain material flows for metabolism, and fig. 2.11c shows material circulation in a house.
ENERGY HIERARCHY AND MOLECULAR ENERGY
This chapter started by explaining energy hierarchy concepts involving a series of transformation steps using ecological food webs and biochemical networks as examples. A food chain of energy transformations is on the scale of human observation and therefore in clear view. People can see that successive steps are generating products of increased order, significance, and unit importance such as whales, tigers, and creative people.
But much of the science of energy has come from physical scientists thinking about the molecular scale. The submicroscopic world was out of sight, and the energy of molecules was assumed to be unorganized and disorderly, to be represented as a statistical distribution.
Figure 4.13a is the distribution of kinetic energy used by Maxwell and Boltzmann to represent molecular energy at equilibrium (i.e., without any available energy incoming or degrading). On the left are molecules of lower velocity and kinetic energy bumping each other about. But some of the collisions generate a smaller number of faster molecules with more kinetic energy, and these are on the right of the figure. At the far right the energy level is high enough to cause small pulsing observable in the microscope as Brownian motion. Energy moving upscale to the right equals that dispersing downscale to the left. Note the sketch of equilibrium in fig. 4.13a. Even at equilibrium, self-organization generates an energy hierarchy. No assumptions of randomness are needed.10
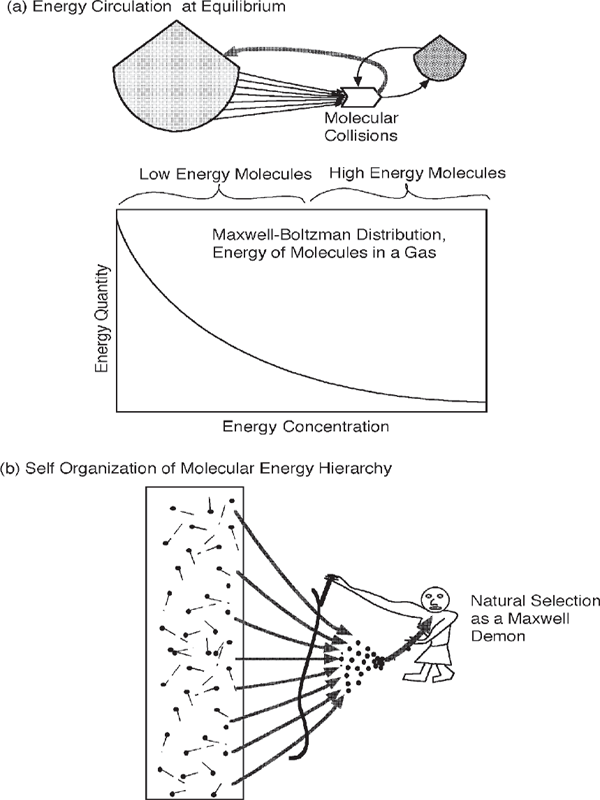
FIGURE 4.13 Energy hierarchy in a gas at thermodynamic equilibrium. (a) Energy systems diagrams of molecular collisions used to explain the hierarchical distribution of energized molecules; (b) cartoon of natural selection as a Maxwell demon with a broad base of choices and support.
A favorite image for discussing molecules in motion is the Maxwell demon (fig. 4.13b). The idea is that a tiny molecular-sized being might concentrate energy by opening a door to let molecules go in one direction while closing the door to those that would pass back out. Arguments were made that the demon’s work was impossible because the energy gathered by choosing a higher-energy molecule was less than that required to operate the door. Yet fig. 4.13a shows that, in a larger system, energy could converge from a broader base of many inputs to support selective action at a higher level. The natural self-design process of developing a hierarchy accumulates a few molecules of higher energy (higher velocity). In other words, natural selection in a population of energy interactions is a Maxwell demon.
Now, if a small inflow of available energy is added to the energy distribution, more of the energy moves to the right, and the system is now energetically open but without much change in the energy hierarchy. Figure 4.14a shows the molecular energy distribution and diagrams the continuous distribution of energy in different energy concentrations with weak input. This continuous pattern is found in the thermal energy of molecules near equilibrium and in fluids with weak turbulence. There is an increase in transformity along the series (left to right).
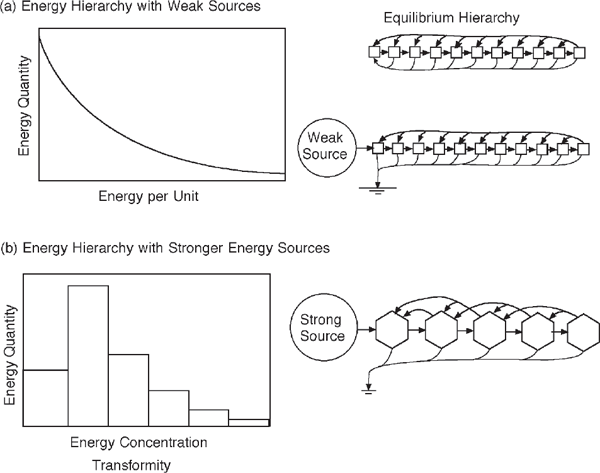
FIGURE 4.14 Comparison of energy hierarchies with strong and weak energy sources. (a) A more continuous energy hierarchy with weak energy source; (b) an energy hierarchy of discrete autocatalytic units.
To measure availability of energy, a quantity entropy was defined as the quotient of heat added divided by the temperature (on the Kelvin scale). In chapter 8 entropy is found to measure molecular complexity (logarithm of the possible combinations and connections) and used as a measure of order and disorder. At absolute zero (–273°C), where there is no heat, the molecules don’t move and have only one arrangement (as in a crystal). The entropy is small, and the molecules are orderly. Adding heat increases entropy and complexity.
Because it was assumed in physical–chemical sciences that the molecular scale was unorganized, it was assumed that entropy measured complexity disorder. Many people outside science used the word entropy as a synonym for disorder. Yet the same measure (logarithm of possible combinations and connections) was applied to the larger scale of ecosystems, society, and information to measure complex organizational order (not disorder). If the energy hierarchy law applies to all scales, then the molecular distribution of energy (fig. 4.14a) is indicating hierarchical organization of molecules (not disorder). Each year, advances in molecular science are finding more and more organized complexity at the molecular level. (See chapter 8.)
When there are large available energy flows from outside, the scale of self-organizational processes increases. The continuous energy distribution breaks up into autocatalytic units (fig. 4.14b). Each autocatalytic unit occupies a zone of the energy spectrum on its scale, and other units form in adjacent scales. Recently, papers in the systems science and ecological literature have studied the observed width of the energy spectrum occupied by species of animals and the gap in energy concentration before the next species in the network.11
If a surge of input energy of one kind is added to a system, it creates a bulge in the energy spectrum, causing energy to be propagated upscale and downscale. For example, the average distribution of energy in water waves in the ocean is like fig. 4.9, with many waves of small energy and few of larger energy.12 When a storm passes, it generates waves with energy in the middle of the spectrum, causing a bulge in the spectral graph. Some waves interact to form larger waves, but most lose energy to friction, moving downscale to waves of lesser energy and heat.
INFORMATION IN THE ENERGY HIERARCHY
On earth, information has the highest transformities of the energy hierarchy. Here information is defined as the parts and relationships of something that take less resources to copy than to generate anew. Examples are the thoughts on a subject, the text of a book, the DNA code of living organisms, a computer program, a roadmap, the conditioned responses of an animal, and the set of species developed in ecological organization. Each of these takes emergy to make and maintain.
Information is carried in energy flows and storages. For example, information passes between people in sound waves of their voices, over telephone wires, and through radio waves. Biological information in genes passes by means of the seeds of plants and eggs and larvae of fishes. Information is stored in libraries, computer disks, human memories, and the archaeological remnants of history. All these information carriers and memory devices contain available energy. However, the energy of the carrier (e.g., calories in paper, brain cell functions, computer disks) is small compared with the emergy involved in creating the information. The emergy/energy ratio (transformity) of information generally is quite high.
Because information has to be carried by structures, it is lost when the carriers disperse (second energy law). Therefore, emergy is required to maintain information. Information is maintained by copies made faster than they are lost or become nonfunctional. But copying from one original is not enough because errors develop (second law), and copying doesn’t make corrections.
So in the long run, maintaining information requires a population operating an information copy and selection circle like that in fig. 4.15a. The information copies must be tested for their utility. Variation occurs in application and use because of local differences and errors. Then the alternatives that perform best are selected, and the information of the successful systems is extracted again. Many copies are made so that the information is broadly shared and used again, completing the loop. In the process, errors are eliminated, and improvements may be added in response to the adaptation to local variations.
For example, a wiring diagram is used to make radios and is widely used with some variations. The radios that work best are selected and the information extracted into plans again. These successful plans are copied and widely shared and reapplied.
The life cycles of organisms are good examples. Seeds are planted to make many individuals with variation caused by local conditions and errors; the best performers are selected by nature or by humans. These are used to make seeds, which are broadly shared and available to replant for the next generation.
The position of information stages in the energy hierarchy is shown in fig. 4.15b by the positions from left to right. Making the first copy takes large emergy. Examples are writing a book or evolving a new species. The first copy contains the emergy of its formation.
If 1,000 copies are made, the emergy in each copy has 1/1,000 of the formation emergy plus that used to make the copy. The emergy of the set of copies is increased by the copying. When the copies are distributed so that information is broadly shared, and if more emergy is used by advertisers or receivers to incorporate the copies into their functions, then the set of information that is now shared has the highest emergy, with a high transformity (fig. 4.15b). With many copies in use, the shared information has a large territory and a slower depreciation turnover time.
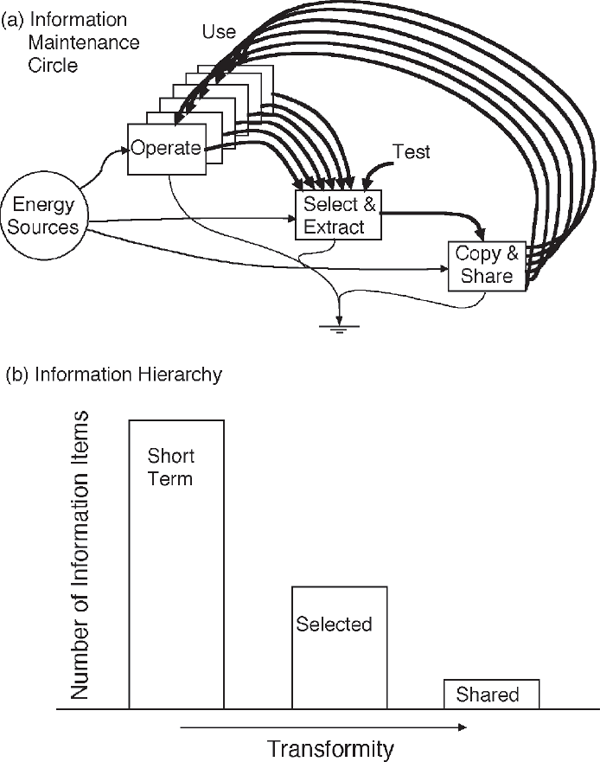
FIGURE 4.15 Information and the energy hierarchy. (a) Information maintenance cycle; (b) information classes and transformity.
When shared information is used to make and operate systems over the territory of application, the emergy of the information is absorbed into energy transformations, and the emergy concentration is returned to its lower transformity. An information circle resembles the mineral cycle somewhat. However, in a material cycle matter is conserved. In an information maintenance circle, the information is increased with copying and decreased with selections and depreciation, but a successful circle maintains enough copies to exceed depreciation and destruction rates.
MAXIMUM EMPOWER AND SCALE
When we consider systems containing several scales, the statement of the maximum power principle (chapter 3) becomes ambiguous. Maximizing power could imply that the lower part (lower quality) of the energy network gets priority because that is where energy flows are greatest. The energy hierarchy principle provides that each level in the energy hierarchy self-organizes the maximum power possible for its part of the spectrum at the same time. In other words, no level has priority over the others, but more power comes from collective development of all scales.
To discuss and compare many levels, we express each energy transformation in empower units (which puts all values in terms of energy of one type and scale). Thus, we amend Lotka’s principle and propose that self-organization develops designs to maximize empower of each scale at the same time. Although the energy flows are of different magnitude, empower of small, intense information storms at the top of the energy chain of society may contain a similar range of empower values as higher-energy flows of environmental life support. The hypothesis is that the importance of an exchange between scales is in proportion to the empower involved.
Human society occupies the middle scales of the earth’s energy hierarchy, where we can see so much confusing detail that most people don’t even look for principles. Some suggest that the middle levels are more indeterminate, with more randomness and fewer scientific principles, a belief that fits ideas of human glory, independence, and control by free market choices. But according to the principles of this chapter, patterns of society and environment fit the energy hierarchy because the trial and error of human social behavior is constrained and adapted to fit.
NATURAL VALUE
By measuring work from any scale in comparable units, emergy measures the real wealth generated by nature and by humans. By measuring what is required to make something, emergy measures the real contribution to the system of environment and society. As explained in chapter 9, emergy measures real wealth on any scale of time, whereas money measures the human services needed to buy it in the short term.
ENERGY HIERARCHY IN THE COSMOS
If the energy hierarchy concepts are general laws, they should apply to the universe. We can examine the observations of astronomy with the expectations of energy hierarchy summarized in fig. 4.4. Many students of astronomy have suggested that the stars and galaxies of the universe are hierarchically organized (Charlier 1908; Lerner 1991), although the majority have doubts. The idea is that planets are organized around stars, stars are organized in galaxies, galaxies are organized in clusters, and clusters are organized in superclusters. The organization on each scale of view is part of a larger organization on the next larger scale of view.13
Let’s consider how energy laws may account for the structure and functions of the universe. In the vast realm of space, stars and other units that self-organize are gravity produced, as described in astronomy textbooks (Carroll and Ostlie 1996; Chaisson and McMillan 1998). Under the pull of their own gravity, units of matter fall together, concentrating mass and energy and developing structure. The resulting increase of mass at the center increases gravity and captures more material. The pull of gravity between two bodies is the product of their masses divided by the square of their distance apart. The self-organization of a concentrated mass in space according to the gravity equation fits the autocatalytic energy diagram of self-organization for the maximum power principle (fig. 4.16).
The potential energy of mass falling inward together is concentrated and transformed into heat and kinetic energy of rotation. When the gravity and temperature are high enough, fusion reactions start that convert the mass of hydrogen into energy, turning such units into light-emitting stars. Subsequently, there are sequences of structural change not unlike succession in ecosystems (fig. 3.12). All units send out radiant energy, which disperses, losing concentration and thus degrading, consistent with the second law. The points of light that we see in the night sky are the energized centers of this pattern of energy and matter.
According to the energy hierarchy theory, self-organization of separate units should result in a connected energy hierarchy pattern forming an energy transformation series, drawn from left to right like that in fig. 4.4. The distribution of energy in the universe as a function of wavelength, shown in fig. 4.17, is decreasing to the right. The shorter the wavelength, the more energy there is per photon of light. Most of the universe’s energy is in microwave radiation that radiates back and forth in equilibrium, with the dilute ordinary matter at 2.7°K, where zero is absolute zero (defined by the third energy law for conditions without the molecular motions of heat). This uniformly distributed energy is called background radiation (fig. 4.16). Heavenly bodies, mass aggregates, stars, and so on, with more concentrated energy, radiate shorter-wavelength radiation, some visible and some the high-energy X-rays and gamma rays. Thus abundant low-quality energy on the left appears to be connected through the series of transformations to centers that have more concentrated energy on the right.
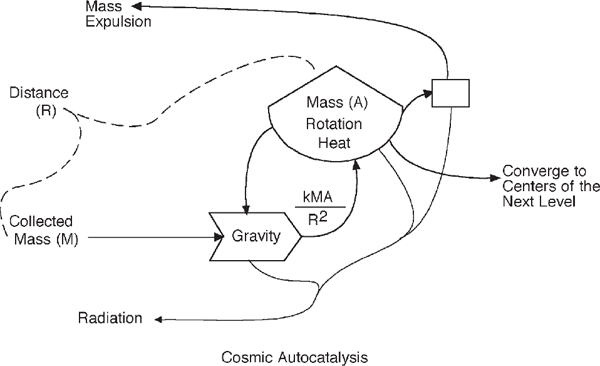
FIGURE 4.16 Energy systems diagram of the autocatalytic action of gravity in developing a star.
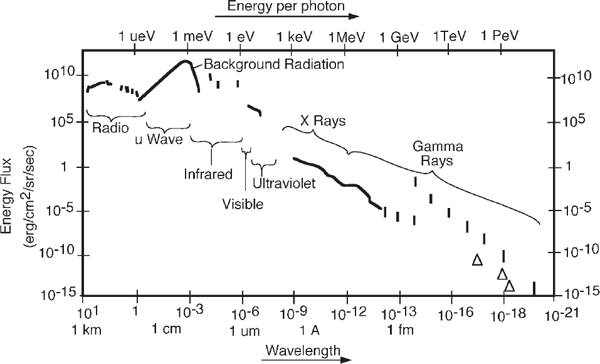
FIGURE 4.17 Distribution of radiant energy in the universe (Kolb and Turner 1986; Hoyle et al. 2000). Energy flow by wavelength. sr, steradian.
Mass in the universe also fits the energy hierarchy. Most of the mass of the universe is ordinary matter evenly dispersed or in small aggregates. Going from smaller to larger scale, the mass of stars increases as their numbers decrease. Plots of mass distribution are hierarchical (many small stars and fewer massive stars). Plots on logarithmic coordinates show a nearly straight line relationship of star numbers and star mass (Carroll and Ostlie 1996). In ecosystems where biomass storage increases upscale, animals are larger. In the cosmos, where mass storage increases upscale, the stars get smaller because the intense gravity of large masses packs the matter into tiny volumes. The territories of gravitational influence increase, with increasing distances between massive centers. The turnover times increase.
All the bodies recognized in space are known to accumulate storages and then emit pulses of radiant energy and expulsions of mass. Their growth cycles and life history behavior are not unlike those of populations in ecosystems. Mechanisms involve sequences of nuclear reaction, centrifugal force, concentration by gravity, and thermal expansion that accumulate the conditions to cause explosive mass expulsion. For example, there are supernova explosions of old stars. Periods of energy accumulation followed by pulsing outflows are known or have been proposed for most of the universe’s objects, ranging from proto-star aggregates and stars to the quasars and black holes of galaxies. At the centers of larger-scale organization, the energy hierarchy concepts predict the most concentrated bodies at their centers, with the most intense pulses and the longest accumulation periods between pulses.
Chemically, most of the ordinary matter of the universe is hydrogen, widely dispersed as background matter. Nuclear reactions in the stars generate chemical atoms of higher atomic weight. Figure 4.18 shows the cosmic abundance that results, another example of the energy-driven hierarchy of materials described with fig. 4.12.
As in earlier studies of other realms, drawing a hierarchical energy systems diagram is a useful method for organizing facts about energy and matter while considering theories. Figure 4.19 is an energy systems diagram that models the universe, showing principal structures, energy, and mass flows. The diagram separates populations of different scale and position in the energy transformation hierarchy from left to right. The background radiation and dilute matter are the lowest concentrations on the far left. These contribute energy and gravity-concentrated mass into matter aggregates. The aggregates condense into higher-energy, visible units to the right. For each level of increased scale (e.g., galaxies, galaxy clusters), there is a more intensive center (smaller and denser because of the increased gravity). Many stars are organized around larger gravitational centers, and on a larger scale these are organized around even larger gravitational centers. From left to right, nuclear reactions generate elements of higher atomic weight but in lesser quantities. The larger the territory of organization, the higher in the energy hierarchy is its center unit. To the far right are black holes with enough gravitational mass to draw in light energy and inhibit outbound radiation. Mechanisms are known or proposed to generate high-energy radiation pulses and emissions even by black holes.

FIGURE 4.18 Distribution of matter in the universe by atomic weight, following Brownlee (1992) using the data of Anders and Grevesse (1989). Transformations using the mass-energy of the abundant hydrogen on the left generate heavier atoms in stars higher in the energy hierarchy (to the right).
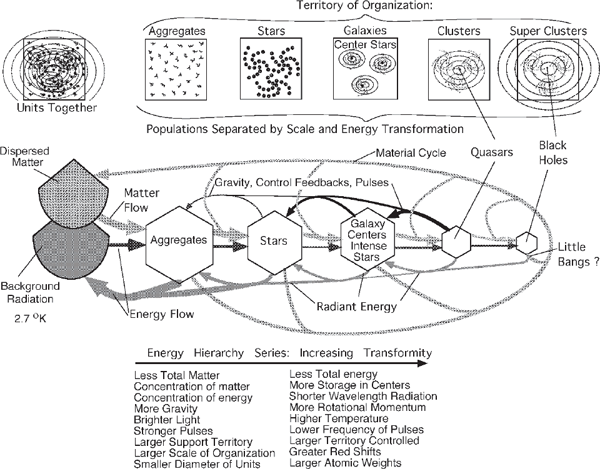
FIGURE 4.19 Energy systems model of energy hierarchy in the universe, separating populations of structures and processes according to their scale and energy transformations, increasing from left to right (Odum 2002).
The model of fig. 4.19 is not unlike models of systems on Earth, which operate in quasi–steady state. Each level of hierarchy has its cycle of transformation, growth, and pulsing but in the long term maintains an average presence and function overall. Radiant energy has mass and delivers light pressure, which helps recycle matter to the background state while being absorbed and reradiated at longer wavelengths.
Energy hierarchy concepts help explain how the fairly uniform distribution of background energy and hydrogen matter (mass energy) helps generate and sustain the fantastic forms and variety in the heavens. The dilute hydrogen mass is transformed to energy as it concentrates. To illustrate the energy hierarchy concept, the author calculated a transformity relating the energy of the sun and the earth to the sun’s share of the universe’s background energy and mass energy (fig. 4.20).14
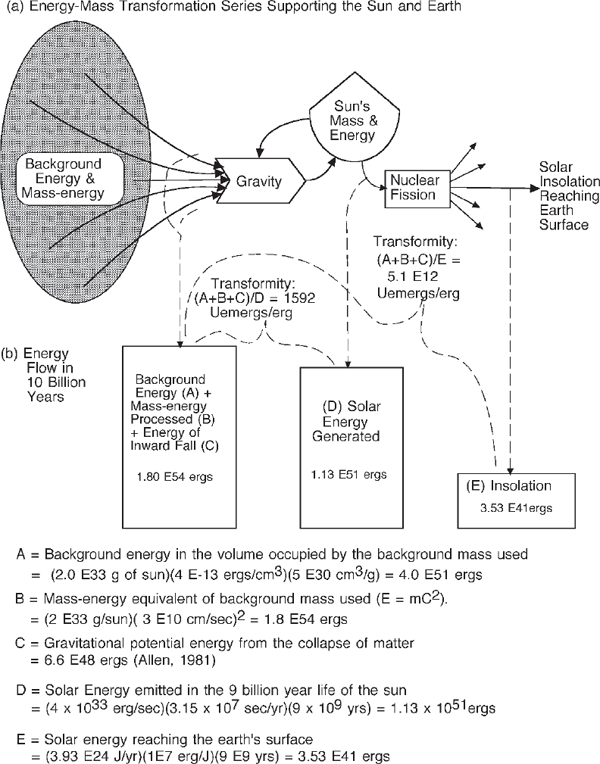
FIGURE 4.20 Calculations of the sun and earth’s share of background energy (Odum 2002). Uemergs, universal emergy ergs. Analogous to the calculation of transformities in solar emjoules per joule (or solar emergs per erg), the uemerg is used here to express everything in emergy of the most abundant, lowest-quality energy, the background radiation of the universe.
The Maxwell–Boltzmann distribution (fig. 4.13) shows how a smooth, uniform distribution of matter and energy can make a hierarchical, “lumpy” distribution of matter and energy. Once there is a mass center, background radiation can help raise its temperature because of the spherical geometry of incoming radiation. Once there is some mass concentration, its fields of gravity can evolve into autocatalytic units (fig. 4.16) and grow (the classic explanation of star formation). Self-organization may reinforce and select spiral organization and rotation, a design that helps maximize power transformations and feedback efficiency. Once there are units of higher mass and energy, these can be self-organized to converge into higher-level centers that have higher concentration and territory of influence, as in any energy consumption chain (figs. 4.4, 4.8). Hoyle et al. (2000) suggest that quasars at the center of clusters are important in pulsing recycle of energy and matter.
STEADY STATE UNIVERSE
The big bang concept of cosmology that is most popular among astronomers is based largely on the red shift of light. When a person drives a car away from a bell tower, the sounds reaching the driver shift to a lower pitch because the delayed arrival of the sound waves mimics sound waves of longer wavelength (called the Doppler effect). Similarly, when light of known wavelength comes from a star that is traveling away from Earth, the light is received with a longer wavelength, one shifted toward the red. Nearly all the stars we can see are red shifted, and stars further away are red shifted more, as if they were accelerating away faster.
However, Zwicky (1929), following Einstein, suggested that light could be red shifted if some influence in space was taking energy out of the light (tired light theory). Because the speed of light in space is constant (186,000 miles per second), reducing light energy doesn’t slow the light down but instead increases its wavelength, which reduces the energy of its photons. Light is known to be pulled by gravity. The more massive the star, the more its gravitational pull can red shift its own light emissions. According to the energy hierarchy concept, the most massive stars are centers of larger systems and bright enough to be seen at great distance. Thus, larger red shifts are further away but not necessarily traveling away. As the model in fig. 4.19 suggests, radiant energy dispersing from stars loses concentrations by diverging. Perhaps it is in the nature of diverging light in space for some red shift as part of energy recycle. Thus, several factors may contribute to observed red shifts.
When viewed as a whole with a long scale of time, the universe could have a constant average pattern of structure, mass, and energy flows (fig. 4.19). The energy hierarchy concepts seem to make the big bang theory unnecessary. At the top of the energy hierarchy (right side of fig. 4.19) are the most intense gravity centers, the black holes, which may be expected to have little bang explosions at long intervals. Some kind of little bang with intense radiations was reported recently in Science (Schilling 1999). If the intense packing in black holes regenerates hydrogen, as has been suggested, the pulsed bang of black holes could help recycle the hydrogen used up in the nuclear fusion of stars.
The kind of steady state universe described in fig. 4.19 views the heavens as a perpetual Christmas tree with flashing lights. This kind of steady state universe should not be confused with the disappear-and-reform idea or the big bang and crunch theories of steady state (Steinhardt and Turok 2002). In the latter, a big bang blows the whole universe apart, followed by big crunches in which everything falls together again into a tiny mass before banging apart again. Advocates might find the bang and crunch idea to be consistent with the theory of energy hierarchy pulsing.
SUMMARY
The network of all energy transformations forms a hierarchical series that explains the capabilities of available energy of different kinds to do work. The energy hierarchy accounts for ecological food webs, spatial organization of centers, the hierarchy of material concentrations, the increase of storage concentration with scale, and the inverse relationship of the frequency and intensity of pulses. Energy hierarchy is found in molecular populations, even at equilibrium. Many of the important facts of astronomy and astrophysics seem to be explained with a dynamic but steady state model of the cosmos based on the energy hierarchy.
Transformity indicates the position of each kind of energy in the hierarchy and the ability of that energy to amplify processes when organized for maximum power. Emergy and transformity measure the work from all scales on a common basis, a measure of natural value. In energy evaluations each exergy value should be multiplied by its transformity so that totals can be expressed in emergy units, a measure independent of scale. Because of the energy hierarchy, materials are also organized hierarchically in space and in concentration series. Self-organization develops systems and relationships that maximize production and the use of real wealth (empower). Emergy and transformity provide quantitative measures to guide public policy to maximize real wealth of the environment and society. At the top of the energy hierarchy is information, which depends on a copying cycle. Widely shared information is the highest of all transformities. More explanations and examples of energy hierarchy are available elsewhere (Odum 1996).
BIBLIOGRAPHY
Note: An asterisk denotes additional reading.
Allen, C. W. 1981. Astrophysical Quantities. London: Athlone.
Anders, E. and N. Grevesse. 1989. Abundance of the elements. Meteorite and solar. Geochimica et Cosmochimica Acta, 53: 197–214.
Brownlee, D. E. 1992. The origin and early evolution of the earth. In S. S. Butchers, R. J. Charlson, G. H. Orians, and G. V. Wolfe, eds., Global Biogeochemical Cycles, 20. New York: Academic Press.
Carroll, B. W. and D. A. Ostlie. 1996. An Introduction to Modern Astrophysics. Reading, MA: Addison-Wesley.
Chaisson, E. and S. McMillan. 1998. Astronomy, 3rd ed. Upper Saddle River, NJ: Prentice Hall.
Charlier, C. V. L. 1908. Das planeturische Rotations. Arkiv for Mathematik, Astronomi, och Fysik, 4(1).
Christaller, W. 1966. Central Places in Southern Germany. Translated by C. W. Baskin. Englewood Cliffs, NJ: Prentice Hall.
Copeland, B. J. and H. D. Hoese. 1967. Growth and mortality of the American oyster Crasostrea virginica and high salinity shallow bays in central Texas. Publications of the Institute of Marine Sciences, 11: 149–158.
Doxiadis, C. A. 1977. Ecology and Ekistics. Boulder, CO: Westview.
Feekes, G. 1986. The Hierarchy of Energy Systems from Atoms to Society. Elmsford, NY: Pergamon.
*Haar, T., H. Vonder, and V. E. Suomi. 1969. Satellite observations of the earth’s radiation budget. Science, 163: 667–668.
Hoffman, S. M. and A. Oliver-Smith, eds. 2002. Catastrophe and Culture, the Anthropology of Disaster. School of American Research, Santa Fe, New Mexico. New York: Oxford University Press.
Holling, C. S. 1992. Cross scale morphology, geometry and dynamics of ecosystems. Ecological Monographs, 62(4): 447–502.
Hoyle, F., G. Burbidge, and J. V. Narlikar. 2000. A Different Approach to Cosmology. New York: Cambridge University Press.
Hutchinson, G. E. 1954. The biochemistry of the terrestrial atmosphere. In G. P. Kuiper, ed., The Earth as a Planet, 371–433. Chicago: University of Chicago Press.
Jarvis, R. S. and M. J. Woldenberg. 1984. River Networks, Benchmark Papers in Geology #80. Stroudsburg, PA: Hutchinson Ross.
Jorgensen, S. E. 1997. Integration of Ecosystem Theories: A Pattern, 2nd ed. Dordrecht, The Netherlands: Kluwer.
Jorgensen, S. E., H. Mejer, and S. N. Nielsen. 1998. Ecosystems as self organizing critical systems. Ecological Modeling, 111: 261–268.
Kang, D. 1998. Pulsing and self organization. Ph.D. dissertation, University of Florida, Gainesville.
Kolb, E. W. and M. S. Turner. 1986. The Early Universe. Reading, MA: Addison-Wesley.
Leopold, L. B. and W. B. Langbein. 1962. The concept of entropy in landscape evolution. U.S. Geological Survey Professional Paper 500-A. Washington, DC: U.S. Government Printing Office.
Lerner, E. J. 1991. The Big Bang Never Happened. New York: Times Books.
Mandelbrot, B. B. 1983. The Fractal Geometry of Nature. San Francisco: W.H. Freeman.
Margalef, R. 1958. Temporal succession and spatial heterogeneity in ecology. In A. A. Buzatti-Traverso, ed., Perspectives in Marine Biology, 323–349. Berkeley: University of California Press.
Odum, H. T. 1976. Energy quality and carrying capacity of the earth. Tropical Ecology, 16(1): 1–8.
———. 1987. Living with complexity. In Crafoord Prize in the Biosciences, 19–85. Stockholm: Crafoord Lectures, Royal Swedish Academy of Sciences.
———. 1988. Self organization, transformity, and information. Science, 242: 1132–1139.
———. 1996. Environmental Accounting, Emergy and Decision Making. New York: Wiley.
———. 2002. Energy hierarchy and transformity in the universe. In Proceedings of the Emergy Conference, Sept. 20, 2001, 1–14. Gainesville: Center for Environmental Policy, University of Florida.
Odum, H. T. and E. C. Odum. 1983. Energy Analysis Overview of Nations, with sections by G. Bosch, L. Braat, W. Dunn, G. de R. Innes, J. R. Richardson, D. M. Scienceman, J. P. Sendzimir, D. J. Smith, and M. V. Thomas. Working Paper #WP-83–82. Laxenburg, Austria: International Institute of Applied Systems Analysis.
Odum, H. T. and R. F. Pigeon, eds. 1970. A Tropical Rain Forest. Oak Ridge, TN: AEC Division Technical Information.
Revelle, R., W. Broecker, H. Craig, C. D. Keeling, and J. Smagorinsky. 1965. Atmospheric carbon dioxide. In Restoring the Quality of the Environment, 111–133. Washington, DC: President’s Science Advisory Committee.
Schilling, G. 1999. Watching the universe’s second biggest bang. Science, 283: 2003–2004.
Scienceman, D. 1987. Energy and emergy. In G. Pillet and T. Murota, eds., Environmental Economics, 257–276. Geneva: Roland Leimgruber.
Sellers, W. D. 1965. Physical Chemistry. Chicago: University of Chicago Press.
Sendzimir, J. P. 1998. Patterns of animal size and landscape complexity: Correspondence within and across scales. Ph.D. dissertation, University of Florida, Gainesville.
Steinhardt, P. J. and N. Turok. 2002. A cyclic model of the universe. Science, 296: 1436–1439.
Straskraba, M. 1966. Taxonomical studies on Czechoslovak Conchostraca III. Family Leptestheriidae, with some remarks on the variability and distribution of Conchostraca and a key to the Middle-European species. Hydrobiologia, 27: 571–589.
Troncale, L. R. 1978. Linkage propositions between fifty principal systems concepts. In G. J. Klir, ed., Applied General Systems Research, 29–52. New York: Plenum.
———. 1988. The new field of systems allometry: Discovery of empirical evidence for invariant proportions across diverse systems. In R. Trappl, ed., Cybernetics and Systems ‘88, Part I, 123–130. Dordrecht, The Netherlands: Kluwer.
Ulgiati, S. 2001. Energy, emergy and embodied exergy: Diverging or converging approaches? In M. T. Brown, S. Brandt-Williams, D. Tilley, and S. Ulgiati, eds., Emergy Synthesis. Theory and Applications of Emergy Methodology, 15–32. Gainesville: Center for Environmental Policy, University of Florida.
U.S. Department of Agriculture. 1970. The World Food Budget. Foreign Agricultural Economic Report No. 19. Washington, DC: USDA.
Veizer, J. 1988. The earth and its life: System perspective. Origins of Life and Evolution of the Biosphere, 18: 13–39.
Zeuthen, E. (1953). Oxygen uptake as related to body size in organisms. Quarterly Review of Biology, 28: 1–12.
Zwicky, F. 1929. On the red shift of spectral lines through interstellar space. Proceedings of the National Academy of Sciences, 15: 773–779.
NOTES
1. Efficiency of transformation is the output energy divided by the inputs. In fig. 4.1a the efficiency is 34.7% and in fig. 4.1b 9.9%.
2. Although our embodied energy concept had been in use since 1967 and was used in Environment, Power, and Society, emergy units were defined in 1983 to clarify the confusion that arose from use of the same units for both embodied energy and energy. We purposely avoided the confusing practice of taking over a common word in general use for a quantitative measure. Instead, we sought a new word. David Scienceman (1987), who collaborated in our energy analysis studies for two decades, after library scholarship searches suggested the word emergy, which implies energy memory. Emergy records the available energy previously used up, expressed in units of one kind but carried as a property of the available energy of continuing outputs.
3. For convenience, in text and tables we use the computer notation E1, E2, E3, etc., which means to multiply by 101, 102, 103, etc., which is the same as multiplying by 10, 100, 1,000, etc., moving the decimal to the right. The notation E-1, E-2, E-3, etc., means to multiply by 10–1, 10–2, 10–3, etc., which is the same as dividing by 10, 100, 1,000, etc., or multiplying by 0.1, 0.01, 0.001, etc. The notation moves the decimal to the left.
4. With biological and societal examples, Feekes (1986) sought similarities in energy activity at each level by identifying phenomena on each scale with a verbal model diagrammed with four boxes. The four categories were ability, performance, impulse, and motivation.
5. This quotient was proposed as a measure of energy quality (Odum 1976) and called the energy quality ratio and the energy transformation ratio, but it was renamed transformity in 1983 (Odum and Odum 1983). Because emergy and its intensive measure, transformity, refer to a property of its surroundings, it is a new kind of dimension. It does not have the dimensions of energy. It is not a dimensionless ratio. Emergy calculation in practice involves measuring observed energy transformations, but the best (lowest) transformity that is compatible with the maximum empower of open systems operation appears to be a thermodynamic property of the universal energy hierarchy. Processes operated wastefully have higher transformities than the minimum best possible.
6. Luna Leopold discussed the energetics of watersheds in relation to Ilya Prigogine’s early theory that systems organize to minimize power. As explained in chapter 3 and illustrated in chapter 5, the opposite is true. Watersheds self-organize for maximum power, as do chemical reaction systems, which Prigogine finally recognized later, reversing himself, with his dissipative structures theory.
7. Many publications find the sizes of organisms increasing with their territories and position in food chains as the total population numbers and energy flows decrease (Straskraba 1966).
8. To describe the hierarchy of the universe from molecules to the stars, Veizer (1988) plotted stored mass representing spatial organization and half life representing turnover time.
9. A logarithmic expression for Gibbs free energy of a difference of concentration (C1, C2) comes from integration of the product of pressure and volume (which is energy), using the pressure and volume relationship of the gas law, which includes absolute temperature T. R is a constant, and n is the number of molecules (expressed in moles):
DF = nRTln C2/C1.
For an example, see note 9 in chapter 3.
10. The idea that randomness was inherent in molecular populations was encouraged by the fact that a hierarchical distribution of molecular velocities is Gaussian (bell shaped, normal), a pattern found in devices that generate symmetric variation. Because the kinetic energy of molecules is a square of their velocity, a bell-shaped velocity distribution has an exponential distribution of energy (fig. 4.13a). A reverse interpretation is that the energy of molecules is distributed exponentially because of the energy hierarchy principle (self-organization for maximum interlevel energy flows). The expression for the plot of the Maxwell–Boltzmann distribution says that there is a constant percentage decrease of energy quantity with increase of molecular energy flow (fig. 4.13a), and thus the distribution of molecular energy flows is exponential. As a result, the velocity distribution is normal. No assumptions of inherent randomness are needed.
11. The energy spectrum in living systems (energy quantity and concentration in fig. 4.14b or energy flow and transformity in fig. 4.3) is not continuous but is made up of populations connected in food webs (Holling 1992; Sendzimir 1998).
12. Ocean wave climate is represented in manuals for wave forecasting showing energy spectra. The distribution of ocean waves of different energy on average has the typical energy hierarchy spectra and frequencies.
13. Lerner (1991) provided a table showing hierarchical characteristics of heavenly bodies and groups.
14. In fig. 4.20 the sun’s share of the universe’s radiant energy and mass energy is used to estimate a transformity of the sun and earth in terms of the background energy required. 1,592 joules of background energy and mass energy is the universe’s low-quality contribution to generate each joule of the sun’s nuclear-based solar irradiation. 3.2 E9 joules of solar irradiation are required for each joule of solar energy received at the earth’s surface.