
THE EMERGENCE of human societies from minor components of nature to the dominant modern technological civilization is a story of shifting empower. Progress has become so rapid and dramatic in the last two centuries that many people believe anything is possible. This chapter first considers the power basis for earlier societies, the limits to solar energy, and some of the ways food, clothing fiber, shelter, and heat were supplied to human society. Next urban civilization is explained. Then emergy is used to evaluate alternative energy sources and the carrying capacity of the earth for people in the future.
PHOTOSYNTHETIC EFFICIENCY
To understand the energy basis for past societies, we have to recognize the way photosynthesis is limited by the dilute nature of solar energy reaching Earth. There is much confusion about the efficiency with which sunlight is converted to organic products. With the help of fig. 3.3, consider how plants have evolved to maximize the production that is possible. Humanity developed cultures and customs in amazing variety within these limits.
Photosynthetic production of the organic products (food, clothing fiber, shelter, heat) that support society is limited by the dilute concentration of sunlight reaching the earth. In the first step of photosynthesis photons separate electrons from organic structure, which gains a positive charge as a result. Shown in fig. 3.3a, the positive charges of most plants interact with water to make oxygen, and the negative charges drive the load of organic production biochemistry. In other words, the green pigmented structures of plants are natural photovoltaic cells.
To understand the thermodynamic relationships of sunlight and efficiency, refer again to fig. 3.2, which shows how power output depends on load. In that figure the loading backforce of the output process is varied and maximum power is at an intermediate load, with an intermediate optimum efficiency. Isolated chloroplasts follow the same law (fig. 3.3b). If the load is constant but the input energy is varied, fig. 3.3c results, which shows that the efficiency is inverse to the increasing input power. Equations are given in appendix fig. A4. In other words, there is a thermodynamic optimum efficiency for maximum production at intermediate light.1 As an example, recall the graph in fig. 3.5 showing that there is a thermodynamic optimum for a whole ecosystem.
Given a longer time, plants adapt to light levels by adding or decreasing chlorophyll so as to maximize energy conversion. Ireland and Oregon are dark green in winter because oceanic clouds shade the light, so more chlorophyll is needed to catch the scarce light.
THE EARTH FIT OF SOLAR SOCIETIES
Before the time of recorded history, the biological and social evolution of the human species was nurtured by photosynthesis of the ecological systems to which tribes were adapted. When there were no special energy sources for societies except the input of solar energy, tides, and deep heat of the earth, humans were a small part of the overall scheme but were protected by the earth’s great stability, complexity, rhythms, and staying power of the natural system. Because humans had little energy available to direct at the mother ecosystems, they had little ability to overpopulate, and population densities often were limited by resources. When Environment, Power, and Society was published there were still remnants of ecosystem-based human cultures for anthropologists to study, but now most have been relegated to memory. Figures 7.1 through 7.5 summarize the energy networks of societies evolved and adapted to the renewable energies of their environment.2
Hunting and Gathering Systems
Human societies evolving in ecosystems were at the end of complex food chains based on photosynthesis. In the central African rainforests the Pygmy population in the complex tropical forest used only a small part of the many channels of fruit and animal products available (Turnbull 1916, 1963). Figure 7.1 displays human population at the top of the energy hierarchy with diverse converging energy transfers, each of small magnitude. The forest concentrates energy and upgrades the biochemical diversity needed for human nutrition. Similar small populations were found in the Amazon basin and other places where the vegetation, soil structures, and geochemical cycles were self-regulated and steady. Virgin forests have huge trees (figs. 6.8 and 7.1c), root structures, and a lacework of dead biomass in logs and branches on the forest floor. Human population densities were about one person per square mile.3 Some gardens were developed in clearings, but extensive agriculture in the complex forest was prevented by the high diversity of insects and weeds, which helps to limit any one plant species.
Even in stable forest regimes, the culture of human populations can provide pulsing rhythms, described as universal in chapter 3. Rappaport (1971) explained how the forest people of New Guinea accumulated semidomestic pigs, followed by a tribal feast that initiated an incidence of intertribal war that was terminated when the energies were no longer in excess. Figure 7.1b shows a computer simulation of the pulsing flip-flop cycle as controlled by a cultural pacemaker.
FIGURE 7.1 Hunting, gathering, and gardening society in low density within the bosom of complex ecosystems. (a) Energy system; (b) computer simulation of a model of cyclic tribal life in forests of New Guinea by Christine Paddoch (1972), representing the studies by Rappaport (1971); (c) cross-section view of rainforest (Smith 1970). Most of the trees shown are different species.
Society on Coral Atolls
The island peoples on atolls of the open Pacific were part of a system of stable hydro-climate and complex coral reefs. An atoll system of humanity and nature was described by Alkire (1965) and is shown as an energy systems diagram in fig. 7.2. The same kind of complex organization of diversity found in the structure, culture, and functions of human society is found in complex tropical ecosystems (chapter 6). With stable climatic regimes the atoll system developed a complex network of tree products, root crops, and colorful marine inhabitants. Many channels of food for the human population were present, although no great energy flow was available in any one. Staple root crops, coconuts, and breadfruit from land supported a population of one per acre, but the protein source was derived from a much larger area of reef and lagoon. Calculated using the whole atoll as the basis for support, human density was thirteen people per square mile. The percentage of the marine energy budget for humans was small, but the small footprint of the society within the ecosystem was also its protection. The energy resources available to humans were insufficient for the human population to damage its life support. Diversity of the ecosystem was a protection against epidemic decimation of their food supply network.
Surviving cultures had to fit into their ecosystem, developing a great knowledge of species properties, the seasonal cycles, and the energy network. Medicinal herbs, poisons, building materials, and animal products were available in great biochemical diversity but in small quantities, so much energy was required for gathering. Adapting a culture to such diverse permutations of input may have been instrumental in the development of the flexibility of human intelligence. Adaptation of societies was guided by the same kind of natural selection of cultural designs as has been suggested for populations and ecosystem designs (maximum empower principle, chapter 3).
Support from Agriculture Versus Complex Ecosystem
Every schoolchild learns that agriculture began with domestication of plants and farm animals. The idea is to substitute domesticated plants and animals for the more complex or transient networks of nature. As diagrammed in fig. 7.3, channeling environmental energy away from the ecosystem to a simpler energy transformation chain theoretically provides more energy to society and ultimately more activity and carrying capacity for the culture. But the simplified system of fewer species has fewer means for rapid spread of plant cover, less biochemical diversity, fewer self-controls, less protection against epidemics, fewer means to limit weeds, and less soil-building capacity.
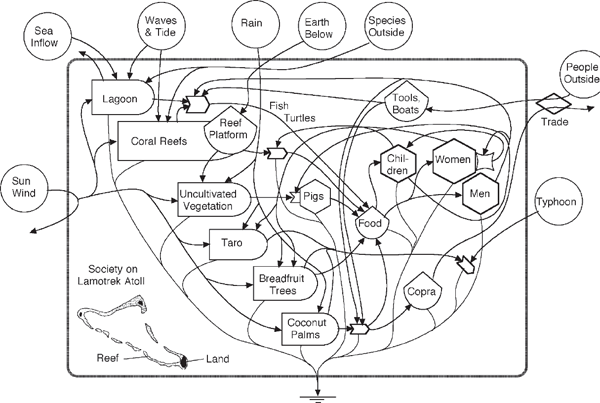
FIGURE 7.2 Example of low-density society in a stable system of several ecosystems, the Pacific coral atoll at Lamotrek. The diagram summarizes in system form the data given by Alkire (1965).
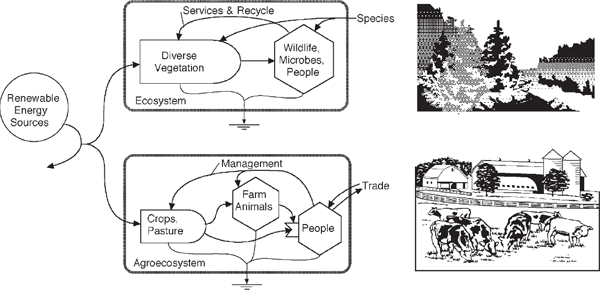
FIGURE 7.3 Substitution of agroecosystems with crops, farm animals, and higher population densities of people for the hunting and gathering ecosystem, both operating on renewable energy of sun, wind, and earth.
When inputs of climate and land are stable (fig. 7.2), the diverse ecosystem can displace the simplified version because the diverse one is more efficient. Diverse ecological systems successfully compete with and displace simplified agroecosystems when environmental conditions are stable and there are no periods of severe cold, drought, or other life-limiting circumstances. Forest soil stores seeds, which explode in germination when exposed to the sun. Unless special energies are directed to prevent succession, the complex system with its division of labor and services draws in more resources and displaces crops whose energies are going only into weedy storage. If left alone, succession covers the ground and displaces agricultural crop plants (fig. 3.12).
Where water and nutrients are scarce, the well-adapted natural ecosystem overcomes these limits by applying its budget of available energy. For example, desert plants have water conservation adaptations such as water-storing structures, deep roots, and means for opening stomata only at night. Nutrients are tightly recycled, aided by the work of animals. Under natural conditions, the gross photosynthesis of the complex system probably cannot be exceeded, for most of its yield assists production.
Even though natural complexes export little, they do have high gross photosynthesis (table 6.1). The natural systems found in each area may have already overcome limits, except the inescapable one of available light. Self-management by complex consumers is diagrammed at the top of fig. 7.3. The potential yield of food is small because much of the energy goes into necessary work. In the bottom diagram of fig. 7.3 people and their farm animals replace wild species.
Table 7.1 lists data on production and energetic efficiency of agricultural systems converting solar energy. Compare these with data on production by the natural systems developed through millions of years (table 6.1). The gross photosynthesis (P) of the natural systems in each belt of the earth indicates the upper limit of the sun’s conversion for any alternative system using the same inputs. Usually the efficiency of light conversion by agroecosystems is much less because weeding and harvest leave the ground bare or poorly covered with chlorophyll for part of the year.
TABLE 7.1 Agricultural Food Production
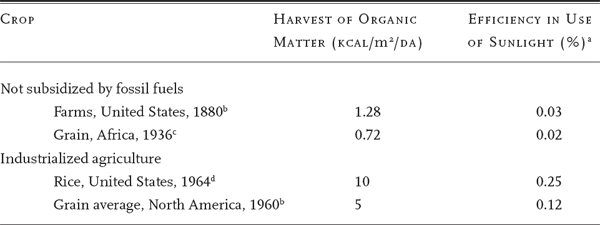
a Calculated with 4,000 kcal/m2/day sunlight.
b Parker (1963).
c Brown (1965).
d President’s Science Advisory Committee on World Food Production (1967).
Agriculture in Pulsing Regimes
The story for the zones of the earth where there are sharp variations and severe fluctuations in climate and hydroclimate is quite different. Where drought and heavy rains alternate or where sea salinities vary drastically, a system either diverts great energies into special physiological adaptations to the fluctuations or, when conditions are too severe, continually establishes and reestablishes its system after unfavorable periods. Special adaptations are developed for recolonization or seasonal cycles. The systems of nature that developed for the fluctuating environments have little energy to evolve many specialized species for a division of labor. Most of the energy goes to a few species that program timely seed dispersal, germination, growth, energy storage, flowering, fruiting, and arranging stages.
In other words, the systems of nature that have evolved in the zones of fluctuation on the desert borders, at the mouths of rivers, and in the polar regions are systems of a few species of pulsating populations, temporary large storages, and channeled energies. In such regions the natural system produces a few species in surges not unlike agriculture. In fact, primitive agriculture was really a capture of weedy net production systems in which the storages were concentrated in humans and their animals. Thus, systems of solar energy–based agriculture are competitive in areas of fluctuating environment but are subject to its variations, incurring frequent famine and losses to epidemic insects.
One of the ways humans adapted to pulsing climatic regimes was to become nomads, using energy storages to move with the fluctuating zones of favorable conditions. In so doing, people were one of the means for rapid recolonization and planting. Pulses of locusts, caribou, bison, fish, and shrimp migrate in these zones of the earth. Migrating at times and places of animal migrations helped tribes accumulate energy for travel. Vaneeta Hoon (1996) evaluated energy supporting the annual movement of buckwheat-based people from valleys to Himalayan highlands.
Pulsating agriculture based completely on solar energy takes advantage of seasonal pulses of rainfall to draw a high percentage of energy into a culture. The disadvantages of short duration and fluctuations limit primary production, but fluctuations, whether from natural causes or arranged by the farmer, are necessary to a harvest. Unfavorable seasons keep out more complex associations of animals and plants that would divert energies from the harvest. Pulses apparently favor humans because of their planning and social skills. A program of seasonal planting competes well with the competition of annual weeds. Some very effective systems of agricultural society evolved in the monsoon, prairie, and savanna belts of the earth, which have growing periods alternating with dry conditions.
Seasonal Rice and Cattle
Rice is one of the most successful ancient systems for supporting dense populations (one person per acre) based wholly on natural energy in monsoon climates. Farm animals are used as energy transformers to do the necessary work of planting, fertilizer spreading, high-protein synthesis, energy storage, and weeding. Main energy pathways for the rice-cattle system in India are shown in fig. 7.4. People and their animals have the energy storage to inject a fast start for the agricultural crop, putting it ahead of possible competitors when the cool, moist winds and rains from the Indian Ocean return in June. At this time, agriculture and the ecosystems start over after the parching spring temperatures of up to 120°F (49°C).
Religion as an Energy Program: Sacred Cows
Figure 7.4 shows energy flows in the system of rice and sacred cows that was typical in India. The work of humans and bullocks accomplished necessary functions, which included nutrient cycling and processing of dung for fuel and fertilizer. The network runs well on sunlight energy, with control loops and features of stability in the otherwise unstable environment of the monsoon. In India the cows are sacred to part of the population. Some people have advocated eliminating the sacred cows in order to skip the extra mouth and shorten the food chain. But Marvin Harris explained how the cows glean nutrition from different food chains, produce the bullocks that are necessary for the agricultural pulse, recycle the minerals, and provide some critical proteins through milk (Harris 1965). He quoted Gandhi as saying that the cows are sacred because they have practical value. Figure 7.4 shows their useful roles. Perhaps one of the tasks of religion is to provide appropriate programs of energy control. See chapter 11.
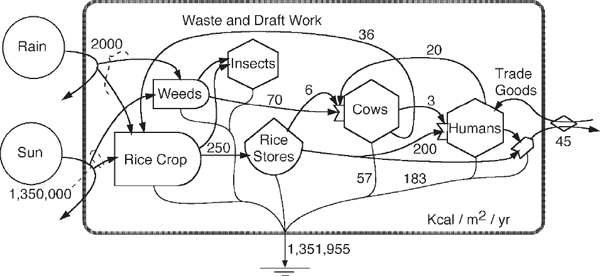
FIGURE 7.4 Sacred cow agroecosystem of India, operating with the sharp seasonal pulse of monsoon wet and dry seasons. Relationships were suggested by Harris (1965). Data are for tropical dense populations with 640 people per square mile, 0.1 animals per person; Indian grain yields 250 kg/acre/yr (Brown 1965). One farm animal is shown for every 10 people. One-third of the food calories of cattle remain in feces. Work and fecal fertilization are taken as half of animal metabolism. The animal protein intake for India was about 6 g/person (Brown 1965); 2% of the food crop was fed to animals. Animal metabolism was 8,000 kcal/day (Kleiber 1961). Farm work was taken as 10% of total worker hours of population.
Artificial Pulse and Shifting Agriculture
Whereas grain agriculture in prairie and savanna climates was much like the seasonal restart of grassy natural systems, agriculture was quite different when complex forests had to be displaced. Despite competition from nature, agriculture was successfully introduced into stable forest regimes through a pulse generated with human effort. Forest plots were cut and the biomass energy of the logs and brush burned to open the ground to sunlight, release nutrients, and kill off insects and competing plants. The potential energy of the elevated crowns against gravity, amassed over many years, helped the work when trees fall. Thus, the energy accumulated in succession was used to undo its own work. Crops were grown for several years before the nutrients were reduced or the surrounding forest could reinvade. Then the land was allowed to go back into succession (fallow land) to restore the soils and energy to support another agricultural pulse later. A family could move from one plot to the next, not returning to the original plot for 20 to 50 years. This was shifting agriculture, and it worked as long as the population density was small. Both ecosystems and human cultures were supported.
A network diagram for shifting agriculture in fig. 7.5 shows an alternation between two main land uses: forest growth and subsistence gardens. Humans act as a system switch, controlling the start of agriculture through a small expenditure of cutting energy. The timing and nutrient storages permit an effective fall burn and subsequent crop growth. Systems engineers will recognize the start and abandonment as an automatic flip-flop. Families can receive continuous support by moving their settlements in rotation after a plot loses its fertility. The farmer’s plot, if it were not abandoned, would not hold the soil structure, provide enough energy to control the successional invaders (weeds and insects), or hold stabilized chemical cycles. Carter (1969) details the labor and social structure that accompany a workable shifting agriculture system in Guatemala.
The cycle of regrowth and soil restoration is rapid as long as the plots are surrounded by complex forest that is old enough to supply seeding. The natural ecosystem has many species for quick reforestation of openings. The diversity of the successional forest species and insects also works against any crop plantings. Many crops grown in high-diversity situations, such as cassava, yucca, and tapioca, have edible roots, which have some natural poisons against insects that have to be washed out before consumption by people.
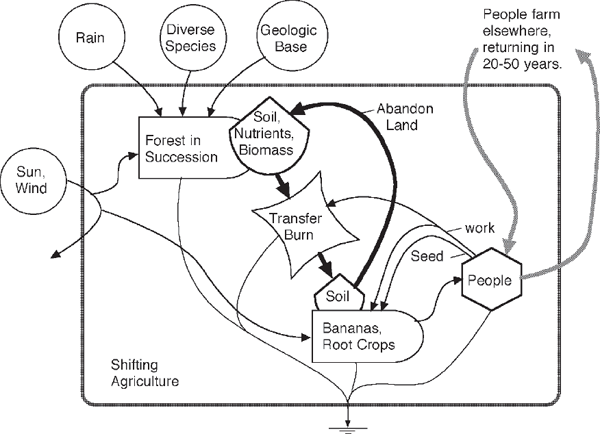
FIGURE 7.5 Energy diagram for shifting agriculture. Humans serve as a switching timer, shifting the stored forest emergy into food crops for several years before being forced to move on by nutrient shortages, loss of soil structure, insects, and weeds. Heavy lines indicate circular pathways of soil and people.
Agroecosystems Using Ecosystem Structure
In the moist tropics, many tree crops, such as cacao, are successful. Some crops such as coffee and tea are planted under the partial shade of trees, whose crowns are trimmed to let some daylight reach the crop. The crown trees provide a stable microclimate, roots to stabilize soil structure, transpiration to draw out excess soil water, nodules that fix nitrogen, and diverse habitat for animals that control insects. Yields are less than those of crops in open fields, but they are less vulnerable to disturbance. Under the canopy the ecosystem provides protection and support functions to the crop plants.
An example from the Congo uses corridors of rotation and is based on an old system of shifting cultivation developed by the Bantu peoples (Turnbull 1963). The short cultivation phase ends with a shade crop, which helps reestablish the complex successional vegetation quickly, thus restoring the mineral cycle, soil structure, and the canopy that will permit a new cycle after later cutting.
Before the Industrial Revolution in agriculture, the world was fed with thousands of varieties of plants adapted to yield food, clothing fiber, and housing. These agricultural systems used only renewable energies and knowledgeable management by rural people. There were agricultural varieties for all the special climate conditions over the earth. With the decline of fossil fuels, these varieties will be needed again. There is an urgent need to keep these varieties from going extinct during the current period of intensive agriculture based on nonrenewable energy, which is discussed next.
NONRENEWABLE, FUEL-BASED CIVILIZATION
Beginning two centuries ago, many countries began to develop an entirely new basis for power using coal, oil, virgin forest storages, atomic fuels for nuclear power, and other nonrenewable resources to supplement renewable energy. Concentrations of available energy of moderately high transformity had accumulated from the environmental work by the earth’s emergy for millions of years. Although knowledge was required to develop machines to couple these power inputs to human society, the real basis for progress was the entirely new energy sources that were an order of magnitude greater than previously available to people. Excess energies were available for further research to obtain more fossil fuels and to apply them in supporting people. The subsequent progress was like a flash explosion. The energy added to agriculture increased yields, as shown in fig. 7.6b. In chapter 6 we learned that most of the energy of the natural ecological cover was used for the many functions required for survival: competing, recycling, and holding structure. When these functions were carried out using the new energy sources, more of the gross photosynthesis became available for storage and yield to human consumers. The work that used to be done by the plants, animals, and rural farmers using environmental energy was done directly and indirectly by fossil fuels.
Fossil fuels were substituted for feedback work processes of the older systems, interacting with but not replacing the photosynthetic use of solar energy. There is no evidence that 100 years of research has increased the efficiency of photosynthetic conversion of solar energy. Apparently a billion years of evolution had already achieved the thermodynamic limit described with figs. 3.3 and 3.5.
As more and more calories from outside were substituted for the necessary work, more of the gross production could go into net food yield. By substituting for system work, fuel-based inputs released more yield. The fossil fuel energies were applied to the system at the point where there was feedback work and often in a magnitude greater than could be derived by concentrating solar energy. More energy was applied to defeat invasions of alternative natural ecosystems. Fossil fuel energy was directed to supply any necessary materials. The added energy was amplified by increasing flows of limiting factors. Figure 7.6b shows the system after substitution, and table 7.1 summarizes the yields attained. Lester Brown (1965) called the jump in agricultural yields “take off.”
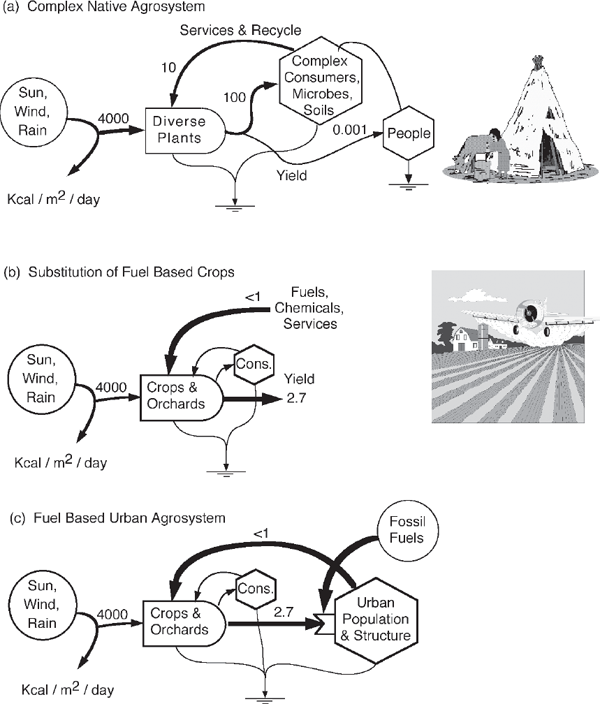
FIGURE 7.6 Comparison of yields to humans in hunting–gathering–gardening system with those of transformed agriculture based on fossil fuels and specialized crop varieties. (a) Small net yield to low-density society from self-sufficient varieties in complex ecosystems; (b) high yields after fossil fuels have substituted industrial services for the functions of those natural species, releasing more of the basic production to yield; (c) transformed system of intensive agroecosystems and urban society. Work flows aided by the urban system include mechanized and commercial preparation of seeding and planting, replacing the natural dispersion system; fertilizer excesses, which replace the mineral recycling system; chemical and power weeding, replacing the woody maintenance of a shading system; soil preparation and treatment to replace the forest soil-building processes; insecticides, which replace the system of chemical diversity and carnivores for preventing epidemic grazing and disease; and development of varieties that are capable of passing on the savings in work to net food storages. New varieties are developed as diseases appear, thus providing the genetic selection formerly arranged by the forest ecosystem. The different kinds of available energy flows are not measures of equivalent work until expressed in emergy units. In fig. 7.6a people living at a density of 1 per square mile (2.6 km2) and daily food consumption of 2,500 kcal consume only about 0.001 kcal from each square meter of their territory. In the intensified agriculture of fig. 7.6b and 7.6c, 170 people per square mile supported 32 times this number in cities when the level of grain production in the United States was about 1,000 kcal/m2/yr (Brown 1965). Costs of services from the fuel-based economy were about $54 (1965 $) per acre, and the emergy/money ratio was 2.5 E12 solar emcalories per dollar. The empower feedback from society (counting only services) was the product, 1.35 E14 solar emcal/acre/yr (8.9 E4 solar emkcal/m2/day), 22 times the emergy of the sunlight.
Abundant food rolled out from huge fields that were developed with the new industrialized agriculture. The fields were sown by machinery, tilled by tractors, and weeded and poisoned with chemicals. Epidemic diseases were kept in check by great teams of scientists in distant experiment stations developing new and changing varieties to stay ahead of the evolution and adaptation of disease. An example is the intensive cornfield agroecosystem of Illinois (fig. 7.7). Soon a few people were supporting many, and most of the rural population left the little farms to fill new industrial cities, where many of the jobs were manufacturing the inputs to the new agriculture (fig. 7.6c).
Potatoes Made Partly of Oil
The high yields from industrial agriculture generated a very cruel illusion because the citizens, the teachers, and the leaders did not understand the energetics involved and the various means by which the energies entering a complex system are fed back as subsidies indirectly into all parts of the network. With conceit, the enriched people imagined that progress in agricultural yields resulted from new know-how in the use of the sun. A whole generation of citizens thought that higher efficiencies in using the energy of the sun had arrived. This was a sad hoax, for people of the developed world no longer eat potatoes made from solar energy. In fig. 7.6b the food reaching the humans is produced mostly by the energy subsidies in support of all the human services required. People are really eating potatoes made partly of oil.
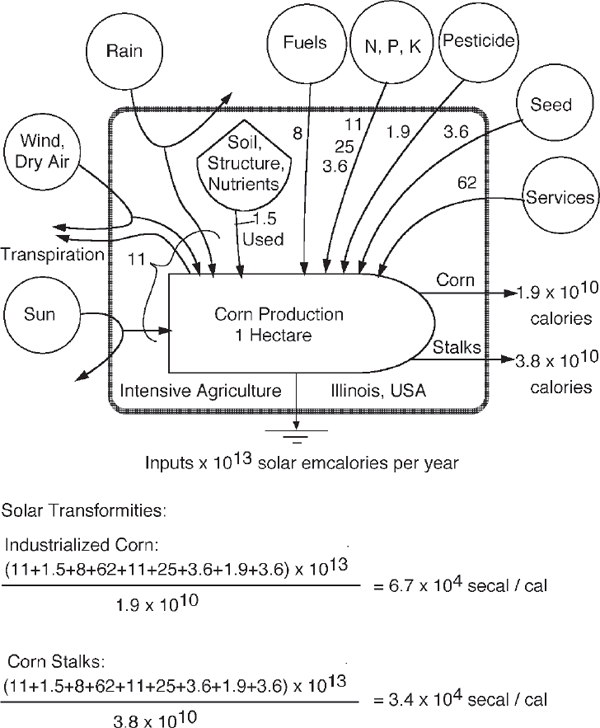
FIGURE 7.7 Emergy evaluation of intensive corn agriculture in Illinois (after Pimentel and Hall 1984).
Much of the power flow that supports intensive agriculture is not used on the farm but is spent in the cities to manufacture chemicals, build tractors, develop varieties, make fertilizers, and provide input and output marketing systems, which in turn maintain mobs of administrators and clerks who hold the system together. As we stand on the edge of the vast fields of grain, with tractors and production as far as the eye can see, we are tempted to think human brilliance has mastered nature. However, the plain truth is that fuels are being substituted for plant and animal functions, releasing more of the photosynthetic product to go to consumers. Wherever the flow of industrially organized fossil fuel is missing or the work from a fossil fuel culture is eliminated, the agriculture possible is only what it once was or even worse, for the know-how of self-sufficient agroecosystems and varieties is disappearing.
People from an industrial–agricultural region who go to a low-energy country to advise on improving agriculture can help only if there is a cheap fuel supply for another zone of fossil fuel agriculture. As fuel prices rise and fuel use decreases, the advice will come in the opposite direction.
Citizens in industrialized countries think they can look down on the old system of humans, animals, and subsistence agriculture that provided a living for a few people from an acre or two in India when the monsoon rains were favorable. Yet if fossil and nuclear fuels were cut off, we would have to find people still farming in older ways to show the currently affluent citizens how to survive on the land while the population was being reduced to make it possible (chapter 13).
Figure 1.4 (chapter 1) compares an island economy before and after the new fuel input, summarizing the changes from environmental base to fossil fuel–based agriculture in macroscopic view.
Rotation Needed for Intensive Agriculture
Many kinds of intensive agriculture are not sustainable because they are based on initially rich soils that are not sustained by low-diversity agroecosystems. Rotation of the lands through a high-diversity successional restoration is required, just as in the earlier shifting agriculture. Such rotation includes seeding from a complex ecosystem with diverse plants, animals, and microbes for soil restoration. Thus sustainable intensive agriculture requires that ecosystem areas be distributed among the intensively farmed areas. Figure 7.8 shows the optimal ecosystem seeding area for maximum economic output. Figure 7.8b was generated from a computer simulation.
Diminishing Returns of the Energy Subsidy to Agriculture
Every kind of energy flow must interact with and mutually amplify another flow of higher or lower transformity (chapter 4). To increase production, fossil fuel inputs must amplify conversions of environmental and marine resources. However, the increasing inputs of machinery, fertilizer, and pesticides in agriculture have a diminishing return as other factors, such as water and sunlight, become limiting. World agriculture is reaching its ceiling because most of the fossil fuel–based inputs are in excess, and there is little fertile land available to expand production and little water for irrigation. In fig. 7.9 the curves of productivity as a function of increased irrigation energy, fertilizer, pesticides, and equipment follow the classic limiting factor curve explained with fig. 3.10b.4
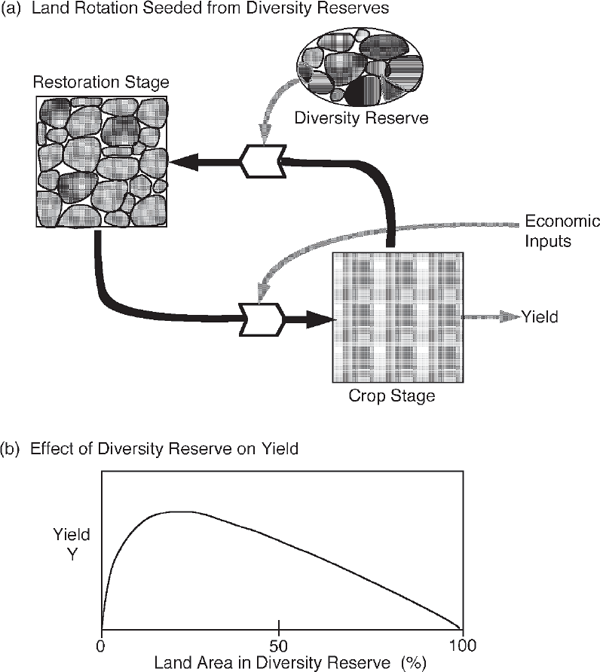
FIGURE 7.8 Role of high-diversity reserve areas in accelerating the restoration stage in land rotation. (a) Three kinds of areas required for sustainable land rotation; (b) result of computer simulation showing yield as a function of the area reserved for high-diversity ecosystems to supply seeding (Odum 1962).
The various kinds of agricultural systems form a series, from the primitive ecological one with people as a minor component to the modern regime with human food from petroleum subsidy of intensified agriculture (fig. 7.9). Yield increases with added emergy use but with diminishing returns.
As the fuel use increased, the number of agricultural species and genetic varieties decreased. At the same time, however, the variety of urban occupations involved increased. By this theory the number of occupations of people and the number of species in the system are complementary; an increase in one entails decreasing the other.
Algal Culture and Fallacious Dreams
Another cruel illusion was proffered by laboratory scientists and writers who proposed to feed the world on algae, which they implied were productive on a different order of magnitude from agriculture. The carrying capacity for a person (sunlight area required) was said to be only half of a square meter. Two main fallacies were involved, but before they could be proved, those with a little knowledge were attracted by the subject and popularized it with articles published in leading magazines. The ocean was said to be able to support expanding populations indefinitely with algae. When practical attempts at farming algae were made, the yields came out to be the same as the maximum yields from agriculture and the products not as edible.

FIGURE 7.9 Food yields as a function of the fossil fuel emergy used directly and indirectly, both expressed in empower units.
One of the fallacies was the assumption that the high photosynthetic efficiency of chloroplasts (green units in plant cells) at low light intensity (20–40% at 1/100 daylight) is the same at bright light. This is a thermodynamic error. There is an inherent inverse relationship of light intensity and efficiency in energy conversions (fig. 3.3).
The second fallacy lay in consideration of the algae in pure cultures, free from their supporting ecological system. In ecosystems, photosynthetic producers require mineral cycles, the diversion of much energy into various networks for stability, and the maintenance of extensive structure and controls for survival, as we have already discussed. In the laboratory tests, all these elements were supplied by the fossil fuel culture through thousands of dollars spent annually on laboratory equipment and services to keep a small number of algae in net yields. On the scale of pilot plant tests, costs representing human service inputs were huge. Until all these dollar costs and human services were considered, the advocates imagined that they had higher efficiencies of net yield. The erroneous omissions are illustrated in fig. 7.10. Gross yields were the same as high yields in other systems, and net yields were higher because fossil fuels had provided the work necessary for system operation, in the same way that fossil fuels now subsidize potatoes.
Electricity from Algae
As mentioned in chapter 3, Beyers and Odum (1993) studied the production of electricity from photosynthesizing blue-green algal mats (fig. 3.4). The solar transformity of this low, spatially dispersed voltage was (2,000 solar emcalories)/(0.32 calories of electricity)=6,250 solar emcal/cal. To provide 110-volt power, which has a solar transformity of 170,000 secal/cal, a further concentration of 27 times is required. These data are helpful in showing how dispersed solar energy conversions must be concentrated after capture to support the intensive needs of an information society.
Fuel-Rich Farm Animals
One of the conceits of our fossil fuel–based agriculture is pride in new varieties of beef cattle, sheep, chickens, and other domestic strains of animals that yield much more protein food than the older varieties used by primitive societies. The citizen assumes that this is a permanent advance that secures for agriculture a high yield and that we will never have to go back to self-sufficient animals.
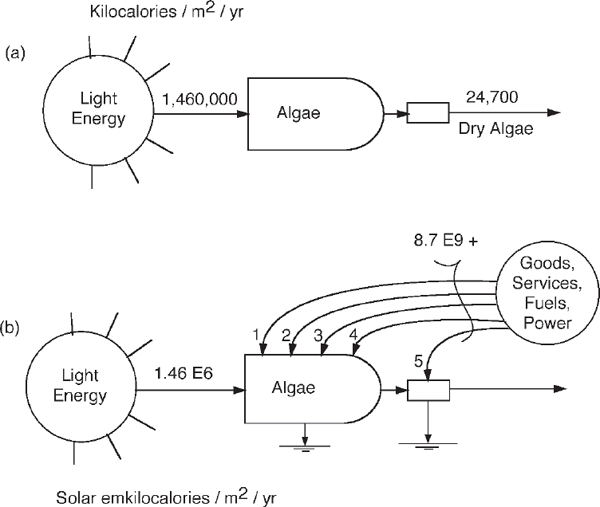
FIGURE 7.10 Energy and emergy flows in a food-producing algal pilot plant operated by Arthur D. Little company (Fischer 1961). A yield of 20 tons/acre was obtained. A year of insolation provided 1,460,000 kcal/m2 input (400 langleys/day), with gross production 10%. A high rate of flushing maintained cells in a rapidly growing state, with a high ratio of photosynthesis to respiration. Potential· energy was calculated from algal weight as 5 kcal/g dry weight. Costs of the installations were spread over an estimated 10-year lifetime. The dollar costs of $2.8/m2/yr were converted to emergy using 10,000 kcal of fuel emergy per dollar spent. (a) Diagram showing solar energy conversion (kilocalories) with all other inputs omitted; (b) diagram including all inputs expressed in emergy units (solar emkilocalories): (1) fertilization, (2) stirring, (3) containing and distributing, (4) controlling growth, and (5) concentrating for harvest.
This belief is based on energetic fallacies. Genetic breeding and biotechnology have carefully eliminated many of the special energy-using abilities of these animals so that their food can go into maximum net growth. The farmers supply all the old functions with fossil fuel subsidies. Figure 7.11 compares animal husbandry with and without the work of fossil fuel.
We now have chickens that are little more than standing egg machines, cows that are mainly udders on four stalks, and plants with so few protective and survival mechanisms that they are immediately eliminated when power-rich management is withdrawn. Such varieties are complementary to high-emergy agriculture and cannot be used without it. Because animals are concentrated on the landscape and genetically similar, they are vulnerable to epidemic diseases such as the international outbreaks of hoof and mouth disease in 2001.
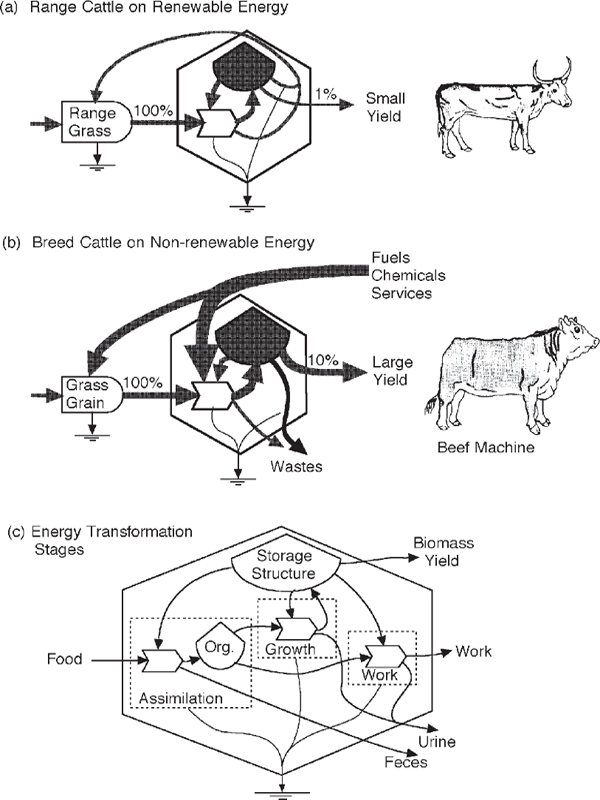
FIGURE 7.11 Comparison of yield of self-sufficient animals harvested from renewable, environmental energy range with the transformed herds and many functions replaced with fossil fuel inputs. (a) Energy systems diagram of cattle on environment-based range; (b) diagram of high-yielding cattle with intensive use of inputs based on fossil fuels; (c) diagram of energy transformations in consumers evaluated in table 7.2. Org., organic matter.
Referring to table 7.1, we find the efficiency of gross plant production to be about 2% and that of transfer to the animal consumers (herbivores) to range from 0.5% to 49% (table 7.2). The high efficiencies of growth by the steer under fattening diets occur when the animals are not running about doing their own support. Some of the food substances may be digested, assimilated, and deposited without much metabolic processing. Even higher yields are obtained if protein foods are used. This may violate the principle from chapter 4 that energy is wasted when energy is used of higher transformity than necessary or is used for a function that works with a lower-transformity input. Mad cow disease developed from feeding cows meat packing wastes (agrocannibalism).
TABLE 7.2 Efficiencies of Food Chain Transfer in Animalsa
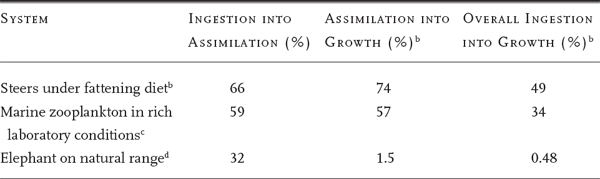
a If population is exporting at the same rate as new growth occurs, the population is at steady state. Animals include populations of stomach microorganisms that eat and process food, yielding nutritive substances to host.
b Brody (1945:82).
c Means of medians of 10 groups of data from literature and 12 other experimental studies (Conover 1964).
d Petrides and Swank (1964).
To operate agriculture without energy subsidy, we must have cows that can fend for themselves in reproduction, protect themselves from weather and disease, move with the food supply, and develop their own patterns of group behavior. Competitive plant species are required that can also provide reasonable growth in unfertilized soils, despite losses from insects, and so forth. Naturally, the yields of net food have to be less, and no amount of genetic breeding will help.
Overfishing and Natural Capital
Boats, fuels, fish-locating sonar, refrigeration, and trained labor for fishing became cheap because of fossil fuels. A huge onslaught on fish populations and the global fisheries began with development of high-powered ships and giant nets. They stripped the lakes and seas of one fish stock after another, trading sardines for herring, then salmon, cod, and finally haddock. As each fish species became scarce, its price increased, helping the markets to pull down the remaining stocks until there was little reproduction. Fish stocks are necessary to sustain fish production. Stocks necessary for autocatalytic growth and reproduction are called natural capital. Efforts to manage each fish population to seek the optimum stock for maximum yield failed because the models did not include the whole ecosystem. Fish stocks reduced by fishing were displaced by competitive populations of little food value. For example, sometimes jellyfish replaced edibles.
In other words, fossil fuel fisheries mined the seas. To be sustainable, a system organization has each unit contributing work back to its system so as to reinforce itself in a loop (chapter 4). Even intensive agriculture works to sustain the productivity of the land, but fossil fuel fishing fed nothing back to reinforce the fishery food chain. Whereas fisheries had the highest net yield of protein food for the effort before industrial ships, soon the fish were mostly gone, and the fish prices were higher than those of luxury beef.
Fuel-Subsidized Aquaculture
Some commercial fishing from public waters was replaced by industrialized aquaculture of freshwater and saltwater ponds. Directly and indirectly, fossil fuels changed aquaculture in ways parallel to terrestrial agriculture. In fig. 7.12, representative data on yields for three energy situations are shown by the energy systems diagrams. The first group, with only sun, yields up to 4 g dry weight/m2/year (40 kg/hectare/yr), depending on natural fertilizer conditions. With the energy of inorganic fertilizer added, yields are higher, and in the third group, with organic foods added that feed the fish more directly, yields go to 200 g dry weight/m2/year (2,000 kg/hectare/yr). Both inorganic and organic inputs became cheap and easy to add, as fossil fuels enriched nearly everything.
All over the tropical world, intensive aquaculture of shrimp was developed in coastal ponds using fuels, electric pumps, fertilizers, chemicals, and human services, all based directly and indirectly on fossil fuels. Thousands of ponds were constructed in coastal Ecuador, displacing the mangroves and that source of livelihood for local people. The ponds were seeded with larval stages from declining natural shrimp populations and from artificial laboratory culture. Shrimp raised in ponds for several months were harvested and sent to developed countries at prices competitive with those of shrimp from coastal trawlers. The prices were too high for most people in Ecuador, and much of the emergy was sent out of the country, with much less emergy in the buying power of the money received in exchange (see chapter 9). A few people made money, but the displaced local people drifted to the cities seeking jobs, the same displacement that occurred when fossil fuels intensified agriculture. The shrimp ponds and their exports enriched developed economies that imported them at the expense of the undeveloped countries (see explanation of emergy imbalance in trade in chapter 10). Over time, yields began to diminish. Genetic variety was lost; the ponds developed diseases and competitors. Intensive aquaculture, like intensive agriculture, may require rotation and a reservoir of natural diversity.
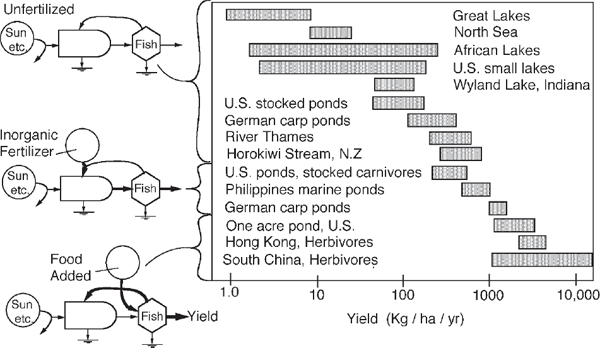
FIGURE 7.12 Yield rates from fisheries and aquaculture, redrawn from Mann (1965) with energy systems diagram to show the energy sources. Inputs increase from top to bottom: unfertilized waters above, waters receiving inorganic fertilizer nutrients next, and ponds receiving organic foods below.
In cold temperate waters, intensive, fuel-subsidized salmon culture was developed. Floating pens (cages with water passing through screened walls to the young salmon kept inside) were placed in estuaries and seeded with juvenile salmon from fish hatcheries. Many of the fish hatcheries were subsidized by fossil fuels. They were based on salmon tricked into returning from the sea to the hatchery because salmon follow the smells from waters in which they were first released. The pens require that the estuarine waters around them be clean and low in nutrients. The density of pens is limited when the wastes from the pens make the water unsuitable because of the algal and microbial blooms caused by the excess nutrients (Odum 2001). Emergy evaluation found pen-raised salmon with similar transformity to the natural migratory stocks: 1.7 E7 secal/cal (Odum 2001).
Direct Conversion of Fossil Fuel to Food
Among many ideas for using fossil fuels to support agriculture is their direct conversion into food. Humans cannot eat fossil fuels directly because the fuel molecules are not digestible. But in World War II, under the stress of failing food supplies, oxidized petroleum was used to make an edible fat in Germany. Many microorganisms readily digest hydrocarbons, and the microbial products can support a food chain. Various microbial systems were tested. McPherson (1964) reported yields from a microbial, methane-based system tested by the Shell Development Company. The efficiency of producing organic food that is half protein was around 10%, not unlike that of natural food chains.5 On an emergy basis, the gas input was 2.2 E12 secal/kg, and the service input was 1.44 E12 secal/kg (total input=3.64 E12 secal/kg). If the kilogram of food contained 4.6 E6 gram calories, the transformity of food from natural gas conversion was 8.1 E5, a value in between corn and beef (quotient of input emergy/product energy).
Converting the fossil fuel to food was less efficient than using the fossil fuel to amplify solar production by supplying limiting materials. Recall the energy matching principle from chapter 4 in which each quality of energy has maximum effect when it interacts with energy of higher or lower transformity.
EMPOWER AND CIVILIZATION
Electric Empower
Over the last century, the emerging civilization stepped up to electric power. Fuels could be converted into electric power, a more flexible form of energy of higher transformity, one capable of supporting people in concentrated cities, extending the time of work through night lights, and processing information. Fuels were consumed in boilers, and the difference in temperature between the steam and the environment was used to operate heat engines arranged to turn electric generators.
Electric power was also generated from river dams that diverted the geopotential energy of elevated water away from its normal work developing river basins, sediments, wetlands, floodplains, valley productivity, and coastal ocean currents.6 Many of the rivers of the world were dammed, taking energy away from these life support processes. As we explained in chapter 5, precipitation in mountains has a high empower content, organizing much of the surface geology of the earth. The mind-set of a culture of fast growth based on exploitation saw the rivers as energy not in use. When some rivers in the western United States were dammed, electricity was sold for money worth a tiny fraction of the emergy value in the power received and used wastefully. For instance, the city of Las Vegas, Nevada, developed giant lighted signs, gambling casinos, and entertainment palaces with the cheap electricity. In what way, if any, did the dam reinforce the society and environment compared with the loss of river functions? By 2000 dams with little contribution were being removed to preserve salmon runs. chapter 13 discusses this and other adaptations for a lower-energy future.
Nuclear Power
In the last half of the 20th century, the nuclear fission process was developed, and more than 400 nuclear plants were built worldwide. These plants control radioactive chain reactions that generate intense heat. Because the temperature at the core is too high, various cooling methods are required to disperse some of the heat until the temperature is low enough to operate machinery without melting the metals. Nuclear fission uses concentrated uranium ores, which are mined in many places, but the supplies are limited. Nuclear electric power is a nonrenewable energy source.
At first nuclear power was taking more emergy from the economy than it yielded because of the large inputs required to enrich the uranium, build the complex installations, pay interest on the capital, and deal with the frequent interruptions in service experienced in the early days of their operation. Later, problems were solved, more efficient enrichment processes were found, and there were years of sustained power output with net benefit (table 7.3). After runaway chain reactions released radioactivity at Three Mile Island, Pennsylvania, and Chernobyl, Ukraine, few nuclear plants were built. But many countries had become dependent on nuclear electric power. Today, many of the more than 400 plants are reaching the end of their 30- to 40-year expected lifetime, and it is not clear whether they will be replaced. Like fossil fuels, nuclear fuels are becoming a little scarcer each year and thus more costly. Some of the radioactive fuels in atomic bombs from the old Soviet Union are being converted for use in nuclear power plants.
Breeder Reactors
Nuclear fission power plants that use enriched uranium generate the chemical element plutonium in their fuel rods as a byproduct. Plutonium can also sustain chain reactions and therefore is usable in atom bombs or, when controlled, to fuel nuclear power plants. The arrangement for processing plutonium from nuclear fission to make more power has been called a breeder. But to get the intensely radioactive plutonium out of the old fuel rods and into the form needed to operate more power plants, very expensive robot operations are needed. Plutonium is highly toxic and if ingested goes directly to the bones, causing bone cancer. Human beings are the most sensitive of all organisms to radioactivity and cannot physically handle the old fuel rods. Because of the costs and toxicities, and because plutonium can be made into weapons, President Carter canceled breeder work in the United States. France operated a breeder reactor for a time, sending some of the rods to Japan.
Electric Power and Information Centers
The global development of electric power led to global communication, computers, space satellites, television, and the information revolution, which are evaluated in chapter 8. The world is now covered with networks of interconnected electrical power lines. These are the basis for the cities in which most people now live. People switching on quiet devices and house lights in the cities are so far from the huge, throbbing, noisy, waste-generating power plants that they take for granted their clean luxury living. Their lifestyle is based mostly on fossil and nuclear fuels, and the reserves of these are disappearing.
EMPOWERED CITIES
The energy systems network of the planet starts with the sun and earth and converges to people and the centers of society in cities. The centers feed back out to the landscape pulses of control action, material recycle, and other high-quality work that reinforces the empower of the whole system (chapter 4). Human societies could develop higher emergy and transformities and prevail over alternatives by locating their centers in places where environmental energies converge naturally. The convergence of river networks is shown in fig. 5.10. For example, the civilization of ancient Egypt developed at the junction of the Nile River from the south and the distributary channels that connected the river with the Mediterranean Sea to the north.
TABLE 7.3 Emergy Yield Ratios of Sources Measuring Net Benefit to Society
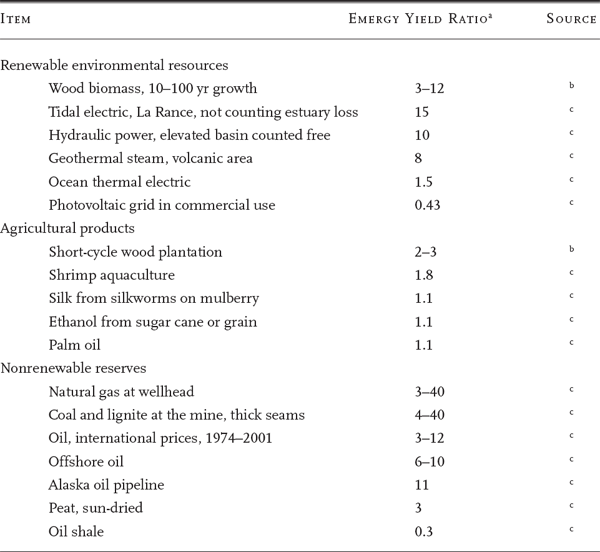
a Empower of yield divided by the empower from the economy for necessary processing (fig. 7.16), a measure of net emergy.
b From Doherty (1995).
c Various references summarized in Environmental Accounting (Odum 1996).
Agrarian Cities
In agrarian times, without many nonrenewable inputs, important cities developed where environmental energies converged. After a time, accumulations of energy, matter, and information in these city centers were enough to set off progressive pulses of cultural frenzy. Seen from space, the earth was like a Christmas tree with flashing lights, where each light was the surge of civilized progress organizing an area for a time. Some of the information on new innovations from each center, if shared broadly enough, was available to help the ascendancy of later cultures in other areas.
In energy systems diagrams, cities are on the right of the convergence of successive energy transformations. Cities are the source of the feedbacks of control and recycle that disperse to the rural areas from right to left. Figure 7.13a shows some components of an agrarian landscape and the corresponding energy systems diagram, when the items are arranged from left to right according to scale of time, space, and transformity.
Fuel-Based Cities
Since the fossil fuel revolution, human societies have been located mostly in great cities. As explained by energy hierarchy principles of self-organization in chapter 4, the centers contain large emergy storages, high concentrations of activity (high empower density), and high-quality work (high transformities and storms of pulsing activity). Although agrarian landscapes converge emergy from rural sources to support their cities, the cities of the 21st century directly receive the concentrated fossil fuels for processing in the cities. Then the products spread out, with matching interaction over the landscape (fig. 7.14). Figure 7.13 compares the fuel-based city with the agrarian city.7
Shu-li Huang (1998) and students evaluated the emergy basis for the city of Taipei, the center of Taiwan (fig. 7.15). It developed in a valley surrounded by mountains and a river delta, a natural convergence of high emergy. Similar study was made of the emergy basis for Jacksonville, Florida (Whitfield 1994), where several rivers converge, connecting with natural harbors suitable for trade.
The Automobile City Lifestyle
The human being is a complex hierarchy of many scales organized together, from biochemical molecular processes to the complex information processing in the brain. Homo sapiens evolved as part of social groups interacting with a landscape of ecosystems. Apparently inputs from the green environment are important to maximum function. People seek the input from nature or parks, even when they live concentrated in the cities.8
While people were migrating to the cities, fossil fuels were cheap. The psychological need for ecosystems by people working in the centers caused pathological overuse of automobiles in cities. The simple design of people living as part of the central structure was displaced by suburban living and commuting (fig. 7.14b). Individuals sought individual cars for their freedom, their power, access to ecosystems, and the time they saved. The city was transformed by the great emphasis on transportation devoted to the oscillation of automobile people in and out. Individual cars and the highways to support the daily shuttle took over the city organization, destroying neighborhoods and causing slums to develop with great waste of emergy.

FIGURE 7.13 Comparison of energy distribution, systems diagram, and empower density of cities, (a) Cities at the center of agrarian landscape based on renewable energies; (b) urban landscape based on automobiles, commuting, and fossil fuels.
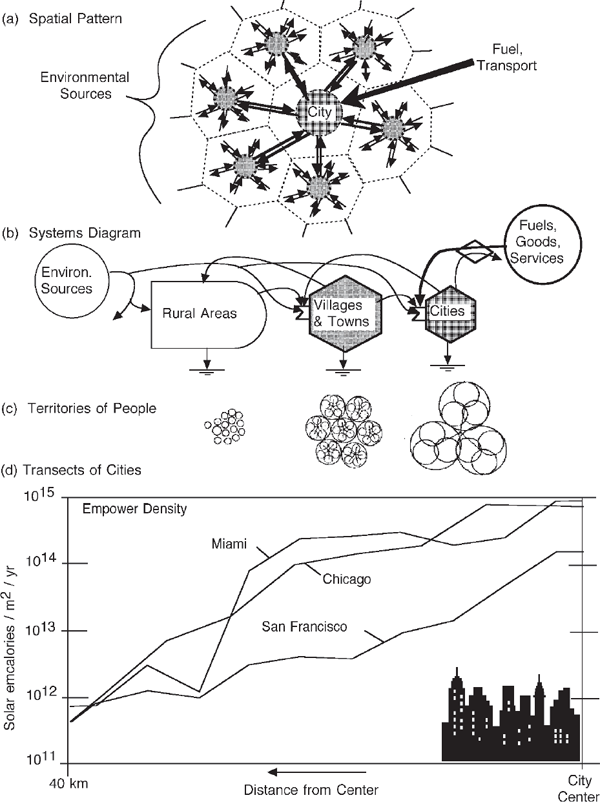
FIGURE 7.14 Characteristics of fossil fuel cities. (a) Spatial hierarchy of centers and transportation; (b) systems diagram summarizing energy and hierarchy; (c) radius of circulation of people indicating their territories (Doxiadis 1977); (d) empower densities as a function of distance from city centers. The transects in fig. 7.14d are averages calculated by Robert Woithe as part of the Cities project. For each city, six straight lines radiating out from the center of the city were drawn on land use maps. Empower densities for each type of land use were used from the study of Jacksonville by Douglas Whitfield (1994).

FIGURE 7.15 Spatial organization of the city of Taipei, Taiwan, indicated by the empower density (Huang 1999).
Emergy of Alternative Sources
Since the “energy crisis” of 1970s, millions of dollars have gone for research seeking primary sources to replace the fossil and nuclear fuels. A primary source is one that generates more empower than is used up in its processing. Ultimately, what a society can do depends on the net empower from its primary sources. The renewable empower of sun, tide, and earth was the primary source supporting agrarian society, now mostly integrated into the fossil fuel system. Each alternative proposed as a primary source for the future ought to be evaluated for its potential to yield net benefit.
NET EMPOWER
The idea of net empower evaluation is shown in fig. 7.16. A good source yields more emergy to society than is required from society for the processing. In other words, a good primary source has high net empower yield. In fig. 7.16, yield (Y) is greater than feedbacks (F). The ratio of yield to feedback is the net emergy ratio (Y/F). Net emergy ratios for hundreds of energy sources have been evaluated.9
Table 7.3 shows the net emergy ratios of the fuels used by society in the past. Agrarian society used organic products of photosynthesis such as wood and peat, with net emergy ratios of about 2 or 3. After fossil fuels were predominant in much of the 20th century, the net emergy ratio was 40 or more, an enormous increase that set the earth into its growth surge of benefits and calamities. Since the start of the Organization of Petroleum Exporting Countries in 1971, fuel prices have been higher, so that the fuels available to most economies have had a net emergy yield oscillating between 3 and 12, still enough to keep the earth in global economic expansion until now. Table 7.3 summarizes net emergy ratios for many energy sources. More details are given in a companion book Environmental Accounting (Odum 1996).
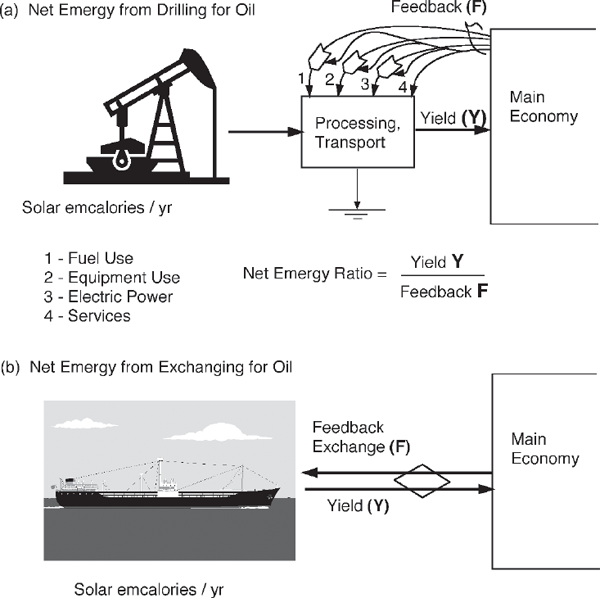
FIGURE 7.16 Diagrams for evaluating the net emergy contribution of primary energy sources (yield and feedback), here using oil as an example. Net contribution is measured with the emergy yield ratio (y/F). (a) Evaluation of oil wells; (b) evaluation of the oil obtained by foreign exchange, where F is the emergy that is bought by the oil supplier with funds received in payment.
The net emergy idea is so simple that it received public attention in 1975, and Senator Mark Hatfield helped pass a law intended to require net emergy evaluation of federal projects.10 In those days emergy was still called embodied energy, and the law confused energy with what is now called emergy. Consequently, net energy and energy yield ratios were calculated instead of emergy ratios. Agencies and industries thus made the error of counting all kinds of energy as if they contributed to work equally (chapter 3). This ignored the small energy but high emergy of human services, strategic metals, equipment, and indirect environmental damage. As a result, energy policy in governments and industries was based on the erroneous calculations that suggested that solar technology, ethanol from intensive agriculture, and short-rotation forest plantations could replace fossil fuels. Several billion dollars were wasted trying to extract oil from shale rock because neither Congress nor the industries paid enough attention to our calculations and public testimony, which showed no net empower (Odum et al. 1976).11
Net empower yield of something usually is highest before it is processed and declines as more and more emergy from society is used for mining, transporting, processing, converting, and distributing. For example, fig. 7.17 shows the successive steps in cutting, collecting, chipping, and transporting wood chips to substitute for fossil and nuclear fuels in Sweden12 (Doherty 1995). Wood in the forest has a net empower yield, but after the many transformations required to make wood powder, almost no net emergy is left. To support society, wood has to be used with less processing, as in the past. Less concentrated energy can support only a simpler society.
Not every source must have net empower, but a society cannot operate at all without at least one primary source that has the net contribution to support everything else. A primary source can help maximize a system’s total empower by bringing in other emergy sources, even if they are not a net contribution by themselves. For example, the equipment for solar water heaters is supplied by the fossil fuel economy to convert sunlight into hot water. There is no net empower contribution, but less fossil fuel is used than in direct water heating with gas or electric power.
CONCENTRATING SOLAR ENERGY
As explained in chapter 4, solar energy is inherently dilute. By the time it is concentrated to fuel status, its net emergy yield is small. Because of the success of industrial agriculture, people assume that net empower of solar production can be increased by more intensive farming or forestry practices. This is wrong, as proved by Steven Doherty (1995) in his analysis of forest production in Sweden, Puerto Rico, and the United States (fig. 7.18). The more often a forest is replanted and harvested, the less net yield. Very high yields come from forests allowed to grow a long time without much effort by society. In other words, the net empower of solar energy depends on time of growth.
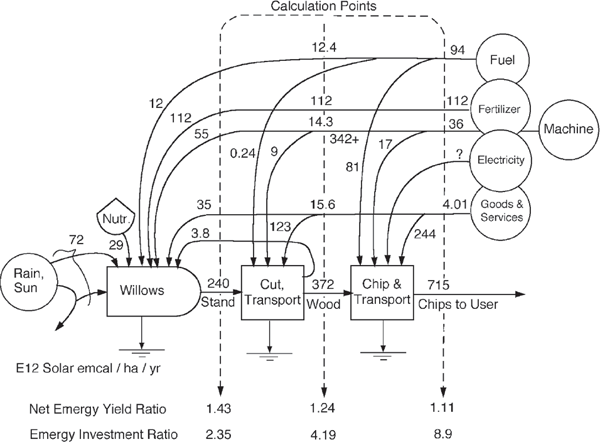
FIGURE 7.17 Energy systems diagram and emergy flows for Swedish willow plantations from Doherty (1995). Emergy yield ratio (yield emergy/feedback emergy) decreases with processing. Emergy investment ratio is the emergy fed back from the economy divided by the local free environmental emergy contribution. It measures intensity of contribution from the economy.
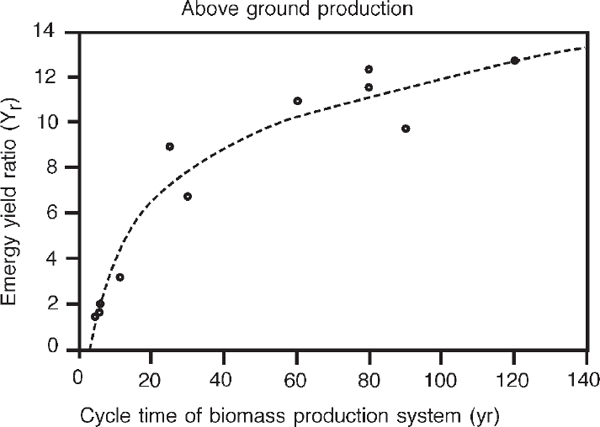
FIGURE 7.18 Net emergy yield ratio (Y/F in fig. 7.16) of forest wood production as a function of the time of growth between replanting cycles (Doherty 1995).
Many transformation steps are required to process and concentrate dilute solar insolation to high-quality electric power using organic photosynthesis of the chloroplast, which is the green plant’s photovoltaic cell (fig. 3.3a). With the intent of skipping steps, hardware photovoltaic cells have been researched for decades, trying to generate electric power from solar energy with net emergy, which would make them economical. But these designs ignore the energy hierarchy law (chapter 4) that requires many calories of available energy at one level to make a few calories at higher levels. Figure 7.19 compares electrical current generation from silicon solar voltaic cells with that from a wood power plant operated on old-growth logs in the Amazon. Evaluations that claim net yield from solar cells leave out the huge empower required in the human services for manufacture, distribution, support, connections, operation, management, and maintenance.
The greater the human population, the smaller the area of forests remaining, and the less time is usually allowed for growth. The global net empower of solar energy decreases with population. As populations have increased, times between shifting agriculture farming have decreased, which reduced yields.
Where a dilute renewable energy has to be concentrated to support society, either emergy is used to concentrate the energy spatially or time is allowed for the energy to accumulate in a broadly distributed storage. There is an emergy equivalence between accumulation of available energy over time and the work of concentrating energy in space. Self-organizing systems do both (chapter 4)13.
LIFE SUPPORT CARRYING CAPACITY FOR HUMANITY
In wildlife management the phrase carrying capacity sometimes is used to describe the ability of an ecosystem to sustain a species population without damaging its functions. Carrying capacity for wildlife is the population level for long-range survival. It depends on the power supplied of the types needed by that species. For example, a landscape supplies seeds used by doves. The resource needs of a species of dove are mostly a characteristic of the species and are genetically determined.
The carrying capacity of an area for people includes not only the emergy supplied from that area but the additional emergy that can be brought into that area by exchange or purchase. The resource required per person depends on the standard of living, which is best expressed in emergy units because it includes direct inputs from the environment and purchased inputs. Estimates of human needs should include all the works that provide stability, reserves, protection, and so forth. Note the wide range in emergy per person of people in different countries and cultures (table 7.4).
Any state or nation has its budget of environmental emergy plus the emergy that its economy is bringing in from nonrenewable sources within the nation or from without. The local carrying capacity (C) for humans can be estimated as
C = Pe + (R)(Pe)/E,
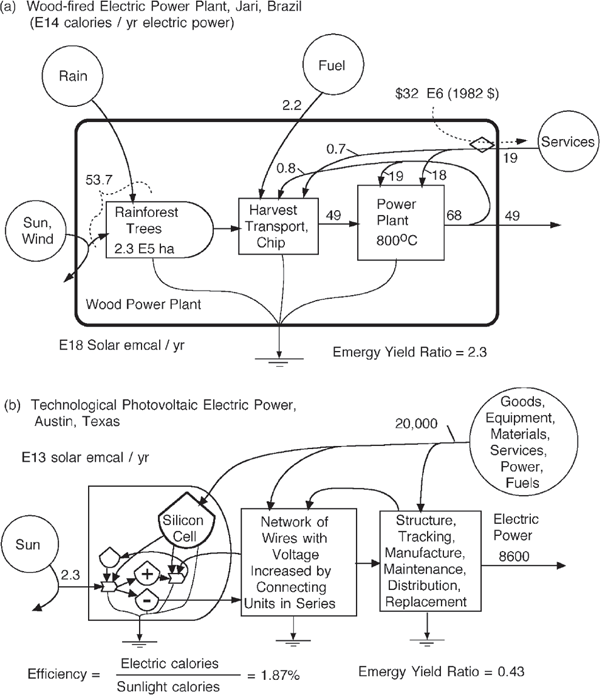
FIGURE 7.19 Comparison of methods of conversion of solar energy to electrical power. (a) Electric power plant operating with net emergy yield using rainforest logs at Jari, Brazil (Odum and Odum 1983). (b) Grid of photovoltaic cells generating electric power in Austin, Texas, with no net emergy (Odum 1996). Emergy yield ratio is the emergy yield divided by the emergy inputs from the economy.
TABLE 7.4 Human Emergy Support
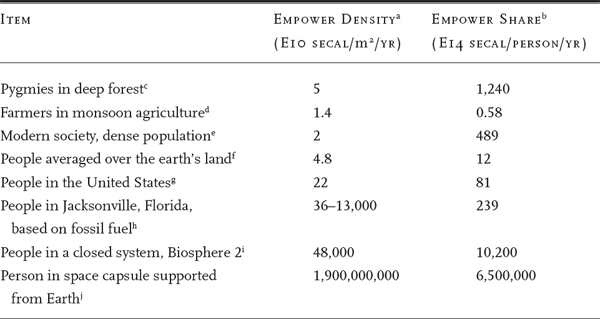
Note: secal = solar emcalories; 1 acre = 4,047 m2.
a Anual empower in solar emcalories per year divided by the land area.
b Annual empower in solar emcalories per year divided by the human population.
c Supporting forest empower, 1 person/mile2, 640 acres/mile2:
(131,000 calories/m2/day)(365 d/yr)(transformity 1,000 secal/cal) = 4.78 × 10¹⁰ secal/m2/yr.
(4.78 × 10¹⁰ secal/m2/yr)(2.6 × 106 m2/mile2) = 1.2 E17 secal/person/yr.
d Monsoon agricultural support, 1 person per acre:
(80,000 cal/m2/d)(180 d/yr)(1,000 secal/cal) = 1.44 E10 secal/m2/yr;
(1.44 E10 secal/m2/yr)(4,047 m2/acre)(1 person/acre) = 5.83 × 10¹³ secal/person/yr.
e 1.61 × 10²³ secal/yr for India (Odum 1996) divided by 3.29 × 10⁶ m2 = 4.89 × 10¹⁶ secal/m2/yr; empower share, table 10.1.
f World empower from fig. 9.4: 7.25 × 1024 secal/yr divided by 1.51 × 10¹⁴ m2 land area = 4.8 × 10¹⁰ secal/m2/yr; 7.25 × 1024 secal/yr divided by 6 × 10⁹ people = 1.21 × 10¹⁵ secal/person/yr.
g 2.1 × 1024 secal/yr (Odum 1996) divided by 260 × 106 people = 8.1 × 10¹⁵ secal/person/yr; 2.1 × 1024 secal/yr divided by 9.4 × 10¹² m2 area = 2.23 × 10¹¹ secal/m2/yr.
h Evaluation of Jacksonville by Douglas Whitfield (1994).
i Evaluation of Biosphere 2 (Beyers and Odum 1993): 1.02 × 10¹⁸ secal/person/yr. Annual support: (6.18 E18 secal/yr)/1.28 ha/10,000 m2 = 4.8 E14 secal/m2/yr.
j 6.5 E20 secal/person/yr calculated for NASA Skylab by Noyes (1977); multiplied by 3 astronauts and divided by 100 m2 = 1.9 × 10¹⁹ secal/m2/yr.
where C is the number of people supported per area, Pe is the local environmental empower per area, R is the regional investment ratio (ratio of outside empower to local environmental empower), and E is the annual empower use per person.
Vegetarian Diet and Human Nutrition
Vegetarian diets were important in many cultures in the past, and they are suggested for the future as a way of conserving available energy. The biological systems of human beings apparently evolved at the apex of food chains and require a very high diversity input of chemicals such as vitamins and minerals and good sources of carbohydrates and fats for basic calories. Figure 7.20 summarizes the way the food energy and diversity have been supplied to humanity. The assembly of the necessary substances usually was provided by the food chain to wild or domestic animals that combined the requirements together in so-called protein sources. In urban society the supply of food diversity to vegetarians is also provided by a complex network of businesses collecting and distributing specialty foods. This means gathering a great diversity of the necessary chemical molecules in ratios suitable for the support of humans. Many support systems have two types of food input, one flow a staple that supplies calories in a carbohydrate form such as potatoes, the other a protein supplement that supplies the daily requirement for diversity of molecules. The high-quality foods require more processing work combining varieties of molecules.
For tribal cultures in forest ecosystems, support came from a complex network of hundreds of species of plants and animals processing diverse products for the complex needs of humans. Now urban people receive support from a network of hundreds of people using fossil fuels directly and indirectly to process, transport, and sell a similarly high diversity of needed products. Either way, emergy is required for collecting and processing. For the industrialized system, combining and transporting are aided by fossil fuels.
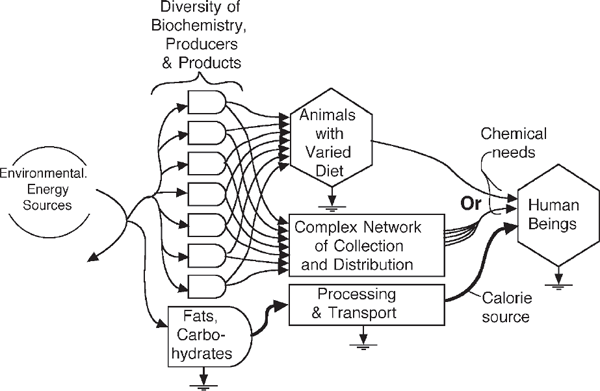
FIGURE 7.20 Diagram of the necessary use of power to converge products through food chains or collection networks to develop diverse, high-quality nutrition for humans. Solar protein generator system without fuel energy subsidy, compartmentalized according to the principal· necessary functions: producer, diversifier, controller, combining selector, and people. Each block function may involve many species and their energies for coordination.
A person can eat adequately without meat if someone does the extra work of gathering enough kinds and diversity of plant foods. As an alternative, he can eat the more expensive meat products, which already provide a nutrition close to his need. In meat, the combining has already been achieved by the integrating and mixing actions of the animals, microbes, and their systems of work and sustenance. Thus, the transformity of protein is higher than that of carbohydrates.
Human Support
The carrying capacity for a person of earlier cultures based entirely on renewable environmental energy was about 1 to 250 people per square kilometer (0.36 square mile), with 99.5% or more of the organic matter production metabolized in the work of life support. Higher densities occurred in special places where the energy hierarchy of nature transported the production of larger areas by means of a stream, such as salmon passing in waterways.
Civilizations support dense populations if they are able to match the fossil fuels with other environmental resources to be amplified. Primitive areas with rich oil deposits could only sell their fuel at first because they lacked technology and interacting inputs such as water.
The standard of living is best estimated from the annual emergy use per person (table 7.4). Notice the wide range of values. Rural people with little income but in low density can have as high empower use as some people in cities. Global standards may be decreasing.
Empower Signature
Any area can be characterized by its pattern of resource use, which is an energy signature of its activity (fig. 7.21a). Energy sources are arranged from left to right in order of transformity. Figure 7.21a, showing the energy flows in Florida, might be very misleading if used to infer the basis for society. But inflows are correctly compared on an emergy basis in fig. 7.21b. This is an empower signature, which shows the amounts and kinds of inputs on a common basis. It predicts the kinds of energy users that will predominate in a system that adapts to these resources. The example shows that the state of Florida is supported mainly by the fossil and nuclear empower plus that of purchased goods and services, which are also fossil fuel based. This signature is typical of developed areas, which are becoming more alike.
Many thoughtful leaders have long warned of the future shortages of fossil fuels, although the timetables of disaster are continually being revised as new sources of these fuels are found. But the earlier warnings are pertinent even if the timing of crisis is still unknown. Oil and coal will not run out, but the ratio of energy found to energy spent in obtaining them will continue to decrease until net emergy ratios of remaining deposits are less than alternative renewable sources. If the net yield of potential energy begins to approach that of wood, we will have returned to the solar energy-based economy, and by that time the standards of living of the world will have retrogressed to those of two centuries ago. Whether such changes will come suddenly in a catastrophe or slowly as a gradual trend is one of the great issues of our time (chapter 13).
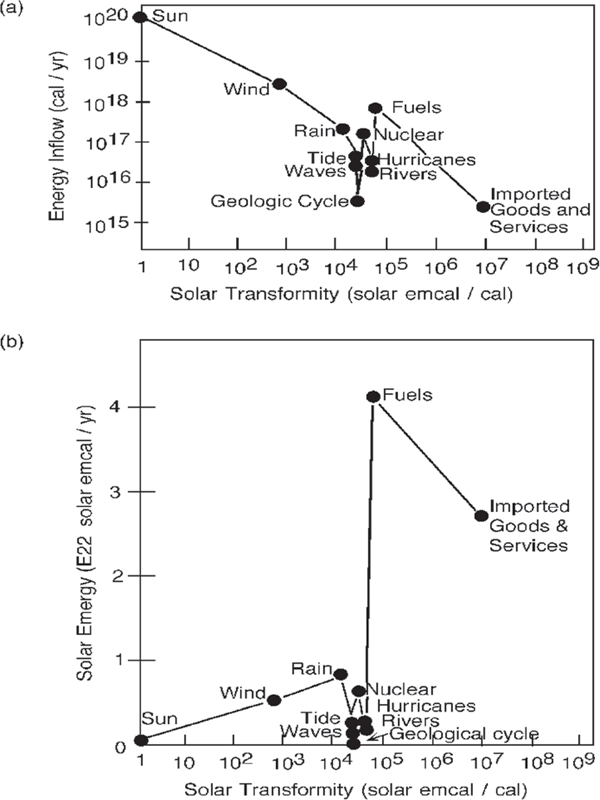
FIGURE 7.21 Energy signature: principal sources of energy and emergy used by the state of Florida, plotted according to their transformities (Odum 1983). (a) Annual energy flow; (b) annual emergy flow (empower).
Life Support in Space Capsules
The carrying capacity question also arises in the discussions of people in space outside the earth. The biosphere really is an overgrown space capsule, and the questions about carrying capacity are similar. What is the area necessary to support a person on the surface of the moon? How much area is needed when moon energy is supplemented by some fuel from Earth? The carrying capacity of an environment for one person depends on the transformity of the work the person has to perform. It is not just the inputs to keep a body alive. The emergy of support required per person in a space capsule is many times higher than that on Earth and much more than can be obtained from solar energy captured by a space ship (table 7.4).14 Emergy required for support in the NASA Skylab was 94,000 times larger than required for a U.S. citizen on Earth (Noyes 1977; see also review of efforts to supply life support in closed systems Beyers and Odum 1993).
Insight on what is needed for people doing complex work was provided by Biosphere 2, the 3-acre glass enclosure in the mountains of Arizona containing ecosystems and self-contained agriculture (Marino and Odum 1999). Eight people were supported in a minimal way for 2 years, despite large inputs of electric power and engineering. See table 7.4. The emergy required to operate the rainforest life support area in Biosphere 2 was 2,300 times larger than that used by the natural rainforest from which many trees were seeded (Leigh 1999). See chapter 12.
The carrying capacity for people in the future depends on the rate of depletion of the nonrenewable resources and the potentials of alternative energy sources. We postpone that discussion to chapter 13.
SUMMARY
The energy supporting humanity was examined with systems overviews beginning with simpler societies using renewable resources. Small tribes were supported by hunting, gathering, and shifting agriculture within complex ecosystems. Larger populations were supported in seasonally pulsing monsoon climates with rice paddies, aquaculture, and domestic animals. Without energy reserves societies are limited by the dilute nature of solar energy, which has to be concentrated many times to support high-transformity humans. Because of the fourth energy law (maximum empower principle), the efficiency of solar energy transformation is inverse to light intensity. Net emergy yield of biomass depends on time of growth.
Two centuries of fossil fuel use increased the production of food, clothing fiber, housing, heat, electric power, and information, expanding populations and organizing society in hierarchical urban centers with a wasteful automobile culture. Developed societies at the beginning of the 21st century are based on fossil fuels interacting with renewable energy, but much of the energy processing is decimating natural capital and is not sustainable. An index of real wealth, the emergy use per person, has a wide range between people crowded in areas without resources and those enriched in economic centers. The emergy required for astronauts in space is too large for self-sufficient space colonization. Net emergy evaluations did not find any alternative energy sources that can replace the declining fossil and nuclear fuels. Patterns of resource use by past societies help us see what is possible for global humanity as the use of nonrenewable resources fades.
BIBLIOGRAPHY
Note: An asterisk denotes additional reading.
Alkire, W. H. 1965. Lamotrek atoll and inter-island socioeconomic ties. Illinois Studies in Anthropology, 5.
*Armstrong, N. E. and H. T. Odum. 1963. Photoelectric ecosystem. Science, 143: 256–258.
Beyers, R. J. and H. T. Odum. 1993. Ecological Microcosms. New York: Springer-Verlag.
Birdsell, J. B. 1966. Some environmental and cultural factors influencing the structuring of Australian Aboriginal populations. In J. B. Bresler, ed., Human Ecology, 51–90. Reading, MA: Addison-Wesley.
Brody, S. 1945. Bioenergetics and Growth. New York: Reinhold.
Brown, L. R. 1965. Increasing World Food Output. Foreign Agricultural Economics Report No. 25. Washington, DC: U.S. Department of Agriculture, Economic Research Service, Foreign Regional Analysis Division.
Brown, L., C. Flavin, and H. French. 2001. State of the World 2001. New York: Worldwatch Institute.
*Bjorndal, T. 1990. The Economics of Salmon Aquaculture. Oxford, UK: Blackwell.
Carter, W. E. 1969. New Lands and Old Traditions. Latin American Monograph, No. 6. Gainesville: University of Florida Press.
Clendenning, K. A. and H. C. Ehrmantraut. 1951. In E. T. Rabinowitch, ed., Photosynthesis, Vol. 2, Part 2. New York: Interscience.
Conover, R. J. 1964. Food relations and nutrition of zooplankton. Proceedings of the Symposium on Experimental Marine Ecology, Occasional Publication No. 2. Chapel Hill: University of North Carolina Graduate School of Oceanography.
Doherty, S. J. 1995. Emergy evaluations of and limits to forest production. Ph.D. dissertation, University of Florida, Gainesville.
Doxiadis, C. A. 1977. Ecology and Ekistics. Boulder, CA: Westview.
Fischer, A. W. 1961. Economic aspects of algae as a potential fuel. In F. Daniels and J. S. Duffie, eds., Solar Energy Research, 185–189. Madison: University of Wisconsin Press.
*Giles, G. W. 1967. Agricultural power and equipment. In The World Food Problem, Vol. III, 175–208. A Report of the President’s Science Advisory Committee, Washington, DC.
Hagen, E. E. 1966. Man and the Tropical Environment [mimeo]. Symposium on Biota of the Amazon, Belém, Peru.
Harris, M. 1965. The myth of the sacred cow. In A. Leeds and A. P. Vayda, eds., Man, Culture and Animals, 217–228. Publication No. 78. Washington, DC: American Association for the Advancement of Science.
*Hickling, C. F. 1961. Tropical Inland Fisheries. New York: Wiley.
Hoon, V. 1996. Living on the Move: Bhotiyas of the Kumaon Himalaya. Walnut Creek, UK: Altamir Press, Sage Publications.
Huang, S.-L. 1998. Urban ecosystems, energetic hierarchies, and ecological economics of Taipei metropolis. Journal of Environmental Management, 52: 11, 39-51.
–––––. 1999. Spatial hierarchy of urban energetic systems. In S. Ulgiati, ed., Advances in Energy Studies, Energy Flows in Ecology and Economy, 499–514. Proceedings of the International Workshop, Porto Venere, Italy, May 26–30, 1998. Rome: Museum of Science and Scientific Information (Musis).
*Jenkins, D. W. 1968. Biogenerative Life Support Systems. Washington, DC: National Aeronautics and Space Administration, SP-165, 1–6.
Johnson, M. J. 1967. Growth of microbial cells on hydrocarbons. Science, 155: 1515–1519.
Kleiber, M. 1961. The Fire of Life. New York: Wiley.
Leigh, L. S. 1999. Diversity limits and Biosphere 2. Ph.D. dissertation, University of Florida, Gainesville.
Mann, K. H. 1965. Energy transformations by a population of fish in the River Thames. Journal of Animal Ecology, 34: 253–375.
Marino, B. and H. T. Odum, eds. 1999. Biosphere 2: Research past and present. Special issue of Ecological Engineering, 13(1–4): 1–358.
McPherson, A. T. 1964. Food for Tomorrow’s Billions. Proceedings of Food in the Future, Concepts for Planning. Washington, DC: Dairy and Food Industries Supply Association.
Noyes, G. 1977. Energy analysis of space operations. In H. T. Odum and J. Alexander, eds., Energy Analysis of Models of United States, 401–422. Gainesville: Report to Department of Energy, Department of Environmental Engineering Science, University of Florida.
Odum, H. T. 1962. Man and the ecosystem. Proceedings of the Lockwood Conference on the Suburban Forest and Ecology. Connecticut Agricultural Experiment Station Bulletin 652: 57–75.
–––––. 1967. Energetics of world food production. In The World Food Problem, Vol. III, pp.
55–94. A Report of the President’s Science Advisory Committee, Washington, DC.
———1983. Systems Ecology. New York: Wiley. Reprinted in 1994 as Ecological and General Systems. Boulder: University Press of Colorado.
———. 1984. Energy analysis of the environmental role in agriculture. In G. Stanhill, ed., Energy and Agriculture, 24–51. Berlin: Springer-Verlag.
*———. 1986. Enmergy in ecosystems. In N. Polunin, ed., Ecosystem Theory and Application, 337–369. New York: Wiley.
———. 1996. Environmental Accounting, Emergy and Decision Making. New York: Wiley.
———. 2001. Emergy evaluation of salmon pen culture. Proceedings of the International Institute of Fishery Economics.
Odum, H. T., C. Kylstra, J. Alexander, N. Sipe, and P. Lem. 1976. Net energy analysis of alternatives for the United States. In U.S. Energy Policy: Trends and Goals. Part V: Middle and Long-Term Energy Policies and Alternatives, 254–304. 94th Congress 2nd Session Committee Print. Prepared for the Subcommittee on Energy and Power of the Committee on Interstate and Foreign Commerce of the U.S. House of Representatives, 66–723. Washington, DC: U.S. Government Printing Office.
Odum, H. T., M. T. Brown, D. F. Whitfield, S. Lopez, R. Woithe, and S. Doherty. 1995. Zonal Organization of Cities and Environment. Unpublished report to the Chiang Ching-Kuo International Scholar Exchange Foundation, Taipei, Taiwan.
Odum, H. T. and E. C. Odum, eds. 1983. Energy Analysis Overview of Nations. Working Paper WP-83-82. Laxenburg, Austria: International Institute for Applied Systems Analysis.
*Odum, H. T. and E. C. Odum. 2000. Modeling for All Scales. An Introduction to Simulation. San Diego, CA: Academic Press.
Paddoch, C. 1972. An analog simulation of a simplified model of New Guinea people, their pigs, ritual feasts and warfare. In Report to Atomic Energy Commission, 649–658. Contract At-940-10-4156. Gainesville: University of Florida.
Parker, F. W. 1963. Food for Peace, 6–20. Madison, WI: American Society of Agronomy, Special Publication No. 1.
Petrides, G. A. and W. G. Swank. 1964. Population densities and the range-carrying capacity for large mammals in Queen Elizabeth National Park, Uganda. Zoologica Africana, 1: 209–225.
Pimentel, S. and C. W. Hall, eds. 1984. Food and Energy Resources. San Diego, CA: Academic Press.
President’s Science Advisory Committee on World Food Production. 1967. The World Food Problem. Washington, DC: U.S. Government Printing Office.
Rappaport, R. A. 1971. The flow of energy in an agricultural society. Scientific American, 224: 116–133.
Romitelli, M. S. 1997. Energy analysis of watersheds. Ph.D. dissertation, University of Florida, Gainesville.
Ryan, S. 1990. Diurnal CO2 exchange and photosynthesis of the Samoa tropical forest. Global Biogeochemical Cycles, 5(1): 69–84.
Smith, R. F. 1970. The vegetation structure of a Puerto Rican rain forest before and after short term gamma irradiation. In A Tropical Rain Forest, D-103–D-135. Oak Ridge, TN: U.S. Atomic Energy Commission, Division of Technical Information.
Turnbull, C. 1916. The Forest People. New York: Simon & Schuster.
Turnbull, C. 1963. The lesson of the Pygmies. Scientific American, 208(1): 28–37.
Whitfield, D. 1994. Emergy basis for urban land use patterns in Jacksonville, FL. M.S. thesis, University of Florida, Gainesville.
Wilson, E. O. 1984. Biophilia. Cambridge, MA: Harvard University Press.
*Wolman, A. 1965. The metabolism of cities. Scientific American, 213: 179–190.
NOTES
1. Systems that are loaded to run slowly have a high conversion efficiency, but when loaded to accomplish more energy laws require a decline in efficiency. In fig. 3.3c the output load of the photosynthetic machinery is the same (in the short run), but the input force increases with light intensity. Whereas the optimum efficiency for maximum yield in one energy transformation step is 50% (appendix fig. A3), photosynthesis has a series of successive energy transformations, so that the combined conversion is less. When loaded for maximum power, the light intensity is intermediate, and the efficiency of the first step of light conversion is moderate (10%). In the bright light of summer, efficiencies are necessarily lower. Light in excess of the optimum loading is allowed to pass to other receptor pigments below.
2. The systems diagrams of resources in support of societies in this chapter are highly aggregated to help readers visualize causes. Environment, Power, and Society included energy flows for the Dodo tribe of Uganda and for peoples of the savanna based on big game herds. Diagrams for two dozen other societies were published in detail elsewhere (Odum 1962, 1967, 1984).
3. Hagen (1966) gave a 1940 population of 1.4 people per square mile for the Amazon, including the towns. Turnbull (1916, 1963) gave a population of 40,000 pygmies for a rainforest area of 50,000 square miles, or 0.8 person per square mile. In Australia, Birdsell (1966) found aboriginal populations in densities up to 550-person villages per 600 square miles in high-rainfall areas and down to 500 people per 40,000 square miles in dry central areas.
4. Graphs of agricultural yield as a function of fossil fuel use from Environment, Power, and Society were updated and redrawn as a composite using empower. Global limitations to agriculture have been summarized by Lester Brown and associates in annual publications of the World Watch Institute (Brown et al. 2001).
5. McPherson (1964) reported cost as $0.55 (1964 $) per kilogram. Percentage of fuel converted was from a report of Shell Development Company pilot plant in which 107 grams of food (50% protein) was produced from 2 million cubic feet of methane (4.6 × 10⁸ kilocalories) (Rappaport 1971). Emergy money ratio in 1964 was 11 × 1012 solar emcal/dollar (Odum 1996). Higher efficiencies were claimed in slow batch experiments by Johnson (1967).
6. Sylvia Romitelli (1997) evaluated the Coweeta Watershed of North Carolina and Brazilian watersheds, showing how transformity and empower density increasing toward the mouth measured the ability of river floodwaters to generate productivity of floodplains, valleys, and deltas. She evaluated the ways in which hydroelectric dams divert this empower.
7. Comparisons of cities were conducted as part of a joint project titled “Ecological Energetic Evolution of Urban Systems: Cross Comparison of Chinese and American Societies” by the Graduate Institute of Urban Planning, National Chung-Hsing University and Center for Environmental Policy, University of Florida, Gainesville. The work was sponsored by the Chiang Ching-Kuo International Scholar Exchange Foundation, Taipei, Taiwan (Odum et al. 1995).
8. The author’s suggestion regarding inherited ecological affinity was made in the Lockwood Conference on Urban Forests (Odum 1962). The word biophilia has been suggested by Wilson (1984).
9. Values are scattered in the literature, some assembled in Environmental Accounting (Odum 1996), which has a bibliography of emergy evaluation.
10. The law is Public Law 93-577, The Non-Nuclear Energy Research and Development Act of 1975.
11. The results were given and published in congressional testimony (Odum et al. 1976). A conference was held sponsored by the TRW corporation, Stanford University, and the National Science Foundation. Embodied energy calculations were rejected by a summarizing committee that recommended implementing oil shale development.
12. Work supported by a project of the Swedish Power Board exploring potential to substitute spruce and other forest production of Sweden for nuclear power. Calculations included conversion to wood powder, a very intensive fuel, but there was no appreciable net emergy yield, which means it could not support itself.
13. There may be an opportunity to relate this principle to the space–time concepts of cosmology.
14. The emergy per person required `for highly educated human work (high transformity) is much greater than that sometimes estimated to support the metabolism of a passive body in space. Space capsules in continuous sunlight beyond atmospheric absorption and the shadow of the rotating Earth receive about four times more light than any place on Earth, but the area needed to support a person on sunlight follows from the transformity.
An astronaut needs: (1 E8 solar emcal/cal)(22.5 E6 gcal/day metabolism) = 2.2 E15 solar emcalories per day;
Each square meter receives sunlight: (solar constant 2 E4 gcal/m2/minute)(1,440 minutes/day) = 2.88 E7 solar calories/m2/day
Absorption area needed per person: 2.2 E16/2.88 E7 = 7.6 E8 square meters (760 km2), which is an area about 28 km by 28 km.