Using a computer to help analyse your data can have several advantages. The main advantage is that it is efficient in terms of time and data management. By hand, the analysis of qualitative data can be messy, confusing and time consuming. By using a computer package you can input the transcripts, code the entries and then group, compare, contrast and link data. The computer provides flexibility, removes much of the tedium of handworked analysis, and allows tasks that would be almost impossible to calculate with large data sets to be processed effortlessly. In this section we explore how to use one particular package especially designed to help analyse qualitative data. However, before we continue you should remember that:
A computer can help us analyse our data, but it cannot analyse our data ... we must do the analysis.
(Dey, 1993: 55; our italics).
That is, you are responsible for telling the computer what to do and you still have to interpret the results. It is not simply a case of inputting data and awaiting the results.
There are a number of different commercial computer packages which can be used to manage and help analyse qualitative data. All approach the task in slightly different ways, with varying degrees of sophistication. For an overview of 24 different packages, see Weitzman and Miles (1995). For the purposes of this book we have used NUD-IST (Non-numerical Unstructured Data Indexing Searching and Theorising) (see Appendix C for details) to demonstrate how qualitative data can be effectively organised, analysed and interpreted through a computer package. As the online manual details, NUD-IST allows users to:
- manage, explore and search texts of documents;
- manage and explore ideas about the data;
- link ideas and construct theories about the data;
- test theories about the data;
- generate reports including statistical summaries.
We have chosen NUD-IST for three principal reasons. First, the package came recommended by colleagues. Second, we have familiarity with its use. Third, NUDIST seems to be well known and used within the research community.
This chapter seeks to build upon the conceptual issues and the handworked examples outlined in the previous chapter by offering practical guidance in the computer-based analysis of qualitative data. We advise that you read this chapter in front of a computer, with the NUD-IST program running, and work through the examples at the appropriate places. It is only in this way that the true power of the package in aiding qualitative analysis can be appreciated. Where appropriate, you should refer back to Chapter 8 for guidance. The sample data for the examples can be downloaded from the Pearson Education web site (http://www.awl-he.com).
Using NUD-IST, at first, can seem quite daunting and complicated. Just playing around with the pull-down menus does not get you very far - it is a computer package that has to be learnt. However, it can be learnt very quickly and once done provides a very powerful way to manage and analyse qualitative data. The following account is designed to allow you to run and manage a qualitative study using NUD-IST. We have only detailed how to use the basic functionality. However, this is sufficient in the majority of cases to allow detailed analysis. Our discussion mirrors the prescription of qualitative data analysis outlined in the last chapter: description, classification and connection, outlining how to undertake each of these phases using NUD-IST (version 4.0).
To aid explanation, we have used the same notation as we used to illustrate MINITAB in Chapter 4. The symbol  is used to indicate either a selection from a menu or a button, which needs to be clicked on with the mouse. Where this is followed by a name and two square brackets (e.g.,
  File Name [ ]), this means that you should click on a box/section with the name 'File Name'. Other information to be entered into the box is then explicitly requested (e.g., Type in . . .'; 'Select . . .') at the appropriate place in the sequence of instructions.
9.2.1 Preparing the data
Before you can start to use NUD-IST, you will need to transcribe your data and to type them into ASCII files (plain text - with no word-processing codes). Each individual or focus-group interview should be stored in a separate file. To aid file use in NUD-IST, you should carefully format your transcription data following the steps in Box 9.1). Typing in data and formatting files can be quite tedious and time consuming. Remember to leave sufficient time to undertake this task. Once you have completed these tasks you can now use NUD-IST to assist with your analysis.
Box 9.1 Formatting raw data files
| Step 1 |
Store your data in ASCII text files. These are plain files which contain only the text, with no word-processing or other coding. |
| Step 2 |
Prefix header information and interview questions with an asterisk. This is to distinguish respondent answers from other information. For example, using Respondent A's data (see Box 8.1), the start of the file would look like this: |
* Male
* Age 43
* Age since blind: 19
* Location of interview: Respondent's home.
* Spatial context: Urban estate, privately owned (formerly council), semidetached.
* Date/Time of interview: */*/97; 4 pm.
* Who was present: DJ and Respondent A.
* Interview was recorded on tape and video.
* Notes: Interviewee was cautious but reasonably forthcoming.
* INT: How do you approach and resolve problems encountered en route? <HR> RES: Such as? <HR>
* INT: Well, how about detours? <HR> RES: I'm OK with them. But I got lost once. It tends to knock you sideways a bit. I crossed one too many streets and I ended up going in the opposite direction. Well, I would first of all - if I didn't know the area - I would ask someone. Or I would go back on myself and retrace, and maybe get a taxi or some other transport. Or maybe I would go to a friend's house nearby. <HR>
Notes:
- Each carriage return (starting a new line - <HR>) creates a new text unit (group of text) when loaded into NUD-IST. In the above example, 'Such as?' would be the first text unit and 'I'm OK with them . . . nearby' would be the third.
- Sometimes you might wish each line of text to be a text unit; at other times you might assign whole paragraphs. In the example data, we have used paragraphs.
- Because each carriage return introduces a new text unit, include only those necessary (i.e., do not have blank lines in your document except between the header information and interview text).
- Make sure each question and each answer is a separate text unit.
9.2.2 Creating a new project
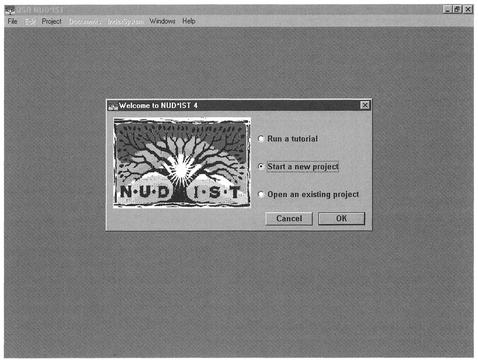
Upon starting NUD-IST you will be presented with a screen as displayed in Figure 9.1.
NUD-IST refers to each set of analyses upon a set of data as a project. The first task we need to undertake is to create a new project. Check 'Start a new project', or if you have already started a project and are restarting NUD-IST check 'open an existing project', and select OK. We now need to name our project. In our case, we have chosen the name Blind to indicate that it refers to analysis of transcripts with blind individuals:
- • File name [ ]
- Type filename (e.g., blind.stp)
- • Save
- Type your name (e.g., Rob Kitchin)
- • OK
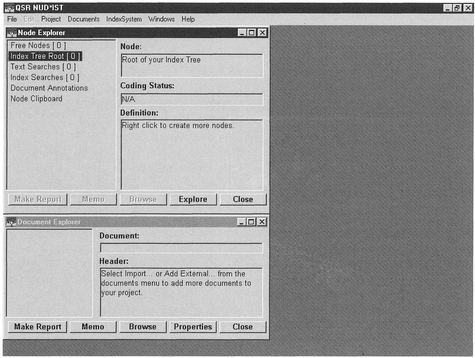
Two new boxes will appear entitled 'Node Explorer' and 'Document Explorer' (see Figure 9.2). This process will automatically create a whole new series of sub-directories which NUD-IST will use to store your analyses. Minimise the NUD-IST window and transfer your transcript files into the Rawfiles directory. You are now ready to start importing data.
9.2.3 Importing data
Once you have created a new project you need to import your data. Data sets within NUD-IST are referred to as 'documents' and we will use the same terminology. To import sample data into data documents within the NUD-IST package:
- • Documents
- • Import
- • File name [ ]
- Select file (e.g., Resa.txt)
- • OK
- • OK
A modified copy of Resa.txt has now been put into the BLIND project as a data document. To introduce other data sets (e.g., for Respondents B, C and D) repeat the process.
To view individual data documents once loaded into NUD-IST use the Document Explorer window:
- Document Explorer [ ]
- Highlight file (e.g., RESA)
- • Make Report
- • OK
- • OK
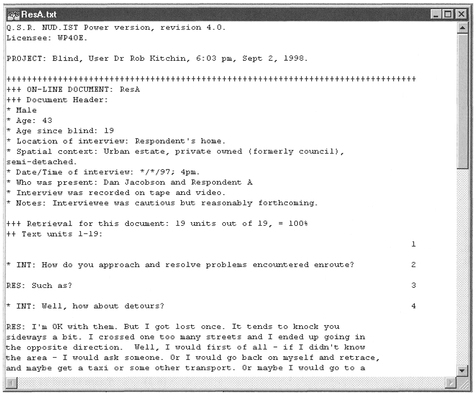
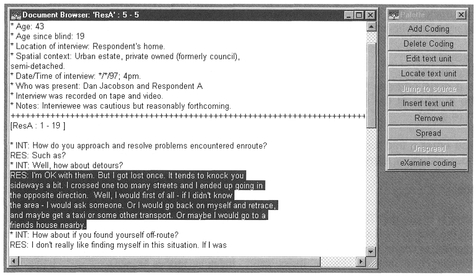
You will now be presented with a window containing some data about the document, the header and the selected data (Figure 9.3). Note the text unit numbers are shown on the right. You can scroll up and down the document to read the text units.
To close a report (or any active window):
- • File
- • Close
- Select 'No' if you do not want to save a report and 'Yes' if you do.
- If you select 'Yes':
- • File name [ ]
- Type in file name.
- • Save
9.2.4 Annotating data
NUD-IST allows you to annotate documents once you have started to use the package, saving the annotations as memos. Memos can be attached either to data documents or to index categories (see next section). You can create a Memo using the Document Explorer window by:
- • Document Explorer [ ]
- Highlight RESA
- • Memo
- • Yes
- Type in your memo
9.3.1 Assigning category codes
As discussed in the previous chapter, qualitative data analysis requires data to be classified (sorted into relevant categories). This process is made easier by NUD-IST because it allows you to use the power of the computer to manage and manipulate data. In NUD-IST, category codes are called index categories.
NUD-IST holds the index categories you create in a hierarchical structure. The simplest way to create an index category is to follow the steps below:
- • IndexSystem
- • Create Nodes ...
- • Type a node address [ ]
- Type the number of the index category to be created (e.g., 3)
- • OK
- • Please enter a title for node (n) [ ]
- Type index category name (e.g., Coping)
- • OK
- • Cancel
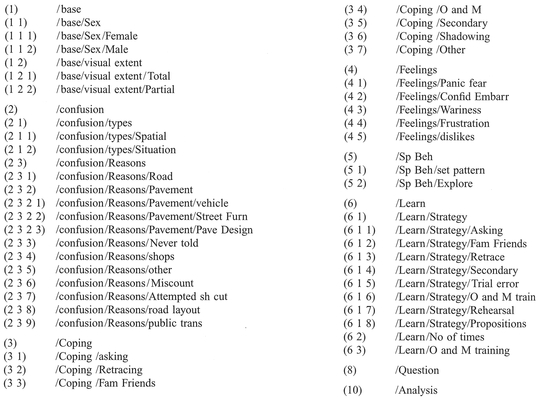
An alternative is to use the 'Tree Display at <root>' window, or the process of assigning text units to index categories, to create the index categories (see below). Whichever method is chosen, index categories are not set in stone and the data within them can be split and spliced easily (see below). Box 9.2 provides a complete list of index categories for our example project. Note how the hierarchical structure contrasts with the handworked example in the last chapter (there are now eight main categories as opposed to three in the handworked example). The rationale behind this new structure is the easier storage and organisation of text units assigned to multiple index categories, and is designed to aid analysis (see Section 9.4).
9.3.2 Creating a tree of index categories
As you create index categories, and assign your data to different categories (see below), it can be useful to visualise how the categories relate to each other (see Figure 9.5). The master category of the hierarchy of index categories is called the Root from which all index categories branch.
A visual record of your index categories is easy to create:
- • IndexSystem
- • Display Tree
Move the mouse pointer to the pane (rectangle) in its upper left corner and double-click. A tree structure of the category indexing already created will automatically appear (see Figure 9.6).
To navigate up and down the hierarchy simply click on the desired arrows.
9.3.3 Adding text units to index categories
To assign text within data documents to an index category, a process is adopted that is much the same as performed manually in the last chapter:
- • Documents
- • Browse Document
- • Select Document [ ]
- Highlight data document required (e.g., RESA)
- • OK
A Document Browser window will appear displaying the text of the data document selected, along with a palette window for controlling the categorisation process (Figure 9.4).
Scroll through the text until you come to the section you wish to code. Once you have identified the text for coding, select it by clicking on it (the text will now be highlighted). To add the text (e.g., 'I'm OK with them . . .': see Box 9.1) to an index category (e.g., 3 1 - coping/asking):
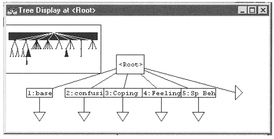
Figure 9.6 Examining the whole tree structure in NUD-IST.
- Highlight text unit
- • Add Coding
- • Type a node address [ ]
- Type the number of the index category (e.g., 3 1).
- • OK
If you cannot remember the index category you wish to assign a category to:
- • ...Select
- Double-click on Index Tree Root [ ]
- Work your way down the hierarchy by clicking on the +/- signs until the index category you desire is highlighted.
- • OK
- • OK
If required, a new index category can be created by typing in a new node number:
- • Add Coding
- • Type a node address [ ]
- Type the number (n) of the new index category (e.g., 3 1)
- • OK
- • Yes
- • Please enter a title for node (n) [ ]
- Type index category name (e.g., Asking)
- • OK
By working your way through the data document all the text units can be assigned to an index category. Remember, the same text units can be assigned to more than one index category. For example, the example piece of text concerning being lost might be coded in categories concerning blindness level, gender, age, question number, spatial confusion, coping and feelings. This cross-referencing is crucial for the connection phase. To close the Document Browser window simply:
Note you can add Memos (annotations) to index categories. This can be done using the following commands in the Node Explorer window:
- Double-click on Index Tree Route [ ]
- Work your way down the hierarchy by clicking on the +/- signs until the index category you desire is highlighted.
- • Memo
- • Yes
- Type in memo/annotation
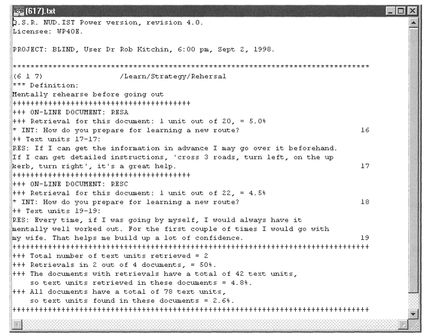
At any point, all the data assigned to an index category can be examined using Make Report in the Node Explorer window. An editable report window will appear containing the requested information, plus some statistical summary data (Figure 9.7).
9.3.4 Searching data documents
An alternative to scrutinising each data set manually is to use NUD-IST to search the data documents for you. NUD-IST will allow you to search for individual words or phrases, for example:
- • Documents
- • Search Text
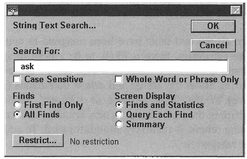
- • String Search.
A window will appear (Figure 9.8).
Next:
- • Search For [ ]
- Type your search string (e.g., 'ask' - without quote marks)
- • OK
All data documents are searched for your selected search string. A summary window and an edit window will appear displaying all instances of this string.
If you want to restrict the search in any way, you can use the Exclude option. This is useful if you want to filter out any text units (e.g., selecting node 1 1 2 in the BLIND project will exclude all interview data with men - see Box 9.2). Simply:
- • Documents
- • Search Text
- • String Search.
- • Search For [ ]
- Type your search string (e.g., ask)
- • Restrict
- • Exclude
- • Coded At [ ]
- Type the number of the index category (e.g., 1 1 2) or use Select
- • OK
- • OK
Any instances of the text string are automatically placed onto the Text Searches clipboard. To move the data detected by the search to an index category we can use the Merge command:
- • Tree Display at <Root>
- Select the index category to merge the data with (e.g., 3 1)
- • Merge
- • Yes
If you wish to form a new category, instead of using Merge, use the Attach command:
- • Tree Display at <Root>
- Select the index category to append the data to (e.g., 3)
- • Attach
- • Yes
The text will then become a child of the node you append the data to.
We can also search for patterns within your data documents ('either/or' searches, e.g., search for 'lost' and/or 'disorientated'):
- • Documents:
- • Search Text
- • Pattern Search.
- • Search For [ ]
- Type your search string within square brackets (e.g., [lostldisorientated] - the vertical line means 'or').
- • OK
You can add context to the data stored on the clipboard by using the Spread command in the Node Explorer window. This will add to the text findings the preceding and succeeding text.
- Select Node Clipboard
- Click right-hand mouse button
- • Spread
- • Context [ ]
- Select number of text units (e.g., 5)
- • OK
In our example, five text units on either side of every search finding are added to the clipboard.
When searching your data documents, remember that not all relevant passages will contain keywords. You should therefore also be careful to search the text manually, using the method described above.
9.3.5 Reshaping index categories
Once all the text units have been assigned to appropriate categories, there is likely to be a need to split and splice the index categories. This can be achieved by using either the Merge and Attach commands (see above) or the 'Tree Display at <Root>' window. Reshaping the tree, adding in new branches and reassigning others, is relatively straightforward. To add in new categories:
- • Tree Display at <Root>
- Select index category to add new index category to (e.g., <Root>)
- • Create Node
- • /Question/ [ ]
- Type in a new index category name (e.g., Learning)
- •Definition [ ]
- Type in a definition (e.g., Branch concerning how a route is learnt)
- • OK
The main tree display will show the new node, created as a child of <Root>. To Delete an index category:
- • Tree Display at <Root>
- Select index category to add new category to (e.g., Learning)
- • Delete
- • Yes
Sometimes you might want to move a category to a new position within the data tree:
- • Tree Display at <Root>
- Select index category to be moved
- • Cut
- Select index category the cut category is to be appended to
- • Attach
- • Yes
or Merge two categories together:
- • Tree Display at <Root>
- Select index category to be moved
- • Cut
- Select index category the cut category is to be merged with
- • Merge
- • Yes
Through careful construction, a complex, hierarchical structure describing the data can be developed. Figure 9.5 displays the tree structure for the BLIND project. To explore the tree structure you have created, click on the arrows to move up and down the hierarchy. The index category codes (see Box 9.2) mirror this structure (e.g., [2 1] means the second node of the root and the first child of this node). By clicking in the index category boxes within the 'Tree Display at <root>' window and selecting a category name, details about the category can be examined. Opening more 'Tree Display' windows can help you to view more of the tree. To do this:
- • IndexSystem
- • Display Tree
Computer packages can aid the process of classification greatly because of their flexibility and speed of reassigning data within index categories. However, it is in the ability to allow you to make connections that they come into their own. NUD-IST is no exception, allowing you to query your data extensively. NUDIST uses an Index System Search (ISS) to compare different categories and their coding. The ISS allows you to compare, contrast and link text relating to different issues. Our new data structure (as opposed to the handworked example - see Figure 8.4) is designed to take advantage of the querying capabilities of ISS. Instead of having to divide the data into 'spatial' and 'situational' categories, we can use the computer to make these distinctions at a later date. For example, if we wanted to determine the reasons for spatial confusion we could compare the text units stored in node 2 1 1 (confusion/types/spatial) with those in the sub-categories of node 2 3 (confusion/Reasons). To merge all reason data (e.g., 2 3 1,2 3 2, 2 3 3, etc.) into 2 3, use the copy and merge commands:
- • Tree Display at <Root>
- Select index category to be copied (e.g., 2 3 1)
- • Copy
- Select index category the copied category is to be merged with (e.g., 2 3)
- • Merge
- • Yes
Repeat for the other index categories to be copied. We suggest that to save confusion, at this point, you create a new node 'Analysis'. This node will be used to store all your query results.
The text units which appear in both (i.e., Intersect) 2 1 1 and 2 3 reveal the reasons for spatial confusion:
- • IndexSystem
- • Search Index System
- • Intersect.
- • Intersect [ ]
- Type node number of index categories in brackets (e.g., (2 1 1) (3 1)) or use Select
- • OK
- • OK
The findings are saved in the Index Search in the Node Explorer, and can be viewed using Make Report.
We could perform the same analysis for 'situational confusion', or even work out which reasons are common to both 'spatial' and 'situational confusion'. This would have been difficult and time consuming to compute by hand (hence the different structure adopted for hand analysis). The computer provides much greater flexibility, ease of analysis, and speed.
The ISS allows many different sorts of queries to be processed beyond intersection (there are 18 different operations). For example, If-inside allows you to see if different groups thought/did the same things. For example, we might ask 'is it only totally blind people who panic when lost, or do people with residual vision also panic?'. This sort of question might yield interesting insights into the spatial behaviour of totally blind and visually impaired people:
- • IndexSystem:
- • Search Index System
- • If-inside.
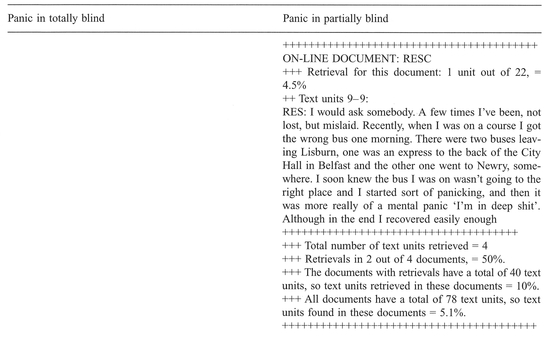
- In the left-hand box add the search node (e.g., 4 1 (panic)).
- In the right-hand box add the node which is to be searched (e.g., 1 2 1 (totally blind)).
- • OK
- • OK
The findings will be saved in the Index Search in the Node Explorer. We could now repeat the process for partially sighted respondents (e.g., 1 2 2). By making reports for new nodes we can compare the findings (see Box 9.3), but note that you still have to interpret the results! Box 9.3 reveals that one of the totally blind respondents mentions panic once, whereas both partially sighted respondents mention panic several times. Whilst we cannot draw any conclusions from this because of our limited data set, it would be interesting to compare the results of the full data set. If the results were continued across the whole data set, we might then draw in more evidence to try to find out why this is the case. For example, we might compare the spatial behaviour of totally and partially blind people - do partially blind people experience more panic because they use their residual vision to explore more, whereas totally blind people stick to set patterns of spatial behaviour? Other questions might relate to the congenitally blind (from birth) versus the adventitiously blind (lost sight later in life), or guide dog users against non-users, or women versus men.
Similarly we could perform the Near analysis. Near lets you determine whether text units of different nodes appear close together in the text. In general, the closer together text units are, the more related they are. For example, we might expect feelings of fear to be related to coping strategies. While the text might not overlap (intersect), we might want to know if there is a general relationship.
- • IndexSystem:
- • Search Index System
- • Near
- In the left-hand box add the search node (e.g., 4 1 (panic))
- In the right-hand box add the 'near to' node (e.g., 3 (merged coping category index))
- • Context [ ]
- Choose how near the two issues should be (e.g., section, text unit (number)).
- • OK
- • OK
Followed-by could be used to indicate whether coping strategies always succeeded statements of fear (same procedure as Near but select Followed-by). We could also determine whether coping strategies always succeeded statements of fear across groups (as with our If-inside example). In our example data, because the text units are paragraphs and not individual sentences or lines, the Near and Followed-by commands are relatively ineffective as related issues appear in the same paragraph (be aware of shortcomings in your data structure). However, other operators (such as Intersect and If-inside) can still be used to query our data successfully.
After reading this chapter you should:
- be able to analyse data using NUD-IST;
- recognise the power of the computer to simplify qualitative data analysis and interpretation.
In this chapter we have extended the discussion of qualitative data analysis, illustrating how qualitative data can be analysed effectively using a dedicated computer package (in this case NUD-IST). While NUDIST might not seem intuitive immediately, it does not take long to master its commands. As with quantitative analysis, care is needed at all stages of analysis from data entry (see Section 4.2.2) to interpreting the results. Of particular note is how you can use the NUD-IST package to help in the process of categorising and linking your data. You should take full advantage of the computing power to explore all the (appropriate) relationships within your data set. In the following chapter, we move the focus of our attention away from data analysis to concentrate upon how to write up your project and disseminate your findings.
- Why is the computer a useful tool for analysing qualitative data?
- How do the handworked and NUD-IST tree structures for the BLIND project differ and why?
Crang, M.A., Hudson, A.C., Reimer, S.M. and Hinchliffe, S.J. (1997) Software for qualitative research. 1. Prospectus and overview. Environment and Planning A29: 771-787.
Hinchliffe, S.J., Crang, M.A., Reimer, S.M. and Hudson, A.C. (1997) Software for qualitative research. 2. Some thoughts on 'aiding' analysis. Environment and Planning A29: 1109-1124.
Weitzman, E.A. and Miles, M.B. (1995) Computer Programs for Qualitative Data Analysis. Sage, London.