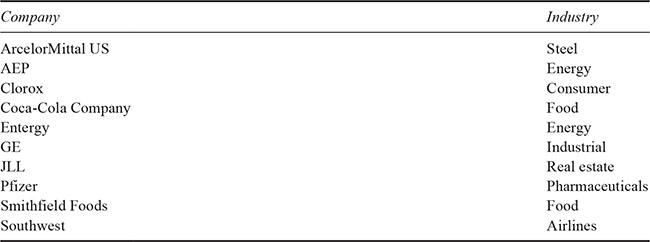
Table 23.1 Companies analyzed
p.365
EMERGING INTEGRATED REPORTING PRACTICES IN THE UNITED STATES
Mary Adams
Introduction
The integrated reporting movement is a good example of the third stage of development of intellectual capital (IC) thinking: from raising awareness to theory building and frameworks, and now to IC in practice. While it is still in its infancy across the world and even less common in the United States (US), there are already some compelling examples of integrated reporting practice in the US. This chapter endeavours to examine the key characteristics of ten publicly-available US integrated reports to get a sense of this emerging practice.
The US context
Many of the issuers of integrated reports (including the majority of those studied here) are public companies that are already subject to an extensive and well-established reporting environment. Any examination of integrated reporting in the US has to take into account this existing regulatory context for reporting of financial and business results by public companies and/or those with large numbers of shareholders. The requirement most relevant to this discussion is the submission of an annual 10-K report that must include a structured analysis of the company’s operations, risks, and financial performance. The structure is mandated to include four specific sections accompanied by 15 specific schedules.
For many companies, the 10-K functions as an annual report to shareholders, either on its own or with a short overview letter. Many companies also issue a separate, stand-alone annual report that uses graphics and thematic summaries that help the company tell its story to shareholders and, sometimes, to other stakeholders as well. These reports are not constrained in their content in the same way as a 10-K.
Integrated reporting
Integrated reporting is primarily associated with the International Integrated Reporting Council (IIRC). In December 2013, the IIRC issued the <IR> framework.1 The <IR> framework consists of seven guiding principles: 1) strategic focus and future orientation; 2) connectivity of information; 3) stakeholder relationships; 4) materiality; 5) conciseness; 6) reliability and completeness; and 7) consistency and comparability. The <IR> framework also requires that integrated reports include eight content elements: 1) organizational overview and external environment; 2) governance; 3) business model; 4) risks and opportunities; 5) strategy and resource allocation; 6) performance; 7) outlook; and 8) basis of presentation.
p.366
Underlying the <IR> framework are three core concepts that are not required but are recommended as tools to achieve the principles. The first concept is value creation, how a company creates value for stakeholders and shareholders over the short, medium, and long term. The second is the need to explain the links between value creation for shareholders, stakeholders, and society at large. The third is ‘the capitals’ including financial, manufactured, intellectual, human, social and relationship, and natural capital. The <IR> framework’s use of the phrase “intellectual capital” differs from common practice in the IC community. The common definitions of IC usually include human, relationship, and structural or organizational capital. Under this definition, the IC field studies three of the six IIRC capitals. The <IR> framework, however, uses the term IC to mean just structural capital.
Most, but far from all, of the Principles and Content Elements mirror the requirements and market practices for a 10-K. So for the purposes of this analysis, they are not a particularly fruitful avenue for understanding new or emerging practices and were not addressed in this analysis. However, the three core concepts do represent departures from mainstream practices and are the basis of this analysis.
Analytical approach
Since integrated reporting is emerging in the US market, I was curious about some of the fundamental starting decisions that an issuing company might ask itself such as: What do we call this report? Will it replace our annual report? Is this something we want to share with our investors? Should it be a document, a website, or both? What standards will we use to guide us?
Based on the analysis of the current <IR> framework, a company may also consider questions about the content of its report: How will we communicate our value creation model? Which capitals will we examine and how? Should we present an integrated scorecard to support our presentation? With these questions as a guideline, I identified 20 separate indicators that were used to examine each of the reports.
In choosing these indicators, I had three goals. The first was to answer basic questions about the positioning of the report. The second was to highlight different approaches to value creation, capitals, and measurement. The third was to use an analytical approach that was as objective and as repeatable as possible. Each of the 20 indicators is discussed in detail below. An Appendix summarizes the reports.
Companies selected
To be included on the list, a company had to either call its report an “integrated report” in either the title or the description of the report or issue a report that included metrics or discussion of all of the capitals. Using these criteria, ten companies were included in this analysis (see Table 23.1). These companies include a variety of businesses with different stories to tell; they all took different approaches to telling their story in an integrated way.
p.367
Table 23.1 Companies analyzed

Corporate status
Integrated reporting is not just for public companies. Internationally, there are also not-for-profit and other types of entities that are issuing integrated reports. This sample is no different. While most of the companies are public, one is private (Smithfield Foods) and the other is the US operation of a large multinational (ArcelorMittal). The remaining eight are public companies.
Report year
This study was completed in July 2016. By this point, most of the companies had already issued their reports for 2015. Two, however, had not yet released their 2015 reports. In one case, JLL had yet to release its integrated or sustainability reports. Smithfield is issuing its report in stages on line over the course of several months with some significant sections yet to come at the time of the study. So it made sense to use the full 2014 report for this analysis.
Report functional title
All the reports had essentially two titles. The first was a functional title that indicated the nature of the report. There was significant diversity in this category. Four of the companies used the word “integrated” in their title. Entergy2 and ArcelorMittal3 called theirs an “Integrated Report”. Clorox used the name “Integrated Annual Report”.4 GE called theirs an “Integrated Summary Report”.5 There is no identifiable pattern here and it is safe to say that this pattern will continue into the future.
Southwest6 used the name “One Report™” which references the reporting approach suggested in the book by the same name authored by Robert Eccles and Michael Krzus. AEP7 issued an “Accountability Report”, and Jones Lang Lasalle (JLL)8, 9 and Smithfield used “Sustainability” as their functional title.10
Report theme
The second element of the title was a thematic one, which is how the company set the stage for the message of the report. There is no pattern in these results either, but they were included because they are a simple way of summarizing the company’s overall intent for the report. For example, GE’s theme was “Digital Industrial” and used its Integrated Summary Report to emphasize this core strategy for the company. Southwest’s theme was “Without a heart, it’s just a machine”. Clorox used “Good Growth” and AEP, “The Power of Diversity”. Finally, JLL used “Our cities. Our future”.
p.368
Report purpose
An interesting choice in the integrated approach is whether a company decides to issue a report that is in addition to its existing reports or to replace these. In this sample, six of the companies offered a separate report that was supplemental to their annual reports.
Two of the public companies did present the report as their annual report. Clorox titled theirs as an “Integrated Annual Report” while Entergy used the title “Integrated Report”. Southwest offered its Annual Report in the form of a 10-K with a three-page introductory letter. But its “One Report™” is available right next to the download for the Annual Report.
Both of the companies with non-public status, Smithfield and ArcelorMittal, used the report as their sole reporting platform. In all the other cases, the integrated report studied here was one of a number of reports issued by the company, so was classified as a “supplement”.
In all cases but one, this analysis focuses on a single report from each company. The exception is JLL, which published a 22-page cover letter to its 10-K that included a 7-page discussion called the “Technology Imperative” focusing primarily on its IC. As IC is a particularly challenging capital for many companies to address, this presentation is included in this analysis for learning purposes.
Location of report on website
A further distinction between the reports is the location where they are offered on the corporate website. Here, it is encouraging that most companies provided a link to their report on their investor relations web pages. In the case of Clorox and Entergy, the report was the primary link. But five other companies provided a supplemental link to the integrated report alongside the annual report on their investor relations website. The exceptions included the two companies that do not have US investor relations (ArcelorMittal and Smithfield). The only public company that did not offer its report through investor relations was JLL.
Report media
In all but one case, the report was available as a downloadable document. The exception was AEP, which has a web-only presentation. Half of the companies went beyond the document and also built a stand-alone, interactive website that makes it easy to digest the content dynamically.
Number of report pages
The size of a document was an indicator of the extent of the information supplied. The range in size of the reports studied was significant. On the low end were JLL – 27, Clorox – 28, and Coca-Cola – 36.11 On the high end were Pfizer – 137,12 ArcelorMittal – 150, and Smithfield – 202. The average length of all the reports was 89 pages.
Identification of stakeholders
p.369
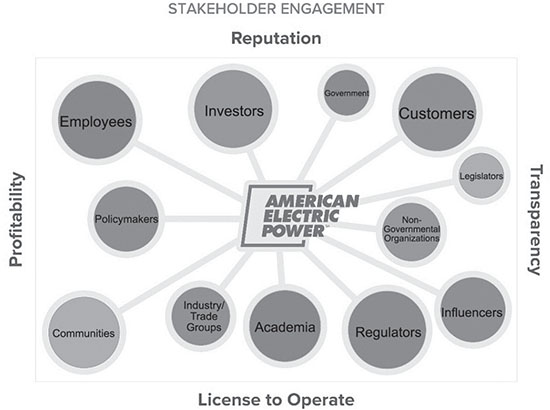
Figure 23.1 AEP stakeholder graphic
Every company studied used the word “stakeholder” or “stakeholders” at least once in the narrative of their reports. Three (Pfizer, AEP, and ArcelorMittal) used graphics or lists that specifically identified their non-shareholder stakeholder groups. These all displayed the stakeholders as nodes in an abstract network. The graphic developed by AEP to highlight its stakeholders can be found in Figure 23.1.
Citation of standards
Companies generally identified standards used as guidance in the preparation of the report. Others mentioned multiple standards (GAAP, GHG, SASB, UN Global Goals) with the most frequent standard being the GRI, cited by seven companies. Only one company (Coca-Cola) was silent on this issue. Three of the companies actually cited the <IR> framework in their reports. Two of these are the companies with international homes (Arcelor Mittal and Smithfield). The other is Entergy.
Assurance provider
There was an even split between companies on assurance. Six were silent on the subject. Three mentioned assurance for at least part of the report (such as financials). One (AEP) stated that assurance was provided by the company’s internal auditors.
Value creation
Every company explained in its external reporting about how it “creates value” as part of its business model and operations, even if they do not specifically use the “value creation” phrase. In this sample, four of the companies relied on narrative only to explain their value creation.
It can be difficult to just use narrative to explain how all the elements of a business are combined in a value creation system. Although the <IR> framework does not specifically recommend this, a visual graphic can be the simplest and most powerful way of explaining the workings of this complex system. In fact, the <IR> framework offers its own graphic, seen in Figure 23.2, to explain the overall concept.
p.370
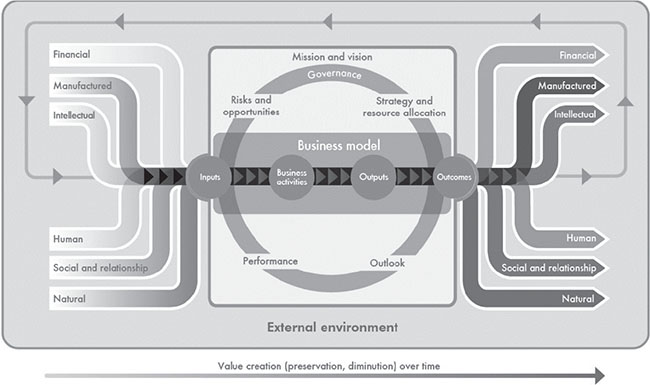
Figure 23.2 IIRC value creation graphic
Six of the companies also included a value creation graphic. Almost all the reports studied here included multiple graphics. So some judgment was required as to whether one of the graphics illustrated the overall value creation system of the company. There is no pattern to the approaches taken by the companies except that most included a lot of circles and connecting lines and arrows. Few specifically identified a flow or creation of value. Rather, they function as a visual inventory of key strategic goals and resources. To be classified as providing graphics in the count above, there had to be at least one graphic that tried to provide a big-picture illustration of the company’s strategy and/or how the company creates value.
AEP’s graphic is in a section of the report website called “Business Model Evolution”. In it, the company identified four elements that it calls its “Foundation for the Future”. Above a graphical representation of this foundation, AEP uses the graphic in Figure 23.3 to illustrate its strategic goals and opportunities. It explained this graphic as follows:
We have significant opportunities to continue enhancing customer and shareholder value as we make strategic investments to deploy new technologies, generate reliable, cleaner energy and deliver solutions to meet customers’ needs.
The graphic illustrates three spheres where it will build this value including: infrastructure development, sustainable electricity, and customer experience. These investment areas touched on many of the six capitals with human capital being notably absent.
ArcelorMittal’s graphic, seen in Figure 23.4, endeavours to connect strategy and sustainability. An outside circle of words identifying resources is circulating around a number of strategic financial and business goals such as “optimize assets”, “gain market share”, and “achieve positive cash flow”. The arrow simply flows around each of the two circles.
p.371
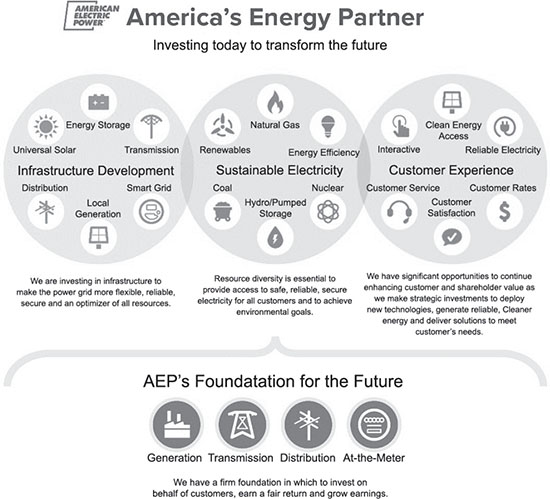
Figure 23.3 AEP value creation graphic
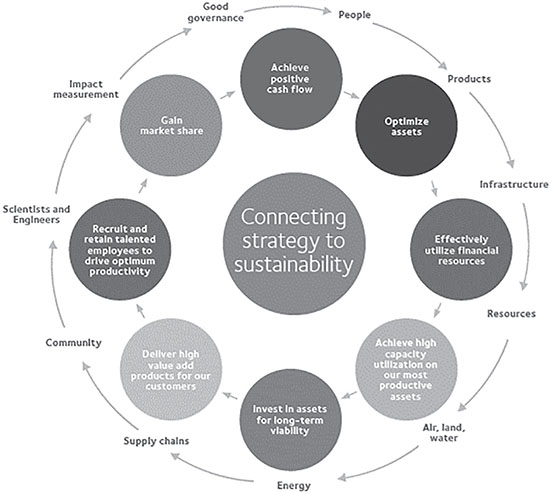
Figure 23.4 ArcelorMittal value creation graphic
p.372
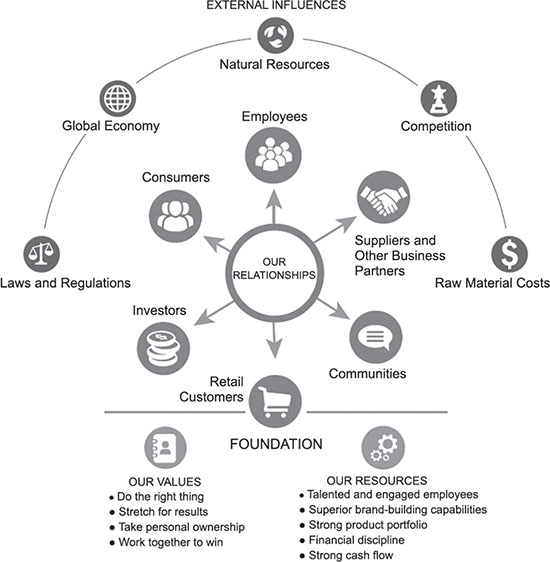
Figure 23.5 Clorex value creation graphic
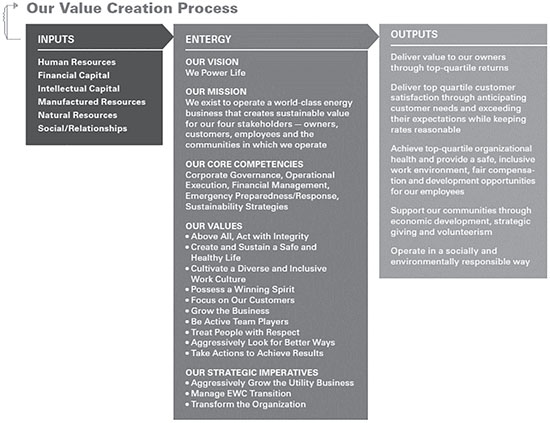
Figure 23.6 Entergy value creation graphic
p.373
Clorox organizes its graphic, seen in Figure 23.5, with relationships in the centre, values and resources as a foundation, and external influences as a dome over it all.
Entergy is one of the few in the sample that uses the IIRC inputs and outputs vocabulary. In fact, the graphic in Figure 23.6 is set up to show six kinds of capital inputs to the company’s vision, mission, core competencies, values, and strategic imperatives. Out of this flow outputs that include big-picture financial, customer, workplace, community, and environmental outcomes such as “operate in a socially and environmentally sustainable way”.
GE uses a simple graphic that shows how it creates value from horizontal capabilities and vertical expertise.
It expands on this concept with a full-page graphic that is too large to include here. The graphic has three levels: the first highlights what it terms the “value of scale and diversity”, including leveraging scale, spreading ideas, and creating solutions. The second level illustrates the GE Store, which can be seen in the excerpt in Figure 23.7 with resource types surrounded by the key business units. The graphic is explained as follows:
The GE Store is the transfer of technology, talent, expertise and connections through GE’s massive, diverse network of businesses and markets. GE’s businesses give and take from the Store, and in 2015, the Company made great progress.
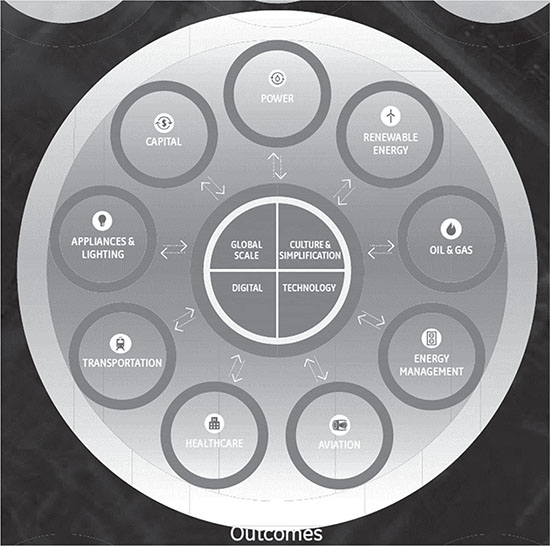
Figure 23.7 GE excerpt of GE detailed value creation graphic
p.374
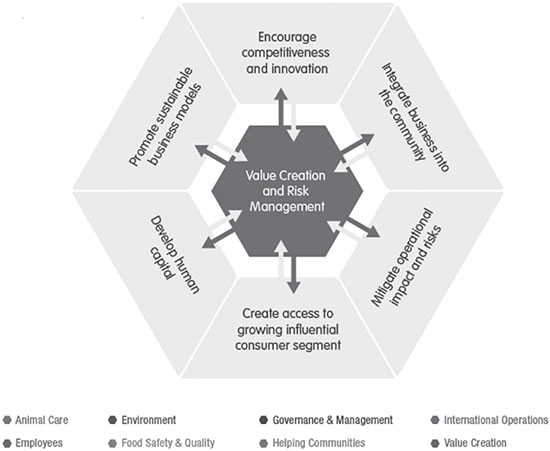
Figure 23.8 Smithfield value creation graphic
The third level highlights outcomes from the value creation (faster growth, expanding margins, developing leaders). Arrows show each business unit giving and receiving value from the core resources of scale, culture, digital and technology.
Smithfield uses Figure 23.8 at the end of its report with the following explanation:
This table illustrates some of the ways in which our sustainability programs create value for a wide range of stakeholders while simultaneously improving Smithfield’s own financial performance. We use the term “value creation” broadly and think of it in ways that go beyond just our own company’s value. Our sustainability programs create substantial value for Smithfield Foods.
The core goals of value creation and risk management are at the centre of six strategic activities. Below the strategic circle, there are eight areas such as communities, governance, and animal care, each identified with a different coloured dot. In the pages following this graphic, there is a section for each of the six strategic activities. For each, there are a handful of strategic results that are tagged with the coloured dot corresponding to the eight result areas.
Use of the “capitals” vocabulary
p.375
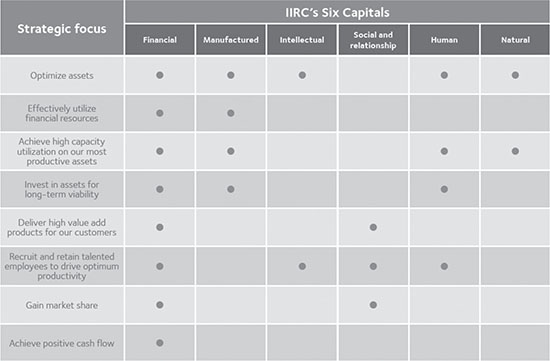
Figure 23.9 ArcelorMittal capitals graphic
In addition to value creation, one of the key ideas behind integrated reporting is the multi-capital model. This model highlights six types of value creation resources that fall into three categories. First is tangible resources, including financial and manufactured capitals. Second is intangible resources, including human, intellectual, and relationship capitals. Third is environmental resources, including natural capital.
The underlying challenge of integrated reporting is to explain in a holistic way how a company uses these resources to support today’s value creation commitments in ways that also ensure the continued strength of the resources in the future. As discussed in the previous section, companies are taking many different paths to explain their value creation systems. In US practice, this is not being accomplished by explicitly using the IIRC capitals vocabulary. This was confirmed by a word search in each of the reports for the use of the word “capitals”.
Only two of the companies in the sample used the term. And these two each used it in a single graphic. The first is the Entergy value creation graphic in Figure 23.6 already discussed above, which shows the six capitals as inputs. The only other company in the sample that explicitly talked about its capitals is ArcelorMittal, which uses the table shown in Figure 23.9.
The table in this Figure identifies which capitals are important to eight key areas of strategic focus such as optimizing assets and delivering high value-add products for its customers.
Metrics for the capitals
Although the companies made scant use of the IIRC vocabulary, they all apply the concept, uniting discussions of tangible, intangible, and natural resources in a single report. To explore how the companies did this, I classified the types of resources included in the presentation according to the <IR> framework definition of each of capitals. The research method was a simple checklist that was applied to record whether the capital element was only addressed in the narrative or whether there were single- or multi-year metrics provided.
All the companies mentioned aspects of each of the capitals in the narrative. However, many also included specific metrics in tables and graphics. One report included just a single year of metrics across the board: JLL. AEP provided single-year for all but natural capital. The approach to reporting on each of the capitals is now examined.
p.376
Financial capital
The IIRC defines financial capital as “The pool of funds that is: available to an organization for use in the production of goods or the provision of services; or obtained through financing, such as debt, equity or grants; or generated through operations or investments”.
Measures of financial capital are readily available through financial statements. All the reports included some financial metrics, with JLL and AEP limiting their focus to a single year. The type of metrics included revenues, margins, and profits in varying degrees of detail. Some included cash levels that would speak to financial assets as longer-term capital. A couple also referenced external debt ratings and stock trends.
Manufactured capital
The IIRC defines manufactured capital as:
[m]anufactured physical objects (as distinct from natural physical objects) that are available to an organization for use in the production of goods or the provision of services, including: buildings; equipment; and infrastructure (such as roads, ports, bridges, and waste and water treatment plants). Manufactured capital is often created by other organizations, but includes assets manufactured by the reporting organization for sale or when they are retained for its own use.
Like financial capital, manufactured capital is tangible, easy to count, and often has accounting information associated with it, so it is easy to report on. Besides AEP and JLL (which used single-year metrics throughout), the only other company that reported single-year metrics for this category was Clorox. The rest of the sample reported multi-year metrics.
The kind of metrics generally included in the reports were plant numbers and capacity, as well as demographic and performance data on specific kinds of equipment and infrastructure.
Intellectual capital (IC)
The IIRC defines IC as “organizational, knowledge-based intangibles, including: intellectual property, such as patents, copyrights, software, rights and licenses; and ‘organizational capital’ such as tacit knowledge, systems, procedures and protocols”.
IC is a new reporting category for most companies so it is the one with the least specific reporting. Half of the companies in the analysis addressed IC with narrative only. One of these five was GE. IC is actually at the heart of GE’s new “digital industrial” strategy. Key to this strategy is the “GE Store”, which is a name for the collective knowledge of the many diverse GE businesses. Despite its clear importance, the company did not attempt to measure the Store in any way. Several others addressed IC by discussing efficiency efforts, including Coca-Cola which featured a number of management accomplishments in generating efficiencies and streamlining its operations (although the effect of these changes on the other capitals was not assessed).
Three companies did include single-year metrics for the current year related to IC. AEP included data on customer calls, transactions processed, service levels, technology investment, and innovation efforts. Pfizer’s IC data consisted mostly of new patents issued inside and outside the US. As explained earlier, I also gave JLL credit for the powerful review of its technology with single-year metrics that is actually in its Annual Report (separate from the Global Sustainability Report reviewed here) because it is a great example of an examination of IC.
p.377
The two companies providing multi-year IC data included Entergy and Smithfield. In Entergy’s case, the data consisted of service level reporting and capability ratings. Smithfield included extensive discussions and metrics of food safety and quality (which speak to the company’s processes and controls). There is also a detailed presentation of governance and management of a number of key business functions such as animal care, plant management, and quality control.
Human capital
The IIRC defines human capital as:
People’s competencies, capabilities and experience, and their motivations to innovate, including their: alignment with and support for an organization’s governance framework, risk management approach, and ethical values; ability to understand, develop and implement an organization’s strategy; and loyalties and motivations for improving processes, goods and services, including their ability to lead, manage and collaborate.
Compared with IC, there was much more use of human capital metrics. Coca-Cola mentioned the number of its “system associates” and used narrative to describe them. AEP, JLL, and Clorox all included data for a single year. The rest (six companies) included multi-year data. Common metrics included head count, diversity by gender and ethnicity, injuries, training hours/investment, engagement metrics, savings/retirement participation, and management makeup.
The Pfizer report also included 24 separate videos that feature individual employees talking about what he or she is “working on”. And the report section about the GE board included extensive metrics about the experience, diversity, tenure, and background of the company’s board members.
Social and relationship capital
The IIRC defines social and relationship capital as:
The institutions and the relationships within and between communities, groups of stakeholders and other networks, and the ability to share information to enhance individual and collective well-being. Social and relationship capital includes: shared norms, and common values and behaviors; key stakeholder relationships, and the trust and willingness to engage that an organization has developed and strives to build and protect with external stakeholders; and intangibles associated with the brand and reputation that an organization has developed; and an organization’s social license to operate.
Every company is dependent on many kinds of relationships. Many elements of relationship capital are familiar in traditional annual reports, including customers, suppliers, and brands. Interestingly, Clorox joins Coca-Cola in the category of dealing with its relationships through the report narrative. GE joins JLL and AEP in providing a single year of data. The final five in the study all provide multi-year data.
Common metrics used included counts of customers (sometimes by industry segments) and suppliers. The consumer companies like Clorox and Coca-Cola all highlighted their brands. Pfizer had extensive narrative and metrics about patient groups served and helped. Smithfield included data about the production processes of its contract growers. Coca-Cola enumerated its bottling partners and consumer outlets. Entergy and AEP both addressed their relationships with regulators and their communities. JLL described socio-economic effects of its buildings. Many of the companies also included information on social outreach programs in their communities.
p.378
Natural capital
The IIRC defines natural capital as: “All renewable and nonrenewable environmental resources and processes that provide goods or services that support the past, current or future prosperity of an organization. It includes: air, water, land, minerals and forests; and biodiversity and eco-system health”.
Reporting on natural capital is one of the hallmarks of integrated as opposed to traditional reporting. The breakdown included some variation from the other capitals. Coca-Cola was consistent in using narrative only. However, AEP used multi-year metrics in this category after using just single-year metrics in the other categories. In fact, it presented 15 years of data on carbon dioxide emissions and 7 years of data on water usage. GE swung the other way, including one page of selected singe-year metrics. Clorox and JLL were the others using single-year metrics. The most extensive information about natural capital can be found in the Smithfield report.
Multi-capital scorecard
To qualify in the prior sections as reporting on a specific capital, the information just had to be included somewhere in the report. However, seven of the companies also took the extra step of creating one or more scorecards to pull together data on multiple capitals. The most comprehensive scorecard was by Southwest. It provided two pages with five years of data at the beginning of each of three sections: performance, people, and planet. AEP had a stand-alone Performance Summary webpage with a graphical display of a single year of data tied together as a value creation story. Pfizer included a multi-page summary of selected key performance indicators with up to four years of data for a variety of capital elements. Although GE did not provide a single scorecard for the entire company (and is listed as a “No” here), its report did provide quite detailed snapshots/scorecards of each of its nine core lines of business.
Conclusion
If reference to the <IR> framework is a requirement for being considered an integrated report, then practice in the US is limited to just two US-based companies in our sample (JLL and EAP). But if a broader definition of integrated reporting is applied, as providing information about the full set of capitals and how they relate to value creation, then the full list of ten companies here qualify.
These examples show that the practice of integrated reporting is still in an emergent form. Each of these companies is taking steps in its own way to tell its stories to shareholders and stakeholders in a more holistic, integrated way. These examples are advanced enough to serve as inspiration for other companies to begin their own integrated journeys. And the companies issuing them bear watching as they continue to adapt and improve their reports in future years.
p.379
Other possible metrics
As explained in the introduction to this analysis, I endeavoured to find objective factors that could be replicated by other analysts with similar results. As the practice of integrated reporting grows, I believe that it will be important and helpful to develop databases of reporting practices. A more advanced analysis beyond the 20 elements analysed here could examine the specific names used for individual capital elements, how many metrics are used for each element, how many years of data are supplied, and how many years the company has been doing this kind of report. It would also be helpful to find more objective ways of analysing and/or classifying companies’ approaches to communication of their value creation models.
Notes
1 http://integratedreporting.org/resource/international-ir-framework/.
2 http://integratedreport.entergy.com/.
3 www.usa.arcelormittal.com/sustainability/2015-integrated-report.
4 http://annualreport.thecloroxcompany.com/.
6 www.southwestonereport.com/2015.
8 www.jll.com/sustainability/sustainability-report.
9 www.jll.com/InvestorPDFs/JLL-2015-Annual-Report.pdf.
10 www.smithfieldfoods.com/integrated-report/2014/introduction.
11 www.coca-colacompany.com/2015-year-in-review.
12 www.pfizer.com/files/investors/financial_reports/annual_reports/2015/index.htm.