Figure 5.1 Intra-EAC Traffic, 2004–13

Source: Analysis based on data from DiiO SRS Analyzer (2013).
Note: Bi-directional traffic capacity. Number after year indicates month, 07 = July. EAC = East African Community.
After having established the key elements of the low-cost carrier (LCC) business model, and identifying the market environment that they can flourish in, chapter 5 provides insight into the potential development of LCCs in Sub-Saharan Africa, a region which still represents largely unexplored territory for the business model. Due to the region’s vastness, complexity, and diversity, this chapter focuses on identifying opportunities and challenges using the example of the East African Community (EAC).
The EAC is a regional economic community (REC) formed between five East African countries: Uganda, Tanzania, Rwanda, Burundi, and Kenya. The region covers around 1.82 million square kilometers, and includes a population of 141.1 million (East African Community Statistics Portal 2013).
The history of the EAC goes back as far as 1917, when Kenya and Uganda formed one of the first cooperative entities in Africa by establishing a customs union. After assuming different shapes and forms—and even a temporary dissolution in 1977—the three major economies of Tanzania, Kenya and Uganda formed the EAC in 2000. In 2007, Rwanda and Burundi joined the EAC. Based on the EAC Treaty of 1999 (EAC 1999), which forms the legal basis of the community, its prime objective is to “develop policies and programs aimed at widening and deepening cooperation among the Partner States in political, economic, social and cultural fields, research and technology, defense, security and legal and judicial affairs, for their mutual benefit” (EAC 1999). To achieve these objectives, the EAC was to establish a customs union, a common market, and subsequently a monetary union, ultimately leading to a political federation (EAC 1999).
The EAC Treaty lays out a set of fundamental and operational principles that must govern the achievement of these objectives. The most significant fundamental principles include “mutual trust, political will, and sovereign equality,” as well as “peaceful coexistence and settlement of disputes” (EAC 1999). The community’s key operational principles are “the establishment of an export oriented economy for the Partner States in which there shall be free movement of goods, persons, labor, services, capital, information and technology” and the “principle of subsidiarity” of the EAC, which secures multilevel participation and the involvement of a wide range of stakeholders during the integration process (EAC 1999).
Air Transportation has been given particular attention in the EAC Treaty under Section 92. As its objective, EAC member countries are to “harmonize their policies on civil aviation to promote the development of safe, reliable, efficient, and economically viable civil aviation with a view to developing appropriate infrastructure, aeronautical skills and technology, as well as the role of aviation in support of other economic activities” (EAC 1999). There are also some specific provisions for different areas of the industry, which are outlined throughout this chapter.
Overall, the institutional framework of the newly established EAC is well defined and consists of all of the necessary elements for effective implementation of its goals, including economic cooperation and integration among its partner states.
In addition to the EAC, some of its member states are also part of other RECs. These may have different policies with regard to the air transport sector. Burundi, Rwanda, Kenya, and Uganda, for example, are also part of the Common Market for Eastern and Southern Africa (COMESA), a regional organization that has established a free trade zone between eastern, southern, and central African states.1 Tanzania is also a part of the Southern African Development Community (SADC). SADC’s objective is socioeconomic cooperation and integration, as well as political and security cooperation. It includes 15 members from the southern African region.
These dual/multiple regional bloc memberships of EAC states have, in some cases, slowed down decision-making processes due to the need for harmonization between individual RECs. To address this obstacle, EAC, COMESA, and SADC founded the COMESA-EAC-SADC Tripartite in 2005. The Tripartite decided to develop a road map for the harmonization of the three RECs at the Tripartite Summit of Heads of State in 2008. However, this has not been achieved yet. It has also been working toward the implementation of a comprehensive Trade and Transport Facilitation Programme, including providing support for various aspects of the air transport sectors (OECD and WTO 2011).
As established in chapter 4, the key factor for LCCs to flourish in a market is high utilization of their aircraft and personnel. This in turn requires high expected volumes of traffic. These volumes can be achieved by either targeting existing customers on high traffic routes to reduce market share of incumbent carriers, by stimulating new demand by attracting a larger segment of the population through a lower fare offering, or by opening previously unserved routes. In order to assess the opportunities in the EAC market, a short overview of the existing market, as well as an analysis of the potential for future growth opportunities, are provided below. This is by no means an exhaustive assessment, but serves as an overall indicator of trends in the market. A more detailed analysis would be required to assess actual route-level opportunities, and is beyond the scope of this research.
In order to provide a broad overview of the air transport market, this book primarily focuses on current air traffic capacity, as well as on the key participants in the market. Although some passenger data is available from the EAC Secretariat for an analysis of the existing EAC market, it is difficult to verify the data’s accuracy. Therefore, this analysis relies on information from airline schedules as collated through the online database DiiO SRS Analyzer (2013), and a sample of passenger flow data for some African airports as provided by the Airports Council International. Using schedules data has the disadvantage that only capacity is provided rather than actual passengers flown. However, it does serve as an indication of overall traffic flows.
The current intra-EAC air transport market is still very small and the majority of domestic and regional traffic is still concentrated around the two major hubs of Nairobi, Kenya, and Dar es Salaam, Tanzania. These two airports absorb the largest number of passengers followed by Mombasa, Kenya, and Entebbe, Uganda (see table 5.1).
Table 5.1 Passengers by Airport, 2012
Airport |
IATA |
PAX |
Jomo Kenyatta International Airport, Nairobi, Kenya |
NBO |
6,271,922 |
Julius Nyerere International Airport, Dar es Salaam, Tanzania |
DAR |
2,088,282 |
Moi International Airport, Mombasa, Kenya |
MBA |
1,347,908 |
Entebbe International Airport, Entebbe, Uganda |
EBB |
1,342,134 |
Abeid Amani Karume International Airport, Zanzibar, Tanzania |
ZNZ |
787,813 |
Kilimanjaro International Airport, Kilimanjaro, Tanzania |
JRO |
665,147 |
Kigali International Airport, Kigali, Rwanda |
KGL |
458,807 |
Mwanza Airport, Mwanza Tanzania |
MWZ |
392,298 |
Aéroport International De Bujumbura, Bujumbura, Burundi |
BJM |
291,838 |
Eldoret Airport, Eldoret, Kenya |
EDL |
103,729 |
Source: ACI 2012.
Note: IATA = International Air Transport Association; PAX = number of passengers.
As figure 5.1 shows, despite growth in recent years, the capacity for total traffic between the EAC member countries is still at less than 2.6 million available seats in 2013. This represents around 44 percent of total traffic within the region, highlighting the key role of domestic traffic, particularly in larger countries such as Kenya and Tanzania.
Figure 5.1 Intra-EAC Traffic, 2004–13
Source: Analysis based on data from DiiO SRS Analyzer (2013).
Note: Bi-directional traffic capacity. Number after year indicates month, 07 = July. EAC = East African Community.
Some domestic markets have grown considerably in recent years, especially in Rwanda and Tanzania. After a period of decline between 2008 and 2010, Tanzania in particular has managed to increase its capacity significantly, reaching almost the same level of domestic traffic as Kenya, the largest domestic market in EAC (see figure 5.2).
Figure 5.2 Domestic Traffic Kenya and Tanzania, 2004–13
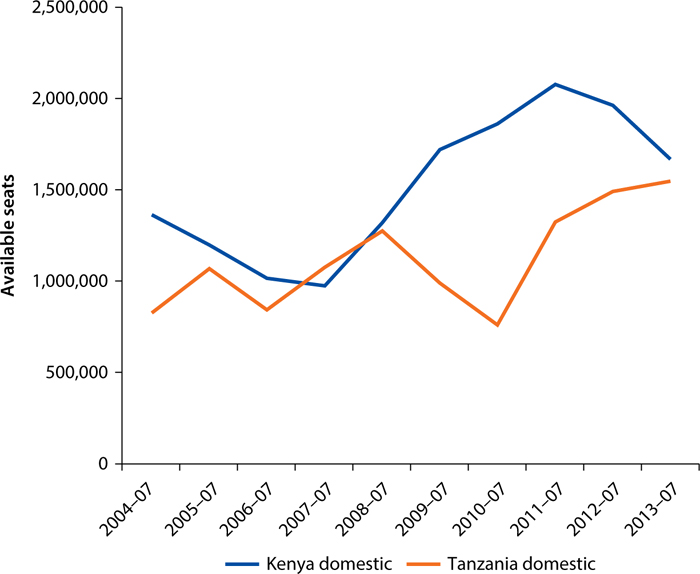
Source: Based on data from DiiO SRS Analyzer (2013).
Note: Bi-directional traffic capacity. Number after year indicates month, 07 = July.
Rwanda experienced a spike in domestic air transport starting in 2010 (see figure 5.3), with the country’s national airline Rwandair increasing its weekly frequency between Kigali and Cyangugu sixfold between 2010 and 2013. After a short period of increased traffic, Uganda’s domestic market has been declining considerably (see figure 5.3), with many of the domestic, probably largely unprofitable, routes being abandoned by 2010. Burundi currently has no scheduled domestic air transport.
Figure 5.3 Domestic Traffic Uganda and Rwanda, 2004–13

Source: Analysis based on data from DiiO SRS Analyzer (2013).
Note: Bi-directional traffic capacity. Number after year indicates month, 07 = July.
As map 5.1 shows, the majority of traffic in East Africa can be broadly divided into three main categories: (a) a few high-frequency domestic routes in Tanzania and Kenya; (b) a small number of key intra-EAC routes with low frequency; and (c) a number of secondary, low-capacity intra-EAC routes. The top 15 routes amount to around 80 percent of the overall EAC market.
Map 5.1 Route Network Map of EAC
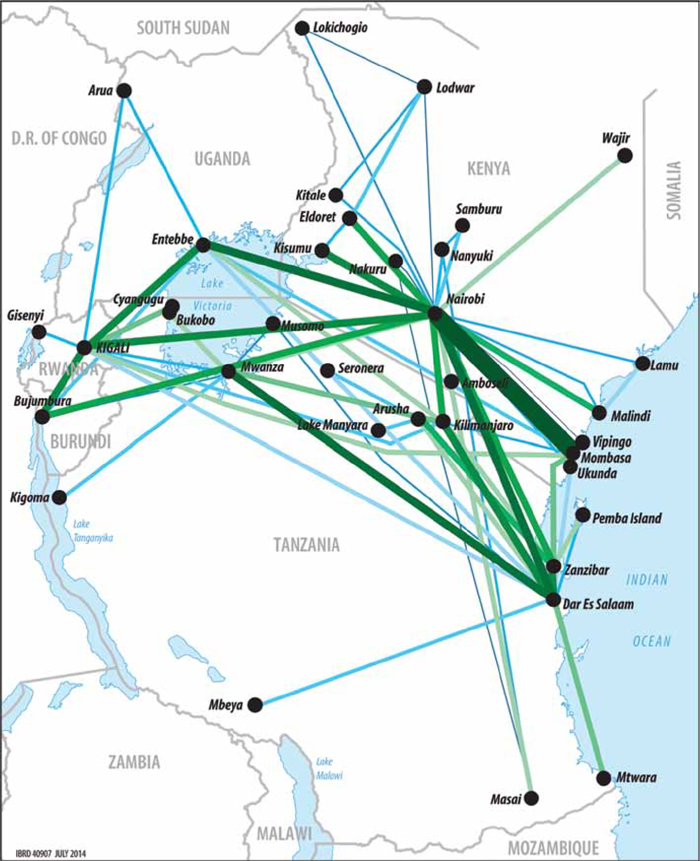
Source: Based on data from DiiO SRS Analyzer (2013).
Note: Thickness of a route indicates the level of traffic intensity (thick = high, thin = low). EAC = East African Community.
A few high frequency domestic routes represent a large share of overall traffic in the EAC. These are located primarily in Tanzania and Kenya, connecting their respective entry hubs in Dar es Salaam (DAR) and Nairobi (NBO) to their main economic and tourism centers. In Kenya, direct domestic traffic primarily links Nairobi (NBO) and Mombasa (MBA), Kenya’s two largest cities and economic centers. There are 15–17 roundtrip daily flights connecting the two cities. High frequency domestic traffic also occurs between Dar es Salaam (DAR) and Mwanza (MZW), Kilimanjaro (JRO) and Zanzibar (ZNZ). This feeds tourism traffic from the country’s capital airport to popular tourist destinations.
International intra-EAC traffic is limited to a few key routes, primarily linking the EAC’s large- and medium-size cities to the region’s hub in Nairobi. In addition, key routes include services between capital cities such as Entebbe (EBB) and Kigali (KGL), and Kigali (KGL) and Bujumbura (BJM), as well as popular tourist destinations such as the route from Zanzibar to Mombasa. Together, the top 15 intra-EAC routes comprise almost 90 percent of all international intra-EAC traffic in 2013.
Some of these routes have grown consistently in recent years, such as the Nairobi (NBO) to Kigali (KGL), or the Entebbe (EBB) to Kigali (KGL) route. Others have undergone significant fluctuations, including the Nairobi (NBO) to Entebbe (EBB) route, or the Dar es Salaam (DAR) to Nairobi (NBO) route. The former experienced a considerable drop in capacity in 2005 and 2006, after Ethiopian Airlines suspended its flights on the routes in 2005. Trying to resume the flights in 2006, the Kenyan government refused to grant traffic rights to the carrier (New Vision 2006). This left Kenya Airways as the sole provider on the route for some time.
Intra-EAC traffic is dominated by few carriers and competition is very limited. As figure 5.4 shows, most intra-EAC routes are operated by one or two carriers. Even on routes where more than two carriers operate, such as the Nairobi (NBO) to Entebbe (EBB) route or the Nairobi (NBO) to Dar es Salaam (DAR) route, these routes are mostly dominated by one carrier (figure 5.5). However, a few routes from Kigali have been served by multiple carriers, with Ethiopian Airlines and South African Airways applying their fifth freedom rights.
Figure 5.4 Number of Carriers per Top Intra-EAC Routes, July 2013
percent
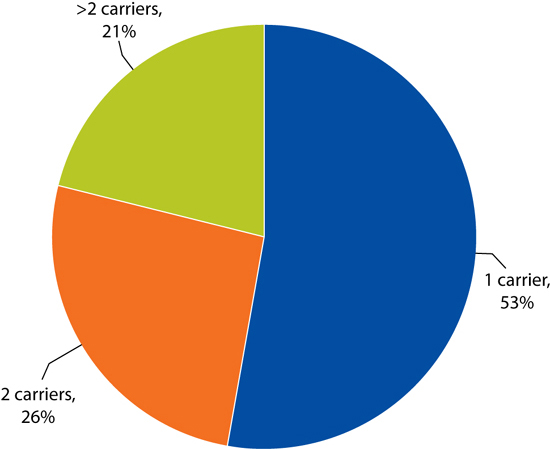
Source: Analysis based on data from DiiO SRS Analyzer (2013).
Figure 5.5 Market Share per Carrier on Top Intra-EAC Routes, July 2013
available seats (%)
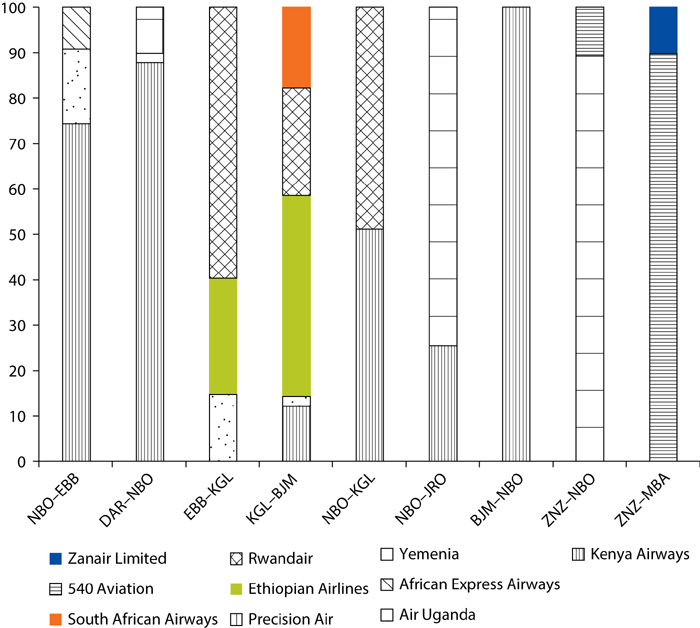
Source: Analysis based on data from DiiO SRS Analyzer (2013).
Note: BJM = Bujumbura International Airport, Burundi; DAR = Julius Nyerere International Airport (Dar es Salaam), Tanzania; EAC = East African Community; EBB = Entebbe International Airport, Uganda; JRO = Kilimanjaro International Airport, Tanzania; KGL = Kigali International Airport, Rwanda; MBA = Moi International Airport (Mombasa), Kenya; NBO = Jomo Kenyatta International Airport (Nairobi), Kenya; ZNZ = Abeid Amani Karume International Airport (Zanzibar), Tanzania.
In domestic markets, Tanzania appears to have the least concentration on its routes, with a handful of segments served by more than one carrier. In Kenya’s large domestic market, many routes are still served only by Kenya Airways, although some key routes have seen the entry of competitors—driven by the country’s move toward a deregulated domestic market. The entrance of the LCC Fly540 (discussed later), for example, has brought some competition to the more prominent domestic routes previously only served by Kenya Airways. Prior to the airline’s entry, the domestic market appears to have been clearly divided between the more prominent domestic routes (for example, Nairobi to Mombasa or Eldoret) served by Kenya Airways, and the thinner routes by local carrier Air Kenya Express. This division occurred in recent years with the exit of domestic carriers, such as JetLink Express (which ceased operations in 2012) and African Express Airways from some these routes. In Rwanda and Uganda, the small domestic markets are monopolized by one carrier, Rwandair and Eagle Air. Considering the low traffic volumes in these markets though, the ability of another airline to operate profitably is in some cases questionable.
In addition, there are a number of domestic and some international so-called “milk-runs,” or multistop routes, such as Nairobi (NBO) to Kisumu (KIS) to Eldoret (EDL) to Nairobi (NBO); and Nairobi Wilson Airport (WIL) to Samburu (UAS) to Nanyuki (NYK) to Masai Mara (MRE) in Kenya; or Kilimanjaro (JRO) to Zanzibar (ZNZ) to Dar es Salaam (DAR) in Tanzania. These all show very limited traffic however.
Although still struggling with some unprofitable state-owned carriers such as Rwandair (Butera 2013) and Air Burundi—and in contrast to other regions in Sub-Saharan Africa—the market in the EAC has developed a few privately owned carriers. This includes, for example, Air Uganda which was created after the liquidation of the failing national carrier Uganda Airlines. The airline is part of the Celestair Group of African carriers, which is owned by the Aga Khan Fund for Economic Development (AKFED). Another private airline is Precision Air, the growing Tanzanian carrier, which posted a profit of around US$400,000 in 2012. However, in 2013, the airline had to report losses of US$18.9 million apparently due to “overly ambitious growth.” The carrier expanded its network considerably in that year and leased three B737–800 aircraft (CAPA 2013a). The region has also witnessed the successful privatization of Kenya’s national carrier Kenya Airways in 1995, the largest carrier in the region. In addition, there are a handful of smaller domestic scheduled and charter operators primarily in Kenya and Tanzania, such as Air Kenya Express, Regional Air, and Zanzair. A detailed list of the major carriers in the region can be found in appendix E.
Despite the positive progress in privatization, government intervention in the air transport sector may not have disappeared entirely. Kenya Airways’ financial difficulties led to a recent news announcement stating that the government of Kenya is considering increasing its share in the carrier (Muiri 2013). This may serve as an indicator for a potentially more active involvement of the government in the air transport market. A small sign of intervention was already evident with the denial of traffic rights for Ethiopian Airlines in 2006, which left Kenya Airways as the only provider on the Entebbe (EBB) to Nairobi (NBO) route. The Ugandan government also announced recently that it was planning to re-launch its national carrier Air Uganda. The airline went into bankruptcy in 2001 after unsuccessfully trying to attract foreign investors (CAPA 2013b). Even the government of Tanzania is considering an equity stake in Precision Air (CAPA 2013a).
Due to limited traffic in the region, most airlines use smaller turboprop aircraft (for example, ATR-42 and 72, DHC-8), some regional jets (for example, CRJ Bombardier), as well as a very limited number of narrow-body jets (for example, B737, A320, Embraer E-Jet) for intra-regional routes. In addition, there are a number of small domestic and regional airlines such as Zanair operating with smaller piston engine aircraft (for example, Cessna 402).
As figure 5.6 shows the frequent usage of aircraft with capacities below 100 seats is fairly common in the region. As a recent analysis by Bombardier shows, there has been a shift in the usage of aircraft in Africa to 75–100-seat aircraft, which more than doubled between 2007 and 2012 (Carrier 2013).
Figure 5.6 Number of Flights per Aircraft Size, July 2013 (Intra-Regional and Domestic)
percent
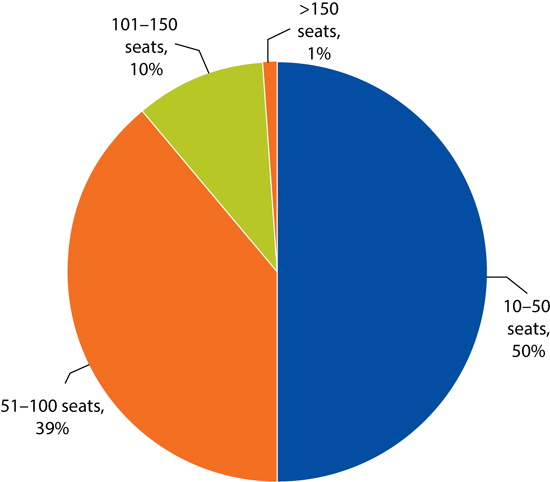
Source: Analysis based on data from DiiO SRS Analyzer (2013).
Even with smaller aircraft, airlines operating in Africa generally experienced lower load factors. A study by the International Air Transport Association (IATA) showed that in 2013, load factors were around 10 percent lower than in most other regions (IATA 2013). This signals that the usage of larger aircraft would most likely not be sustainable. The viability of regional jets for the LCC model is still questionable, however, due to generally higher unit costs (per available seat kilometer or mile: CASK or CASM) in comparison to the commonly used A320 and B737 narrow-body jets.
The region has already seen the emergence of its first low-cost airlines. In 2006, Fly540, a Kenya-based, low-cost airline was established. The carrier, owned by Five Forty Aviation Ltd., with a 49 percent investment stake by British company Lonrho Africa, introduced the first LCC model to the region. Based on its name, Fly540 offered a no-frills air transport service for 5,540 Kenya shillings (K Sh; approximately US$60) roundtrip fare. Starting with the high traffic Nairobi (NBO) to Mombasa (MBA) route with a 48-seat ATR42 aircraft, the airline expanded quickly adding new aircraft (two Dash 8–100s), and extending its route network to include Kisumu, Eldoret, Malindi, Lodwar, and Lamu in Kenya. Later it also targeted international destinations in the Republic of South Sudan, Tanzania, the Democratic Republic of Congo, and Uganda by acquiring the Kenyan carrier East African Safari Air Express in 2010 (Thome 2010). Some of these expansion plans were later abandoned, however, primarily due to political and financial reasons (CAPA 2012). The company also set up its first franchise in Tanzania based at Mwanza Airport, operating flights to Zanzibar, Dar es Salaam, and Nairobi (CAPA 2012).
Building on its success in East Africa, Fly540 set up operations in Angola and Ghana in 2011. In Angola, Fly540 focuses on domestic operations between the country’s capital Luanda and smaller cities, such as Soyo, Benguela, Cabinda, and M’banza Congo (Fly540 Africa 2013). The Angola operation commenced with a significant delay as the country had been under scrutiny by the International Civil Aviation Organization (ICAO) and the country’s primary carrier had been blacklisted by the European Union due to safety concerns (CAPA 2011). In Ghana, services were initially operated to Tamale, Kumasi, and Takoradi domestically, and Abidjan and Freetown internationally. However, these services were discontinued, and according to the airline’s website, the only operation remaining is between Accra and Kumasi, a wealthy mining city northwest of Accra. Although intending to become a regional hub, plans to develop services to Senegal and Equatorial Guinea were not realized. The airline also voiced ambitions to set up franchises in Rwanda, Zambia, and Zimbabwe, among other countries. By the end of 2011, the carrier recorded passenger figures of almost half a million (easyGroup 2013) across its operations with a fleet of 10 aircraft by June 2012 (CAPA 2012). In contrast, by its fourth year of operation in 2000, easyJet in Europe had recorded 5.6 million passengers (CNN 2000) with a fleet of 14 B737 aircraft (Planespotters 2013).
Despite this aggressive expansion strategy and increasing passenger growth, Lonrho Aviation’s operations did not yield the desired results. In September 2009, it reported a loss (after tax) of US$7.5 million for the previous 12 months. This loss increased even further in September 2010 and 2011 to US$13.1 million and US$19.0 million, respectively. The 12 months ending September 30, 2009, showed a 24 percent negative operating margin, which increased to 35 percent the following year (September 2010), and then slightly decreased to 31 percent for the 15 months to December 31, 2011 (CAPA 2012). The airline’s losses were primarily attributed to the establishment of its new franchises in Angola and Ghana, as well as unprofitable operations in Uganda. In addition, the carrier had been struggling with fuel-inefficient, small aircraft and insufficient utilization rates.
In 2012, Rubicon Ltd., a British investment company, purchased Lonrho’s aviation arm and its investments in Fly540. The payment to Lonrho consisted of Rubicon shares for a total value of US$85.7 million, representing 73.7 percent of Rubicon’s enlarged issued share capital. Another 5 percent of shares are owned by Sir Stelios Haji-Ioannou of easyGroup Holding Limited, the parent company of European LCC easyJet. Under a brand licensing agreement with easyGroup, the airline rebranded itself into fastjet (Lonrho Aviation 2012).
Fastjet has announced its transformation into a “real” low-cost airline, replacing the carrier’s turboprop aircraft with Airbus 319s. In addition, it engaged in alternative distribution channels such as mobile distribution channels to avoid the expensive costs of global distribution system (GDS) providers. The airline was planning to increase its fleet to 15 A319 aircraft by the end of 2013 (CAPA 2013c). Its service offering is not entirely clear, but appears to be influenced by the LCC model of easyJet—attracting business and leisure travelers by offering food and beverages, priority boarding, and seating at a charge—and most importantly, providing connections to intercontinental carriers (CAPA 2012).
Focusing firstly on the East African market, the airline has encountered numerous challenges. It has an ongoing legal dispute with Five Forty Aviation, the previous owner of the Kenya Fly540 brand (and, although debated, still its majority shareholder) about operations into and within Kenya, as well as delays in obtaining international flying rights from Tanzania into other markets in the region. The airline has therefore been able to take over only Fly540’s domestic operations in Tanzania. The delay in commencing operations in Kenya is particularly challenging as the launch of Kenya Airways’ long-awaited LCC Jambo Jet seems to be coming closer. Trying to free up some much needed funds to recoup the cost incurred from these delays, the company has announced that it intends to reduce its 90 percent equity shareholding in Fly540 Tanzania (Peterson 2013).
While trying to salvage its position in East Africa, Fly540’s West African operations in Angola and Ghana (in which fastjet owns 60 percent and 92.5 percent of shares respectively) have also significantly underperformed in 2012. Fly540 Angola has been struggling with bureaucratic hurdles, such as stringent regulations on transactions imposed by the Angolan Central Bank, and customs delays affecting the delivery of aircraft spares. Fly540 Ghana has faced intense competition on its Accra (ACC) to Kumasi (KMS) route with the entrance of two new LCCs, Starbox and Africa World Airlines. The carrier’s cost structure has also been severely affected by excessive passenger taxes, airport services charges, and fuel price increases (CAPA 2013d).
As a result, fastjet posted a loss of US$56 million for the 18 months leading up to December 31, 2012. The auditors, KPMG, voiced concerns about the company’s stocks’ ability to continue to be traded on the London Stock Exchange. Losses in West Africa have been particularly detrimental, amounting to US$17.8 million (CAPA 2013d).
However, since the beginning of 2013, the company has demonstrated success in the Tanzanian market, with high average load factors on the routes between Dar es Salaam (DAR) and Kilimanjaro (JRO), and Dar es Salaam (DAR) and Mwanza (MWZ), where 38 percent of passengers were first-time flyers. Recently, Fly540 Ghana has also experienced increased bookings. In May 2013, it recorded an 11 percent increase from April 2013 and 52 percent from May 2012. Web-based sales in the country have experienced a large increase of nearly 400 percent, reducing the company’s distribution costs. In addition, the airline has managed to finalize a license-based joint venture with a South African investment company, Blockbuster, to enter the South African domestic market. This finally succeeded after a variety of attempts to enter the market, including the proposed purchase of bankrupt South African carrier 1Time (CAPA 2013d). Despite this promising outlook, the overall viability of the carrier still remains to be seen.
In order to provide an assessment of fare levels in the EAC market, two comparisons are made; one for domestic and one for intra-EAC routes, with routes in other regions that are currently operated by LCCs (see appendix F for detailed methodology and sample airports chosen).
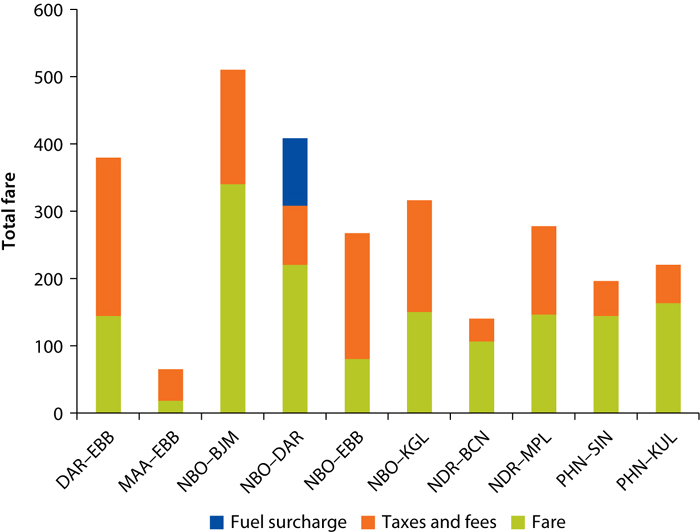
As figure 5.7 shows, the lowest available return fares on comparable routes are significantly lower than on intra-EAC routes. Particularly routes originating from Morocco and Cambodia prove to be significantly lower. The route between Nairobi (NBO) and Dar es Salaam (DAR), for example, is over 100 percent more expensive than the route between Kuala Lumpur (KUL) and Phnom Penh (PNH). The fare from Nairobi (NBO) to Zanzibar (ZNZ) is almost three times higher than from Chennai (MAA) to Colombo (CMB).
Figure 5.7 Comparison of Lowest Available Return Fare between Intra-EAC and Other International Routes (Including Taxes and Charges)

Sources: Analysis based on airline websites, Air Uganda, Jet Airways, Kenya Airways, Precision Air, Rwandair, Ryanair, AirArabia Maroc, Jetstar Asia, Air Asia, and Fly540; and DiiO SRS Analyzer (2013).
Note: BCN = Barcelona el Prat Airport, Spain; BJM = Bujumbura International Airport, Burundi; CMB = Bandaranaike International Airport (Colombo) Sri Lanka; DAR = Julius Nyerere International Airport (Dar es Salaam), Tanzania; EAC = East African Community; EBB = Entebbe International Airport, Uganda; KGL = Kigali International Airport, Rwanda; KUL = Kuala Lumpur International Airport, Malaysia; MAA = Chennai International Airport, India; MPL = Montpellier Méditerranée Airport, France; NBO = Jomo Kenyatta International Airport (Nairobi), Kenya; NDR = Nador International Airport, Morocco; PNH = Phnom Pen International Airport, Cambodia; SIN = Singapore Changi Airport; ZNZ = Abeid Amani Karume International Airport (Zanzibar), Tanzania.
In looking at the distribution of cost versus taxation and charges, it is clear that taxation and charges comprise a large percentage of total fares on intra-EAC markets (see figure 5.8). There are also some cases where the base fare is much higher, such as on the Nairobi (NBO) to Bujumbura (BJM) route, which could be directly linked to the limited competition on this segment.
Figure 5.8 Distribution Fare Basis versus Taxation and Charges, 2013
US$
Sources: Analysis based on airline websites including Air Uganda, Jet Airways, Kenya Airways, Precision Air, Rwandair, Ryanair, AirArabia Maroc, Jetstar Asia, Air Asia, and Fly540; and DiiO Analyzer (2013).
Note: ZNZ-NBO had to be excluded as website did not provide for a breakdown of the fare. BCN = Barcelona el Prat Airport, Spain; BJM = Bujumbura International Airport, Burundi; CMB = Bandaranaike International Airport (Colombo) Sri Lanka; DAR = Julius Nyerere International Airport (Dar es Salaam), Tanzania; EBB = Entebbe International Airport, Uganda; KGL = Kigali International Airport, Rwanda; KUL = Kuala Lumpur International Airport, Malaysia; MAA = Chennai International Airport, India; MPL = Montpellier Méditerranée Airport, France; NBO = Jomo Kenyatta International Airport (Nairobi), Kenya; NDR = Nador International Airport, Morocco; PNH = Phnom Pen International Airport, Cambodia; SIN = Singapore Changi Airport; ZNZ = Abeid Amani Karume International Airport (Zanzibar), Tanzania.
As figure 5.9 shows, fares on domestic routes in Kenya are generally more expensive than the routes in the chosen sample. Interestingly, on the routes where LCC Fly540 is present in Kenya, Kenya Airways actually undercuts the LCC by a small margin on the chosen dates, thereby displaying some sign of fare convergence in the market. The competition with the LCCs seems to have brought down fares to a similar level than on comparable sectors for some routes, such as the Nairobi (NBO) to Mombasa (MBA) route, but not on others such as the Nairobi (NBO) to Eldoret (EDL) and the Nairobi (NBO) to Kisumu (KIS) routes.
Figure 5.9 Comparison of Lowest Available Domestic Fare (Including Taxes and Charges)
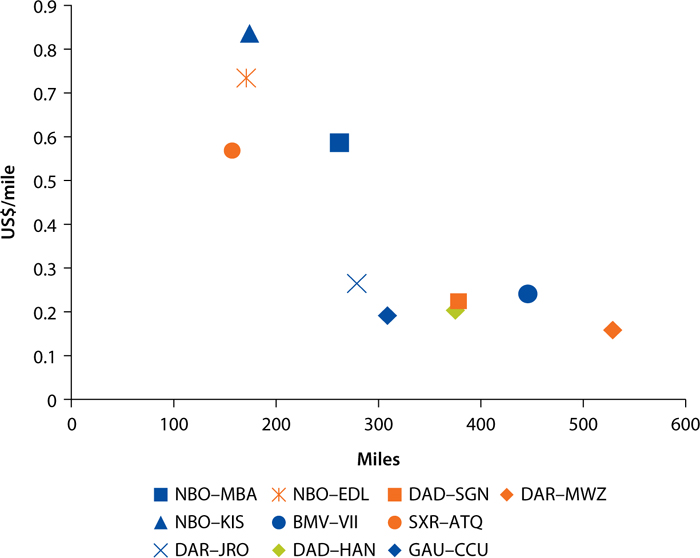
Sources: Analysis based on airline websites including Kenya Airways, Precision Air, Fastjet, Jetstar Pacific, and Spicejet; and DiiO SRS Analyzer (2013).
Note: ATQ = Sri Guru Ram Dass Jee International (Amritsar), India; BMV = Buon Ma Thuot Airport, Vietnam; CCU = Netaji Subhas Chandra Bose International Airport (Kolkata), India; DAD = Da Nang International Airport, Vietnam; DAR = Julius Nyerere International Airport (Dar es Salaam), Tanzania; EDL = Eldoret International Airport, Kenya; GAU = Guwahati Airport, India; HAN = Noi Bai International Airport (Hanoi), Vietnam; JRO = Kilimanjaro International Airport, Tanzania; KIS = Kisumu International Airport, Kenya; MBA = Moi International Airport (Mombasa), Kenya; MWZ = Mwanza Airport (Mwanza) Tanzania; NBO = Jomo Kenyatta International Airport (Nairobi), Kenya; SGN = Tân So’n Nhât International Airport (Ho Chi Minh City), Vietnam; SXR = Srinagar International Airport, India; VII = Vinh Airport, Vietnam.
In Tanzania, the entrance of LCC fastjet appears to have lowered fares considerably on par with similar routes in India and Vietnam. One reason for the lower fares offered by fastjet is its removal of the added fuel surcharge of US$80 that its competitor, Precision Air, adds to the ticket price. The exception appears to be the Dar es Salaam (DAR) to Zanzibar (ZNZ) route (not depicted in figure 5.9), which has very high fares per mile. Some of the difference in fare may likely be a result of the enlarged distance on some routes, particularly for the Buon Ma Thuot (BMV) to Vinh City (VII) route in Vietnam.
When comparing the distribution of costs between the actual fare and taxes (see figure 5.10), an interesting result can be seen. With the exception of the two routes chosen in the Indian domestic market, base fares in Vietnam are at similar levels or even higher than fares in Kenya and Tanzania. As with international routes, taxation and fees are the key drivers of higher fares.
Figure 5.10 Distribution Fare Basis versus Taxation and Charges
US$
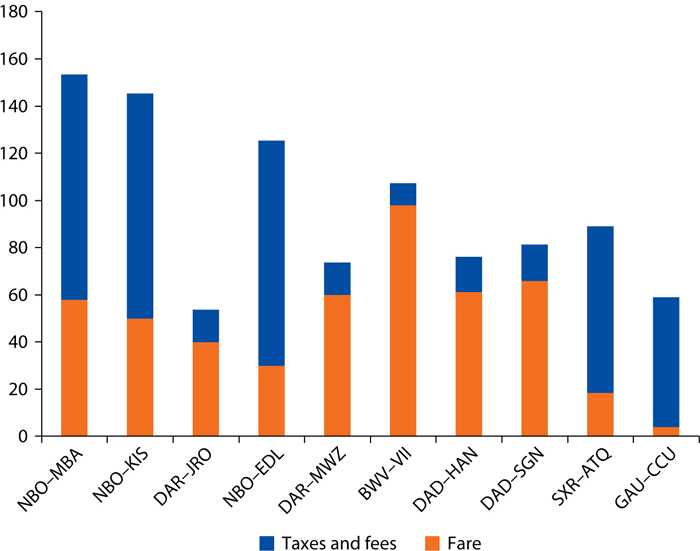
Sources: Analysis based on airline websites, including Kenya Airways, Precision Air, Fastjet, Jetstar Pacific, and Spicejet; and DiiO SRS Analyzer (2013).
Note: ATQ = Sri Guru Ram Dass Jee International (Amritsar), India; BMV = Buon Ma Thuot Airport, Vietnam; CCU = Netaji Subhas Chandra Bose International Airport (Kolkata), India; DAD = Da Nang International Airport, Vietnam; DAR = Julius Nyerere International Airport (Dar es Salaam), Tanzania; EDL = Eldoret International Airport, Kenya; GAU = Guwahati Airport, India; HAN = Noi Bai International Airport (Hanoi), Vietnam; JRO = Kilimanjaro International Airport, Tanzania; KIS = Kisumu International Airport, Kenya; MBA = Moi International Airport (Mombasa), Kenya; MWZ = Mwanza Airport (Mwanza) Tanzania; NBO = Jomo Kenyatta International Airport (Nairobi), Kenya; SGN = Tân Son Nhâ´t International Airport (Ho Chi Minh City), Vietnam; SXR = Srinagar International Airport, India; VII = Vinh Airport, Vietnam.
The identification of potential comparable routes revealed that LCCs in countries in Asia with similar gross domestic product (GDP) per capita and population (allowing for a considerable margin) are almost always connected to a large economic hub such as Singapore or Kuala Lumpur internationally. These not only provide the high feed into those routes, but also have a significantly larger GDP per capita. No examples could be found where countries with similar GDP per capita to EAC countries have LCC services between them at such distances and population numbers. A more extensive analysis over a specific time period would need to be done to validate these results.
As noted, the EAC air transport market is still at its early development stages with few routes of significant traffic and a high concentration of carriers, which include state-owned and, in some cases, possibly “government favored” airlines. The industry has, however, seen a new breed of private carriers such as Precision Air and Air Uganda, as well as the development of an LCC. Despite current limited traffic, leading aircraft manufacturers project significant growth in Africa’s air transport market. Airbus has forecast average annual growth rates for traffic to and within Africa to reach 5.7 percent between 2012 and 2031, well above the global growth of 4.7 percent. Between 2012 and 2031, domestic and intra-regional traffic, of crucial importance for LCCs, is expected to grow at 6.2 percent per year (Airbus 2013).
In order to assess the opportunities for growth in air travel demand, this section elaborates on some of the factors that could influence potential underlying demand, and which could provide the basis for increased air transportation, in particular LCC development in the EAC region.
Spurred by overall political and macroeconomic stability as well as pro-market reforms, the countries of the EAC have seen considerable economic growth in the last decade.
As figure 5.11 shows, all EAC countries have experienced positive GDP growth rates since 2008, in particular Rwanda, Uganda, and Tanzania with average growth rates between 6.4 percent and 8.2 percent. Burundi, plagued by years of civil conflict, has experienced a more stagnant level of growth and Kenya, the largest economy in the region, has showed fluctuating growth levels, with particularly low levels of growth in 2008/2009. The fluctuations were caused by its exposure to the global financial crisis, including reduced flows of remittances and the depreciation of the shilling (McKormick 2008). Overall, GDP growth for most EAC countries appears to be in line or above the average GDP growth rate of 4.1 percent experienced across Sub-Saharan developing countries.
Figure 5.11 GDP Growth in EAC Countries, 2008–12
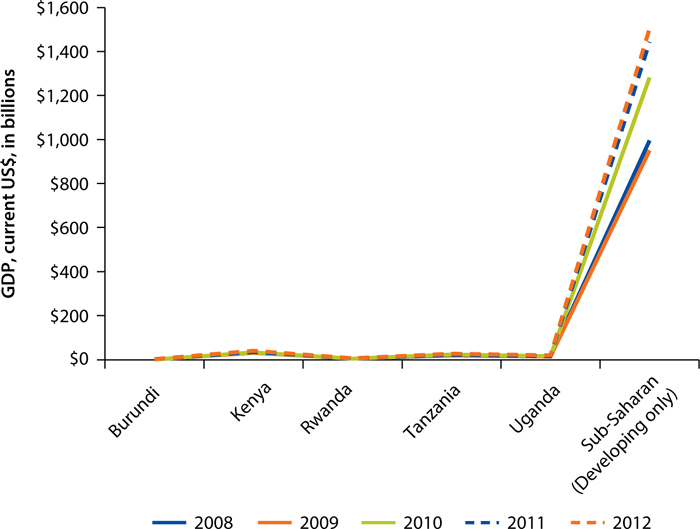
Source: World Bank 2013c.
Note: EAC = East African Community.
With strong GDP growth, per capita incomes have also been increasing steadily. According to the International Monetary Fund, average per capita income (weighed by population in year 2000 dollars) in EAC had reached US$411 in 2010, close to the US$425 average for Sub-Saharan Africa (excluding South Africa and Nigeria). However, wide variations remain within the region with Kenya displaying an average per capita income of US$464 in comparison to US$147 in Burundi (McAuliffe, Saxena, and Zabara 2012).
Figure 5.12 shows air transport intensity (domestic and international) in relation to GDP per capita. As indicated, EAC countries, when compared with countries with similar GDP per capita, display a comparable or higher number of weekly flights per million inhabitants. The exception is Uganda, which has a significantly lower number of weekly flights per million inhabitants. This indicates that, all other things being equal, the air transport market in Uganda still has room for growth at current income levels.
Figure 5.12 Flight Intensity in EAC Countries, 2012
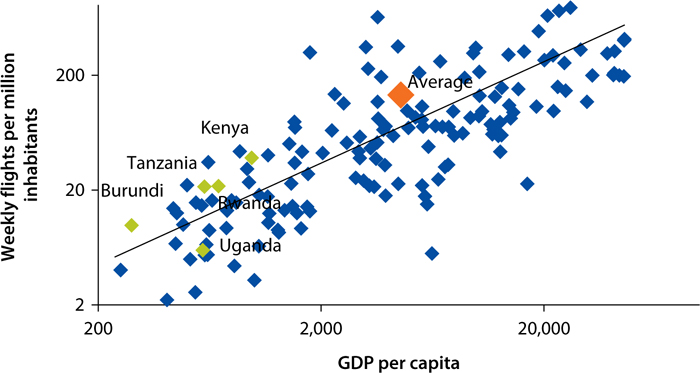
Sources: Analysis based on DiiO SRS Analyzer (2013) and World Bank (2013c).
Note: EAC = East African Community.
Despite good GDP per capita growth across the region, the emergence of a strong and large middle class has been slow. Poverty levels are still very high in the region, in particular in Burundi where over 90 percent of the population lives below US$2 (purchasing power parity [PPP])2 a day (see figure 5.13). Similar figures can be seen for Rwanda and Tanzania. This puts air transport, even at a lower fare, out of reach for the majority of the population. Indicators measuring inequality, such as the GINI index, are a direct reflection of this (figure 5.14). The Gini coefficient (in figure 5.14, shown as the GINI index) is the most commonly used measure of inequality. The coefficient varies between zero, which reflects complete equality, and one, which indicates complete inequality (that is, one person has all the income or consumption, all others have none). As figure 5.14 highlights, GINI coefficients for Rwanda, Kenya, and Uganda are particularly high.
Figure 5.13 Poverty Headcount Ratio at $2 (PPP)
percent

Source: World Bank 2013c.
Note: PPP = purchasing power parity.
Figure 5.14 GINI Index for EAC
percent

Source: World Bank 2013c.
Note: EAC = East African Community.
Another measure indicative of the levels of inequality is income share distribution (see figure 5.15). In contrast to the GINI coefficient, this gives a clearer picture of where shifts are occurring within the different income classes over time. Due to the lack of data for EAC countries, however, figure 5.15 is only able to display a snapshot of the most recent data. Still, it clearly indicates a strong unequal distribution of wealth in EAC countries. In Rwanda, Kenya, and Uganda, for example, the top 20 percent of the population holds over 50 percent of the country’s income. In Uganda, where two data points are available, this inequality appears to be increasing further since 2006.
Figure 5.15 Wealth Distribution in EAC Countries
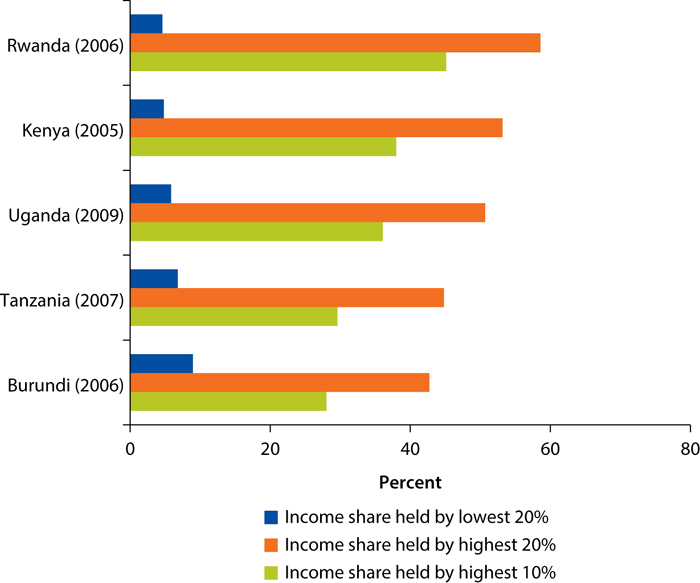
Source: World Bank 2013c.
Note: EAC = East African Community.
According to an analysis of the region undertaken by the International Monetary Fund (IMF), in order to achieve significant poverty reduction and middle-income status, the region’s real GDP per capita will have to grow at an average rate of 5.5 percent until the end of this decade. This is around two percentage points faster than between 2005 and 2010. Kenya is probably closest to achieving middle-income status, whereas Uganda, Tanzania, and Rwanda would have to grow their per capita income by 7–8 percent a year. For Burundi, this is expected to take much longer.
Current IMF forecasts (IMF 2013) show a positive outlook for the economies of the EAC (see figure 5.16). However, its countries will have to focus on reducing poverty and inequality in order to establish a middle class that can afford air transport.
Figure 5.16 Forecasted GDP Per Capita Growth Rate in EAC Countries

Source: Calculation based on International Monetary Fund (IMF 2013).
Note: Base gross domestic product (GDP) in current prices, U.S. dollars. Year when estimate starts varies by country: Tanzania, 2006; Kenya, 2010; Rwanda, 2010; Burundi not applicable. EAC = East African Community.
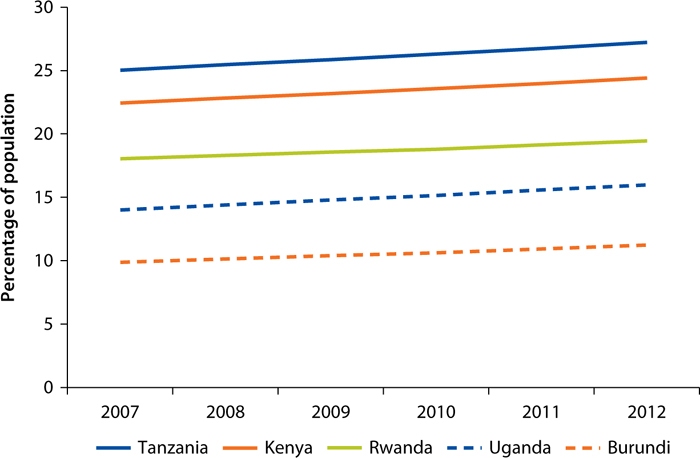
Population in the EAC has been continuously growing in recent years, with average growth rates ranging from 2.6 percent to 3.4 percent between 2007 and 2012 (see figure 5.17). Uganda and Burundi achieved the highest growth rate, with Uganda having the second highest fertility rate globally. Some organizations, such as the United Nations Population Fund (UNPF), have voiced concerns about this development, given that EAC countries still face challenges in providing the required education and employment for a growing younger generation (Emorut 2012b).
Figure 5.17 Population Growth in EAC, 2007–12

Source: World Bank 2013c.
Note: EAC = East African Community.
Population growth will be accompanied by a shift in migration from rural to urban environments. Urbanization has increased consistently between 2007 and 2012 (see figure 5.18). Tanzania’s urban population represents over a quarter of its total population, with 8 percent of the population found in Dar es Salaam. Urbanization in Burundi is still low at 11 percent, with 90 percent of the population consisting of self-subsistence farmers. Similarly, Uganda has large populations in rural lands tending to the agricultural exports (for example, coffee, cotton, tea) of the country. The primary sector employs 75 percent of the country’s work force (Uganda Bureau of Statistics 2007).
Urbanization has been seen as a key driver for economic growth, and consequently the development of air transport markets, particulary in Kenya and Tanzania. In both markets, urbanization is expected to grow, with forecasts for Kenya showing that by 2033, its population will be equally distributed between urban and rural areas (World Bank 2011b). Much of this urbanization will however be concentrated in few locations, particularly in Kenya where Nairobi and Mombasa represent the only cities with a population above one million and Kisumu, the third largest city, recording a population of only 400,000.
As outlined in chapter 4, LCCs primarily target leisure travelers, who are cost sensitive but more amenable with regard to service offerings and scheduling. This allows LCCs to operate with greater flexibility and limits operational complexity. The leisure category includes in particular tourist and visiting friends and relatives (VFR) travelers.
East Africa with its national parks, mountain ranges, and scenic beaches has become a popular destination for tourism. As figure 5.19 shows, the number of international arrivals has grown considerably in most EAC countries.
Uganda has shown particularly high growth, which can be attributed to the increase of tourists from Asia to its famous national parks, and its relative political stability and security (Emorut 2012a). Both Tanzania and Rwanda have also experienced increasing visitors between 2006 and 2010. Rwanda, after having restructured its tourism sector in 2001, has been particularly focused on attracting high-end customers. This has been reflected in the major private investments that have been made to upgrade accommodations in the market. Both Marriott and Sheraton hotel chains are constructing 5-star facilities for US$160 million and employing about 200 people (Rwigamba 2013). Kenya’s tourism industry experienced a large drop in arrivals in 2007 and 2008 due to the outbreak of violence and political instability, triggered by the events following the 2007 Kenyan elections. The industry is recovering, however, and recorded almost 1.5 million international tourists in 2010 (UNWTO 2011). Burundi is still lagging considerably behind due to years of civil strife and limited tourism infrastructure.
EAC tourism is dominated primarily by European and American visitors. In Kenya, for example, the Kenya Tourism Board found that in 2010 almost half of its tourists originated from only five countries (the United Kingdom, the United States, France, Italy, and Germany) (Kenya Ministry of Tourism 2010). In Tanzania, a survey by the Tanzania National Bureau of Statistics and the Bank of Tanzania also showed that arrivals from Italy, the United States, the United Kingdom, and Germany dominate the tourism market (Tanzania National Bureau of Statistics 2012). More recently, intra-African and intra-EAC tourism have also been recorded. In Kenya, recorded tourist arrivals from Uganda and Tanzania were 33,900 and 30,264 visitors respectively (Kenya Ministry of Tourism 2010) and in Rwanda around 40 percent of visitors originated from the region in 2010. Only 5 percent traveled for tourism purposes however (Rwanda Development Board n.d.). Similarly, in Uganda arrivals from Africa seem to dominate its market but only 5 percent are tourists (Uganda Bureau of Statistics 2010), while European visitors primarily dominate the tourism market (Balinda 2013). No equivalent information could be found for the tourism market in Burundi.
According to the World Tourism and Travel Council, tourism is forecast to grow considerably in the region. Between 2013 and 2023, international tourist arrivals in Kenya are set to grow to 2.6 million visitors (World Travel and Tourism Council 2013a). Similarly, for Rwanda this growth rate is forecast at around 4.6 percent (World Travel and Tourism Council 2013b). Expected growth is even higher in Uganda (World Travel and Tourism Council 2013c) and in Tanzania (World Travel and Tourism Council 2013d), at about 5.6 percent and 5 percent respectively.
This growth will be of particular importance, as tourism plays a crucial role in the economies of the EAC. As figure 5.20 shows, for Rwanda and Uganda, tourism comprises a large percentage of their exports.
Figure 5.20 International Tourism Receipts, 2010
percentage of total exports

Source: World Bank 2013c.
Significant efforts have therefore been made to facilitate intra- and inter-regional tourism. The EAC Secretariat is trying, for example, to remove restrictive customs and border control processes to facilitate travel in the region. To this end, all EAC member states met in July 2013, to outline new milestones for the introduction of a common EAC tourism visa, as well as a common passport for EAC member countries. The proposal has been deliberated since 2005, but has experienced significant delays resulting from security concerns, poor infrastructure, and disagreement over visa fee schedules and revenue-sharing frameworks. Leaving time to resolve these issues, the changes are now planned to be introduced by the end of 2014. In an initial step, all EAC countries have agreed to align their immigration laws and to put into place the technology needed for integrating their information network systems (Ramah 2013). These changes will also be a key factor for another known source of LCC demand, the so-called VFR travel resulting from intra-regional migration flows.
According to a 2011 World Bank study, more than 50 percent of migration in East Africa actually occurs within the region (Ratha and others 2011). Table 5.2 shows the migration stocks of EAC member countries as collated in the World Bank’s Migration and Remittances Factbook 2011 (World Bank 2011c). Unfortunately, data on migration in Africa are often missing, out-of-date, or inconsistent with definitions used in other countries. Therefore, such data should be interpreted with caution. For example, it is surprising to see that no migrants have been recorded from Burundi to Kenya.
Table 5.2 Estimates of Bilateral Migrant Stock, 2010
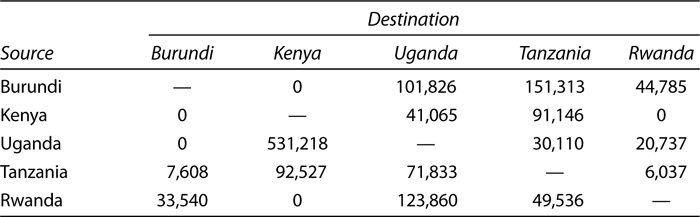
Source: Migration and Remittances Factbook (World Bank 2011b).
Note: — = not available.
Migration within the EAC has occurred because of several reasons. These are primarily economic (for example, employment and education) and/or political (that is, civil unrest, political instability). Assessing various patterns of migration within the region is very complex and would be outside the scope of this book. However, a few key developments that may potentially have an impact on future air travel demand are reviewed below.
One important factor for migration within the EAC has been the economic integration and free movement of labor in the region through the EAC Treaty. This has been particularly attractive for smaller, less developed, and historically unstable countries, such as Burundi and Rwanda. For example, Rwandese nationals, spurred by forced migration during the Rwanda Genocide in 1994, have a substantial presence in Uganda, Tanzania, and neighboring Burundi. Movements are further facilitated by language, cultural, or historical ties. Emigrants from Burundi and Rwanda, for example, often speak the same language as or have historical ties with the native populations in Uganda and Tanzania (Ratha and others 2011). High levels of migration have also been observed between Uganda and Kenya, potentially contributing to the increased traffic on the Entebbe (EBB) to Nairobi (NBO) route. The economic integration of the region and the introduction of a common passport are expected to further increase this growth.
Inefficient ground transport has been a key driver for the development of air transport and LCCs in developing countries. Figure 5.21 compares the numbers of visitors arriving by each mode of transport. It shows clearly that in Rwanda and Uganda, and to a lesser extent in Tanzania and Kenya, arrivals are often by land transport. The more detailed statistics for Rwanda show that land access is particularly prevalent for tourists. In 2011, 61 percent of arrivals by passengers traveling for tourism purposes entered by land (Rwanda Institute of Statistics 2012).
Figure 5.21 Arrival by Mode of Transport
percent
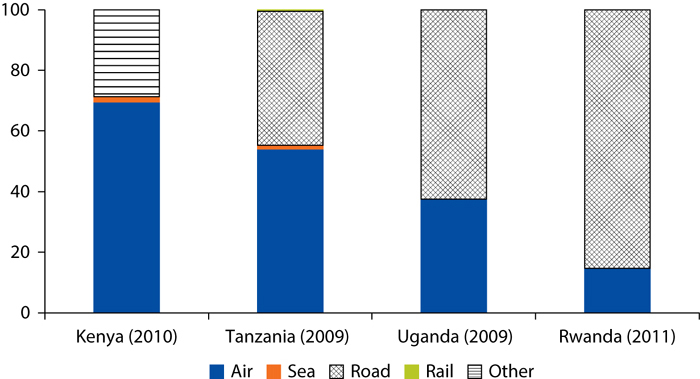
Sources: Analysis based on data from Kenya National Bureau of Statistics (2010); Uganda Bureau of Statistics 2010; National Institute of Statistics Rwanda 2012; and Tanzania Ministry of Natural Resources and Tourism 2010.
Note: Definition of mode may vary. In Kenya “other” includes rail and road transport.
Kenya displays a high share of arrivals by air, mostly due to traffic through the region’s hub in Nairobi (Kenya National Bureau of Statistics 2010).
In order to understand the market opportunities for “converting” land-based transport users to air travelers, it is important to look at the availability, quality, and cost of these means of transport. To assess this, the book draws upon an extensive analysis of transport infrastructure in the region conducted by the World Bank in 2011 (Ranganathan and Foster 2011).
As map 5.2 shows, EAC regional corridors are typically paved (around 73 percent of all roads are paved) and almost 80 percent of regional roads are in good or fair condition. Although few, there are some road segments of poor quality and significant unpaved stretches, as for example on the Dar es Salaam to Bujumbura route or on the Kampala to Kigali route. The poor condition of these roads slows traffic considerably.
Generally, all EAC members except Uganda show good maintenance records on their portions of the regional network. The EAC, together with development partners such as the African Development Bank, the Japanese Bank for International Cooperation, and the World Bank have focused on improving road conditions under the East African Road Network Project and other programs (NEPAD–OECD Africa Investment Initiative 2008).
Generally road infrastructure between larger cities in the EAC is in good condition, but the quality of rural roads providing access to primary roads, still varies significantly. A rural road condition assessment by the Africa Infrastructure Country Diagnostics (AICD) program (in Gwilliam and others 2011) shows that the quality of rural roads in the region is still poor. Among EAC states, Rwanda’s rural network is assessed the worst—with poor quality, rural roads across its entire network. In Uganda, over 50 percent of rural roads (by length) are still considered to be of inferior quality, whereas in Tanzania, Kenya, and Burundi, the share of poor quality rural roads falls below 50 percent. Kenya is the country with the most high quality roads in the region, followed by Burundi.
Map 5.2 Road Network: Major Primary Road by Type and Condition

Source: World Bank’s East Africa Infrastructure Report (World Bank 2011a).
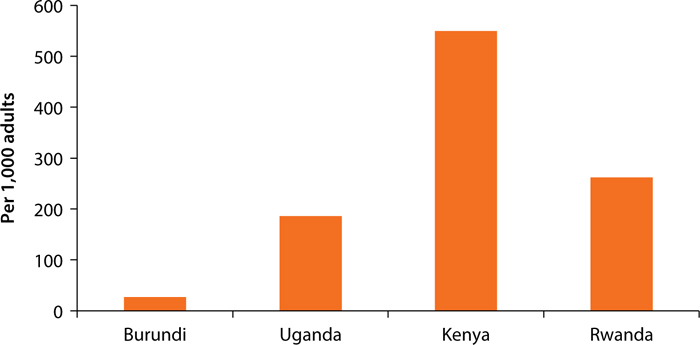
The use of passenger cars is still low in the EAC. In Rwanda, there were only 0.5 cars per 1,000 inhabitants in the year 2007, 2 in Burundi, 4 in Tanzania and 3 in Uganda. Kenya has the highest rate with 14 passenger cars per 1,000 inhabitants in 2010. This compares to 423 cars per 1,000 inhabitants in the United States and 457 in the United Kingdom for the same year. As access to passenger cars is still limited, reliance is high on other forms of ground transport, including buses and trains. There are various companies providing bus services in the region, primarily connecting major cities. A prominent provider is Scandinavia Express, offering high frequency bus service to 18 destinations within Tanzania, Kenya, Uganda, and Zambia. A one-way fare from Dar es Salaam to Nairobi costs around US$23, and between Kampala and Nairobi about US$30 (Scandinavia Express 2013). Two other Kenyan companies, Mash and Easy Coach primarily offer bus operations within Kenya and to Kampala. According to the Easy Coach website, a fare between Nairobi and Kampala is offered at US$27 (Easy Coach 2013). Some bus companies, such as the Riverside shuttle, have been particularly geared toward connecting incoming tourism at Nairobi Airport to destinations such as Kilimanjaro, offering competitive fares of US$20 for a one-way trip. This makes land transport in some cases, and on this route in particular, an attractive alternative and a significant competitor for LCCs.
Despite the availability of alternative modes of ground-based transport on certain routes, road safety is still a large concern in Africa. In 2010, the World Health Organization (WHO) estimated that nearly 8,484 people were killed on Kenyan roads in 2010 (WHO 2013). This translates into a death rate of 20.9 per 100,000 people. In contrast the United States and the United Kingdom, with much higher usage of cars, have death rates of 11.4 and 3.7 per 100,000 people respectively.
The EAC region does not have a truly integrated rail network, and only three railway lines run across more than one country, with the one linking Kenya to Uganda being the only one linking EAC countries. The quality of railways in EAC is relatively low, with little maintenance having been undertaken. Moreover railway infrastructure is only capable of light and slow-moving trains, and regional operations are difficult due to differing railway gauges in each country.
There are only a few efficient railway operators in the region. Tanzania’s two operators, Tanzania Railways Limited (TRL) and Tazara, have been showing some signs of success in past years, but both operators are still lagging behind the Rift Valley Railways (RVR) consortium that operates between Kenya and Uganda. The railway concession, financed by various donors including the African Development Bank and the International Finance Corporation (IFC) (Evans 2011) carried around 1.5 million tons in 2012 in comparison to less than half a million for both TRL and Tazara.
Table 5.3 Comparison of Bus Travel and Flight Times
Route |
Bus time (approx.) |
Flight time |
Nairobi–Mombasa |
8 hours |
1 hour |
Nairobi–Kampala |
12 hours |
1 hour, 8 minutes |
Nairobi–Dar es Salaam |
13 hours |
1 hour, 25 minutes |
Nairobi–Kigali |
24 hours |
1 hour, 22 minutes |
Entebbe–Kigali |
9 hours |
50 minutes |
Nairobi–Kisumu |
5 hours, 30 minutes |
50 minutes |
Dar es Salaam–Arusha |
9 hours |
1 hour, 25 minutes |
Source: Flight schedules and bus websites.
On the Dar es Salaam to Zanzibar route—a main gateway for tourism, air transport also competes with maritime transport. The route has a modern ferry service running four times daily with economy class fares of US$35.
Despite the availability of alternative modes of transport on certain routes, air travel has a significant advantage over each of them, that is, speed. Table 5.3 shows the travel times by bus and by plane between major cities in EAC. This excludes any delays, such as customs hold ups or journey interruptions, which could potentially add to total transport time.
A bus journey from Dar es Salaam to Nairobi takes around 13 hours, and almost a whole day between Nairobi and Kigali (Scandinavia Express 2013). In Kenya, the bus from Nairobi to Mombasa takes around 8 hours, and until the Uganda–Kenya railway is modernized, the rail journey takes around 15 hours (Evans 2011).
As elaborated in chapter 4, the availability—but most importantly the quality, capacity, and cost of air transport infrastructure—plays a crucial role for the development of LCCs and air transportation in general. This section provides an analysis of airports in the EAC region, focusing in particular on availability, quality, and capacity of airside,3 landside,4 CNS (communications, navigation, and surveillance) infrastructure, and ground handling, as well as airport management and usage costs. In addition, factors relating to airport access will be reviewed.
With the exception of the World Economic Forum’s annual quality of air transport infrastructure report, there are few indexes that measure the overall quality of air transport infrastructure. As figure 5.22 shows, Kenya’s air transport infrastructure is ranked the highest among EAC states, followed with a significant margin by Rwanda and Uganda. Tanzania and Burundi appear to have the lowest ranking air transport infrastructure.
Figure 5.22 Air Transport Infrastructure Quality, 2012/13

Source: World Economic Forum Global Competitiveness Report 2012–2013, Switzerland (WEF 2013).
Note: 7 – high quality, 1 – low quality.
Although this gives an indication of the overall quality of air transport infrastructure, large differences prevail between individual airports, requiring a more detailed assessment.
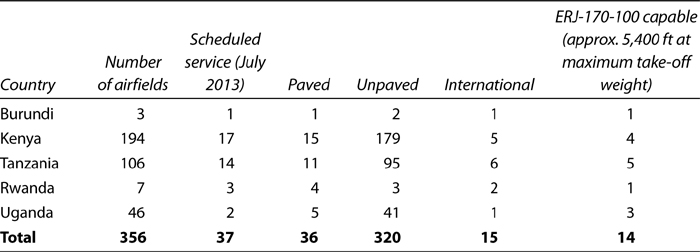
The EAC has a considerable number of airfields, particularly in Kenya and Tanzania. However, the majority of airfields have unpaved runways, and are, with few exceptions, unsuitable for commercial operations. For July 2012–13, only 10 percent of total airports actually received scheduled services and less than 40 percent are both paved and have the required runway length to accommodate regional jets, such as the fuel-efficient Embraer ERJ-170-100 (see table 5.4). In order not to impose major limitations, however, the sample chosen focuses on all airports which currently receive scheduled services, as well as other airports with paved and sufficiently long runways for operations of regional aircraft (based on ERJ-170-100). A list of all airports assessed and detailed information can be found in appendix G.
The majority of EAC airports receiving scheduled services, with the exception of some airports in Kenya (for example, Mara Serena Airport in Kenya), and Tanzania (for example, Bukoba Airport), have paved runways, taxiways, and aprons. Assessing their conditions remotely, however, is a difficult task. It is often based on a few high level indicators that can be evaluated from satellite imagery. This includes any patching that has been undertaken to cover previous pavement failures, which, when observed over a period of time, may be linked to ongoing condition issues. It is, however, in most cases impossible to identify any major signs of pavement failure, such as cracking, rutting or chip loss.
There are few reports available on runway conditions in the EAC. A report produced by the AICD program previously assessed the runway quality of major airports in Africa. It identified that the airports in the region receiving the highest volumes of traffic, for example Nairobi and Dar es Salaam, generally have higher quality runways of standard length for larger jet aircraft operations (AICD 2009).
CNS infrastructure in the EAC is still largely insufficient, but some progress has been achieved in recent years. The installation of ground-based navigation aids for en route and approach navigation is patchy, with only a bit more than half of the airports assessed having any installations. This often requires pilots to fly under visual flight rules (VFR), whereby pilots rely on the “see and avoid” rule and are dependent on clear weather conditions to ensure visibility. Most airports that have any ground-based navigation aids are equipped with simple nondirectional beacons (NDBs) or in some cases with additional, more sophisticated VHF omnidirectional range (VOR) systems. Few VOR installations are complemented with distance measuring equipment (DME), which aids aircraft pilots in determining the exact distance from the land-based navigation aids, further improving navigation precision. Installations for aircraft approach and landing such as instrument landing systems (ILS), precision approach path indicators (PAPI), and more sophisticated lighting systems are common only at major airports such as Nairobi, Dar es Salaam, or Entebbe.
Radar installations for surveillance and air traffic management (ATM) are rare due to high equipment and maintenance costs. Some airports such as Dar es Salaam and Nairobi have secondary radar installations, and Mombasa can use radar procedures if required (Gwilliam and others 2011). Uganda installed a new secondary radar for EUR7 million in 2006.5 The radar is also able to monitor parts of the airspace in neighboring Rwanda, the Democratic Republic of Congo, Kenya, and Tanzania—but does not provide any services to aircraft operating in those airspaces (Kazooba 2007).
Whether or not all of these installations are actually operational is unknown. This is related to the fact that the necessary information for pilots that would indicate the failure of any equipment, so-called NOTAMS (notices to airmen), are not being issued consistently or are not publicly available.
The lack of ground-based navigation aids and radar is still a critical weakness at this point in time. However, it is seemingly becoming a smaller issue due to the development of satellite-based navigation and surveillance systems. Although NDB and VOR remain common in developed countries, most modern aircraft rely now on global navigation satellite systems (GNSS). GNSS approaches are already being used at the major airports in Dar es Salaam and Nairobi. A pilot study to introduce GNSS procedures throughout the EAC has been undertaken with U.S. government funding in 2006. The EAC has formulated a plan to introduce GNSS procedures at three airports of each community member, which has yet to be implemented (EAC n.d.).
GNSS also provides the basis for modern surveillance technology, such as the automatic dependent surveillance-broadcast system (ADS-B). ADS-B is a more advanced and cost-effective substitute to today’s radar system, and is currently being implemented in the United States, Europe, Australia and a few other countries. It has also been considered in the EAC, with Tanzania recently announcing the implementation of ADS-B at its air traffic control (ATC) center in Dar es Salaam (Comsoft 2013).
Communications infrastructure (ground-to-air and ground-to-ground) has improved considerably, and all EAC countries have benefited from regional communications projects such as the SADC Very-Small Aperture Terminal (VSAT) Network, which covers Tanzania, Rwanda, and Burundi, as well as the North Eastern African Indian Ocean VSAT (NAFISAT) network covering Tanzania, Uganda, and Kenya (Air Traffic and Navigation Services 2013). VSAT is a technology used to define two-way satellite communications, to transmit and receive data from a relatively small satellite dish on earth, and communicate with an orbiting geostationary satellite.
The management of air traffic lies with a designated provider in the respective flight information region (FIR). The EAC region is divided into five FIRs (Nairobi FIR, Dar es Salaam FIR, Entebbe FIR, Kigali FIR, and Bujumbura FIR) each with a designated ATM provider. With the exception of the Bujumbura FIR that relies on Dar es Salaam to provide ATM for its upper air space, each of the respective ATM providers is responsible for upper and lower air space.6 Rwanda, whose upper air space was historically also managed by Tanzania, has recently announced that it will be taking over control of its upper air space (Muson 2009). Currently ATM services are provided by the specialized departments of the respective civil aviation authority (CAA) in each country. The respective CAA also provide approach and aerodrome control at major airports, as well as aerodrome flight information services (AFIS) on some secondary airports.
Multiple initiatives have been introduced to improve CNS capabilities in the region. COMESA has launched an integrated air space project with the financial support of the African Development Bank. The project’s objective is to develop (a) a legal and regulatory framework for a unified upper airspace in the COMESA Region; (b) an adequate institutional framework for providing and regulating regional air traffic services; and (c) public-private partnership arrangements to finance, build, and operate the regional communications, navigation, and surveillance systems for air traffic management (CNS/ATM) infrastructure (African Development Bank 2011a). Simultaneously, the EAC Secretariat has been working toward a regional upper flight information region (UFIR) governing the upper air space of all EAC members, thereby enhancing safety and efficiency and allowing for a seamless flow of traffic (CASSOA 2013). Trying to integrate all of these efforts within the region, the COMESA-EAC-SAD Tripartite has been developing a strategy for the seamless integration of all upper air space between the three RECs (OECD and WTO 2011).
There is often little public information available about the condition of landside infrastructure, especially passenger terminals, in EAC. Many airport facilities in the region have relatively old (for example, Entebbe or Dar es Salaam), limited, or in some cases no passenger facilities (for example, Lodwar Airport). Many of the smaller airports also do not have any or only part-time customs or immigration facilities required for international traffic. Whereas outdated and deteriorated infrastructure may be a significant issue at the country’s main gateways, smaller airports with little traffic do not, in most cases, require any lavish airside facilities as long as safety and security standards can be ensured.
As described in chapter 4, most large airports in developed countries use various metrics to determine the level of service (LOS). These include aspects such as waiting and processing times and available space. This often relies on data-intense and costly primary research, for example through surveys, which are unavailable for this case.
When unable to obtain the needed data to quantitatively assess the quality of landside infrastructure, customer reviews provide for an alternative qualitative, albeit less scientific view. Skytrax, for example, a commonly known source for airport rankings, covers some of the larger airports in the region such as Nairobi, Mombasa, Dar es Salaam, Entebbe, or Kigali. As the number and timing of reviews vary and are subject to personal opinions, caution is warranted. However, the ranking serves as an interesting indicator of passenger perception. Both Entebbe and Kigali rank high in their reviews (achieving 7.3 and 8 out of 10 points), whereas Bujumbura, Jomo Kenyatta, and Mombasa achieve low scores, particularly due to slow processing times and the general quality of facilities (Skytrax 2013).
A crucial factor in assessing the current quality of infrastructure and prospects for the development of air services is available capacity. As outlined in chapter 1, LCCs avoid highly congested airports because of the costs associated with delays and inflexible scheduling. In order to assess the current utilization of airports and potential for growth, it is necessary to look at both airside and landside capacity of a given airport.
Table 5.5 Potential Runway Capacity per Year (5 Minute and 10 Minute Lags) and Current Estimated Passenger Terminal Capacity
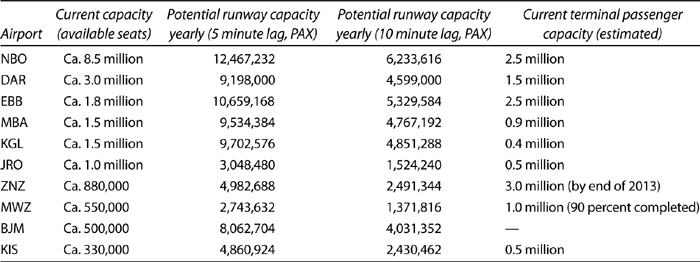
Sources: Calculation based on DiiO SRS Analyzer (2013), and AZ World Airports Passenger Capacity (2013b).
Note: BJM = Bujumbura, Burundi; DAR = Dar es Salaam, Tanzania; EBB = Entebbe, Uganda; JRO = Kilimanjaro, Tanzania; KIS = Kisumu, Kenya; KGL = Kigali, Rwanda; MBA = Mombasa, Kenya; MWZ = Mwanza, Tanzania; NBO = Nairobi; PAX = passengers; ZNZ = Zanzibar, Tanzania; — = not available.
Table 5.5 shows the current and potential estimated capacity of the region’s largest airports by movement (see appendix H for methodology on runway and terminal capacity estimations). Setting aside constraints posed by apron capacity, the estimates show that almost none of the airports in this sample have reached their potential runway capacity when assuming a five-minute time lag between each flight. When assuming a longer time lag of ten minutes between operations, the only airport that has already exceeded runway capacity is Jomo Kenyatta Airport in Nairobi. Thus, additional runway capacity appears not to be required for most airports. Instead, the focus should be on rehabilitation of current infrastructure, and on possible apron extensions, as well as on more effective scheduling and potential relocation of taxiways to enable a more efficient flow of traffic. It should be noted that these estimates are based on the current average capacity per operation, and runway extensions required for the operation of larger aircraft may be warranted if traffic increases dramatically.
Although the figures show that runway capacity does not pose a major challenge for airport operations, passenger terminal capacity appears to be greatly constraining air traffic. Most passenger terminals were not built to handle the increase in passengers, as experienced at some airports, particularly in Nairobi, Dar es Salaam, Kigali, and Zanzibar.
Recognizing the constraints of landside facilities, major investment projects have been initiated in the region. This includes the expansion of Jomo Kenyatta Airport, partially financed by the World Bank, which includes a new terminal and possibly a new runway, increasing the number of potential movements. The Kenyan government has also been upgrading smaller airports, such as the Mandan Airstrip in Lamu, which included the construction of a two-kilometer runway, a new terminal building, additional water supplies, and fencing, as well as a new fire station (Ventures 2013).
Tanzania is currently refurbishing and upgrading 10 regional airports under a US$67.5 million infrastructure project (Mbalamwezi 2011), and is investing US$170 million to build Terminal 3 for Julius Nyere Airport in Dar es Salaam. The existing international Terminal 2 will then be used for domestic flights (allAfrica 2013). Under the World Bank’s Tanzania Transport Sector Support Project, the country is also paving and rehabilitating the runway at Kigoma and Tabora Airports, and extending, rehabilitating, and paving the runway, apron, terminal, and car parking at Bukoba Airport.
In Rwanda, the government is finalizing talks with a Chinese firm to construct the Bugesera International Airport, which will serve as a complementary airport for Kigali, located 25 kilometers east of the capital (Ssuuna 2013). Kigali, having reached its maximum capacity according to authorities, is also currently being upgraded to cater to higher passenger volumes.
Finally, the government of Uganda has announced, in its 20-year civil aviation master plan in 2013, a US$400 million project to modernize Entebbe airport facilities as well as smaller domestic airports such as Kasese, Gulu, Arua, and Kotido (Muchira 2013). These are just a few examples of ongoing projects, which are increasing the capacity of the aviation system in EAC.
The provision of ground handling services varies significantly across EAC countries. Kenya has a competitive ground handling services industry with 15 different passenger and cargo ground handling providers, both local and international. Although companies provide varying offerings, competition appears to exist across almost all service categories (for example, ramp, passenger services, load control and support, and so on), with the notable exception of fueling services (Airline Update n.d.). This has significantly driven costs down, but could be unsustainable in the long term (World Bank 2005). Tanzania, after years of a ground handling monopoly with the firm Swissport Tanzania (previously Dahaco), has finally allowed competition to enter the market in 2009 (Tanzania Civil Aviation Authority 2013a), although a few licenses have been granted a quasi-monopoly and high charges have remained. Similarly in Rwanda, the government has finally allowed a second ground handling provider to enter the market, with Rwandair Express having been the only service provider for many years (Airline Update n.d.). In Uganda, ground handling is managed by two companies, with airlines complaining about the high cost of service and potentially uncompetitive practices between Uganda’s CAA and one of the ground handling providers ENHAS (Muhumuza 2012). In Burundi, there is currently only one ground handling provider, Asjetflow (Airline Update n.d.). However, considering the low volumes of traffic, more ground handling providers may be not feasible.
As seen in the case studies of South Africa and Mexico, high levels of airport charges can pose a considerable challenge for the development of LCCs. The analysis here assesses current infrastructure charges at EAC countries, and benchmarks these against similar airports in the region and globally (see appendix I for methodology including base case scenario and more detailed charges assessment).
The level of airport charges at EAC airports varies considerably in relation to destination and type of charge (passenger borne or airline borne). Figure 5.23 compares airport charges for a sample of airports in EAC for domestic operations. As the analysis shows, airport charges for domestic operations are particularly high in Rwanda, driven strongly by high passenger facility charges/service charges (PFC/PSC).
Figure 5.23 Total Turnaround Charges for Domestic Daytime Flight
US$

Sources: Analysis based on aeronautical information publications from Kenya, Rwanda, Tanzania, Uganda, Burundi, and airport websites.
Note: Domestically registered ATR72-500, maximum takeoff weight 23 tons, 74 passengers at 80 percent load factor, turnaround time two hours. The methodology and data sources used for the calculations of charges are described in more detail in appendix I. ATC = air traffic control; PFC = passenger facility charge; PSC = passenger service charge.
Figure 5.24 Total Turnaround Charges for Regional/International Daytime Flight
US$
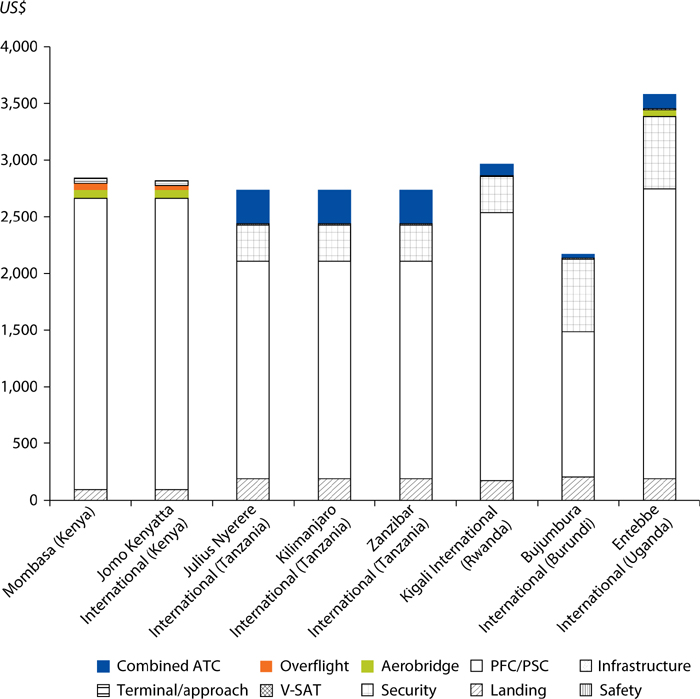
Sources: Analysis based on aeronautical information publications from Kenya, Rwanda, Tanzania, Uganda, Burundi, and airport websites.
Note: Internationally registered ERJ-170, maximum takeoff weight 37 tons, 80 passengers at 80 percent load factor, turnaround time two hours. ATC = air traffic control; PFC = passenger facility charge; PSC = passenger service charge; V-SAT = Very Small Aperture Terminal (satellite communications).
For regional or international operations, figure 5.24 shows that Entebbe has the highest turnaround cost of the sample, charging over US$3,500 per aircraft. Airport charges in Tanzania and Kenya appear to be at a similar level of around US$2,700, and slightly lower in Burundi at approximately US$2,100.
In order to weigh the cost for airlines versus passengers, all costs are aggregated for each category. Figure 5.25 shows that for domestic operations, charges are more equally distributed between passenger and airline charges in Kenya and Tanzania, whereas in Uganda the majority of charges are absorbed by the airline. In Rwanda, by contrast, the majority of costs are borne by passengers.
Figure 5.25 Total Turnaround Cost for Domestic Daytime Flight—Passengers versus Airlines
US$
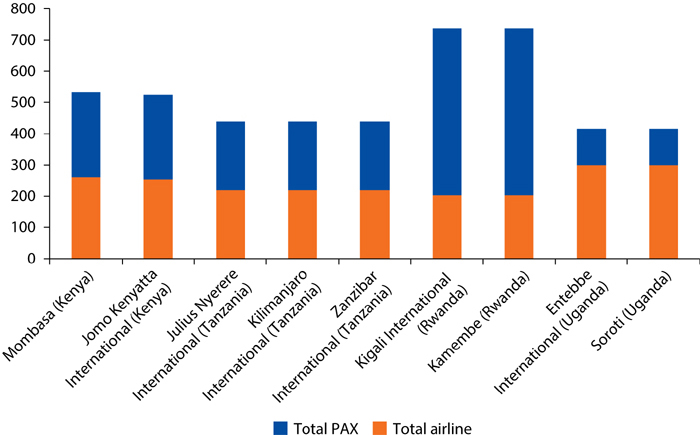
Sources: Analysis based on aeronautical information publications from Kenya, Rwanda, Tanzania, Uganda, Burundi, and airport websites.
Note: Domestically registered ATR72-500, maximum takeoff weight 23 tons, 74 passengers at 80 percent load factor, turnaround time two hours. PAX = passengers.
For international operations, passenger charges significantly outweigh charges paid by airlines (see figure 5.26). For LCCs this means that load factors have little impact on their overall charges level, and the profitability of airlines is less sensitive to load factors (IFC 2013). Total turnaround charges vary between approximately US$2,100 at Bujumbura International to approximately US$3,600 at Entebbe International.
Figure 5.26 Total Turnaround Cost for Regional/International Daytime Flight—Passengers versus Airlines
US$
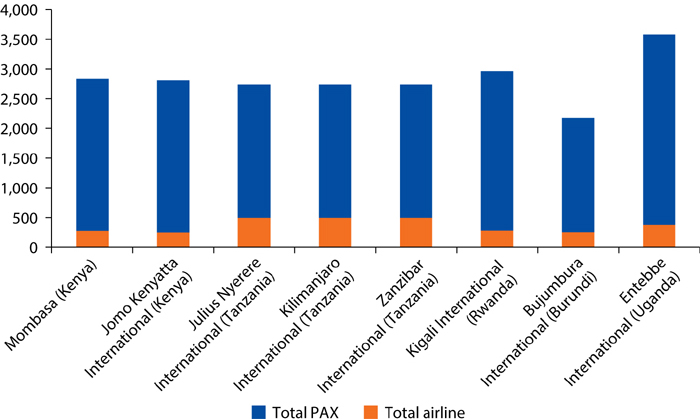
Sources: Analysis based on aeronautical information publications from Kenya, Rwanda, Tanzania, Uganda, Burundi, and airport websites.
Note: Internationally registered ERJ-170, maximum takeoff weight 37 tons, 80 passengers at 80 percent load factor, turnaround time two hours. PAX = passengers.
Although this analysis provides an indication of the level of charges in the intra-regional and domestic EAC markets, it gives little indication as to whether these charges are comparable to other airports or countries in the region or even globally. Comparing domestic and even regional charges on a more global scale is difficult because of the differing characteristics of each market, something that applies even to comparisons within the EAC region. It is also important to recognize that aeronautical charges are, in many cases, set as a form of cost-recovery or on a cost-plus basis. Airports with recent infrastructure investments, as for example in Senegal, are required to repay high debt services costs and therefore charge much higher aeronautical charges.
As figure 5.27 shows, charges that are levied on airlines are relatively lower in other domestic markets. As expected, smaller countries such as Ghana, Ethiopia, Bangladesh, and Nepal charge much lower overall fees, driven particularly by lower or nonexistent ATC charges. This cannot, however, be entirely credited to geographical size, as Uganda still charges high ATC fees.
Figure 5.27 Comparison of Airline Charges for Domestic Daytime Flight
US$

Sources: Analysis based on aeronautical information publications from Bangladesh, Burundi, Ethiopa, Ghana, Kenya, Nepal, Tanzania, Uganda, and airport websites.
Note: Domestically registered ATR72-500, maximum takeoff weight 23 tons, 74 passengers at 80 percent load factor, turnaround time two hours. ATC = air traffic control.
With regard to passenger charges, the distinction is less obvious, with passenger charges for Tribhuvan International Airport in Kathmandu, Nepal being similar to airports in Tanzania. Uganda, Bangladesh, and Ethiopia have the lowest overall passenger charges for domestic travel, between US$1.06 and US$1.95 respectively (see figure 5.28).
Figure 5.28 Comparison of Passenger Charges for Domestic Daytime Flight
US$
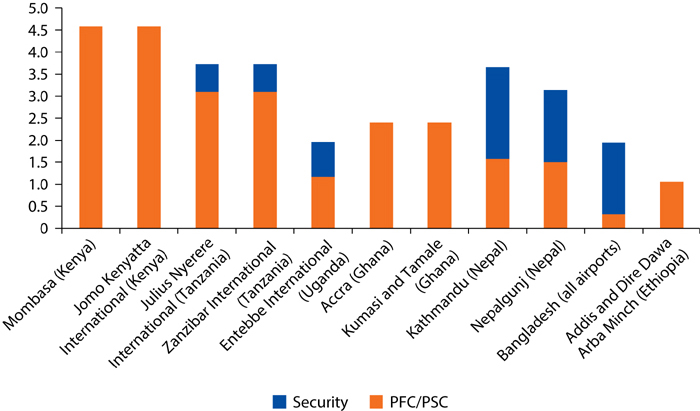
Sources: Analysis based on aeronautical information publications from Bangladesh, Burundi, Ethiopa, Ghana, Kenya, Nepal, Tanzania, Rwanda, Uganda, and airport websites.
Note: Domestically registered ATR72-500, maximum takeoff weight 23 tons, 74 passengers at 80 percent load factor, turnaround time two hours. PFC = passenger facility charge; PSC = passenger service charge.
When comparing charges between airports of similar size for regional/international traffic within a short-haul radius, airports in EAC actually charge much lower fees to airlines in comparison to some of their African counterparts, and even select Asian and Latin American airports. Only charges for Cusco in Ecuador are similar to Kenyan airport charges at around US$280. The highest fees for airlines are charged at Astana International Airport in Kazakhstan at US$1,021 (see figure 5.29).
Figure 5.29 Comparison of Airline Charges for Regional/International Daytime Flight
US$

Sources: Analysis based on aeronautical information publications from Bangladesh, Burundi, Cambodia, Colombia, Ethiopa, Ghana, Kazakhstan, Kenya, Morocco, Nepal, Nigeria, Peru, Rwanda, Senegal, Tanzania, Uganda, and airport websites.
Note: Internationally registered ERJ-170, maximum takeoff weight 37 tons, 80 passengers at 80 percent load factor, turnaround time two hours. See appendix I for methodology and sources. ATC = air traffic control; V-SAT = Very Small Aperture Terminal (satellite communications).
When looking at passenger charges, however, charges at other airports outside of Sub-Saharan Africa charge considerably lower rates (see figure 5.30). Cusco or Marrakech airport only charge a PSC of US$10 and US$7.50 respectively. In comparison to other airports in Africa, however, such as Dakar, Senegal, levies in EAC are still much lower. Dakar has introduced several additional charges, for example, an infrastructure and civil aviation charge, assumed to finance its new greenfield airport.
Figure 5.30 Comparison of Passenger Charges for Regional/International Daytime Flight
US$, departing
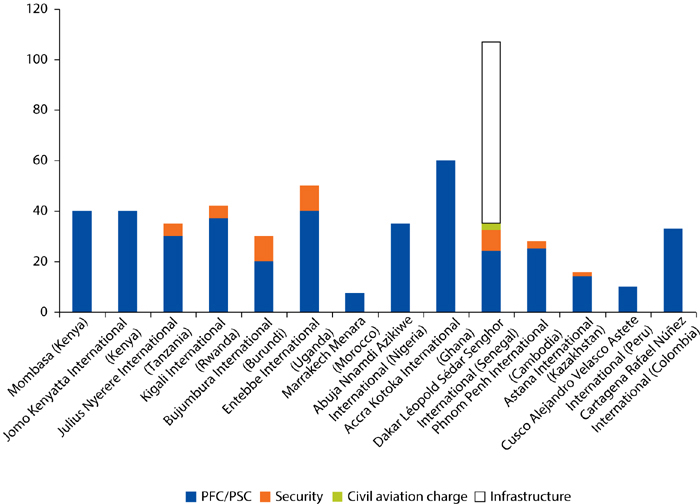
Sources: Analysis based on aeronautical information publications from Bangladesh, Burundi, Cambodia, Colombia, Ethiopa, Ghana, Kazakhstan, Kenya, Morocco, Nepal, Nigeria, Peru, Rwanda, Senegal, Tanzania, Uganda, and airport websites.
Note: Internationally registered ERJ-170, maximum takeoff weight 37 tons, 80 passengers at 80 percent load factor, turnaround time two hours. See appendix I for methodology and sources. PFC = passenger facility charge; PSC = passenger service charge.
Many of the airports in Africa are government-owned and operated. Table 5.6 shows the major airport operators in the region and highlights that this is also the case for most airports in EAC. There are a few exceptions though, with public-private partnerships (PPP) becoming more popular across the continent.7 Kilimanjaro Airport, for example, was operating under a concession arrangement with the Kilimanjaro Airport Development Company Ltd, a locally registered firm set up by the global airport operator Mott MacDonald (U.K.), Inter Consult of Tanzania, and the government of Tanzania. The government has since acquired the other participant’s stake in the consortium however (Momberger Airport Information 2012). The government of Uganda has also been in ongoing conversations for some time about a possible concession arrangement for Entebbe Airport. Changi Airport Group (CAG), the operator of Singapore Changi Airport, and the United Arab Emirates–based firm Dodsal Infrastructure Development, were seen as the main contenders. However, major resistance from trade unions has stalled progress (CAPA 2010). Seeing the opportunities arising for private sector participation, the Rwandese government announced in 2011 that it would seek expressions of interest for a private sector investor and/or operator for the new airport in Bugesera. Some airports have also allowed for the concession of specific airport services, such as Swissport’s passenger counter services in Dar es Salaam airport, as well as cargo handling by private contractors at smaller airport such as Mwanza (Gwilliam and others 2011).
Table 5.6 Major EAC Airport Operators
Operator |
Airports covered |
Government/private |
Kenya Airports Authority |
Ownership of major airports and service contract by government to maintain remaining airports |
Government |
Tanzania Airports Authority |
All airports excluding Kilimanjaro and Zanzibar |
Government |
Kilimanjaro Airport Development Company |
Kilimanjaro airport |
Privatized |
Zanzibar Airports Authority |
Unguja and Pemba Island Airports |
Government |
Autorité de l’Aviation Civile Burundi |
All |
Government |
Rwanda Civil Aviation Authority |
All |
Government |
Uganda Civil Aviation Authority |
All |
Government |
Sources: Kenya Airports Authority (2013); Tanzania Airports Authority (2013); Kilimanjaro Airport Development Company (2013); Autorité de l’Aviation Civile Burundi (2013); Rwanda Civil Aviation Authority (2013); and Uganda Civil Aviation Authority (2013).
Note: All airports not listed, such as many domestic airfields in Kenya for example, appear to be operated by the respective civil aviation authorities or responsible government entities.
The effect of state ownership on the performance of airports in developed countries has been researched extensively (for example, Vasigh and Haririan 2003; Vogel 2006; Mueller, Ulku, and Zivanovic 2009). There is, however, no consensus among researchers if and to what extent government ownership actually impacts an airport’s performance. Nonetheless, it has to be noted that in the EAC region, the management of airport operations by CAAs such as those in Rwanda and Uganda can pose a conflict of “self-regulation.” ICAO therefore clearly stipulates the separation of airport management and regulatory bodies. In addition, the presence of state-owned airports in conjunction with airlines that are partially or fully state-owned, such as Rwandair, Air Burundi, or even Kenya Airways, would not appear to be favorable for the development of a competitive aviation sector.
As mentioned in chapter 4, what is of primary concern for LCCs is inefficiencies that can increase time on the ground and consequently cost. However, this is very difficult to measure and the causes of delays are difficult to attribute to any particular party in the aviation system. In the United States, for example, detailed data are available on the timing of gate push-off, taxi time, and “wheels up” time, providing an indication of the cause and source of delay. This information is not available for any airports in the EAC.
Access to airports can pose a considerable challenge due to limited public transport, high levels of congestion, and high costs. This is particularly significant where airports are located far away from towns. Most larger airports in the EAC such as in Nairobi, Entebbe, and Dar es Salaam have cheap public buses, connecting the airports to the city center. However, smaller airports rely on private means of transportation or more expensive taxis. In Kenya, there is also the option of matatus, privately owned minibuses, which charge a fairly low fare.
As highlighted throughout this book, the basis for the development of LCCs has in most cases been linked directly to the deregulation of the domestic and international air transport markets, as well as to a transparent and competitive market without protected state-owned carriers. In the case of the EAC, the book examines the regulation of the region’s larger current and potential domestic markets in Kenya, Tanzania, and Uganda, as well as the regional implementation of the pan-African air transport liberalization framework, the Yamoussoukro Decision (YD). In addition, some liberalization frameworks within the different RECs in the region are highlighted.
Air transport liberalization on the African continent is delineated under the so-called YD, which entered into force in the year 2000, after having evolved from an earlier agreement, the Yamoussoukro Declaration of 1988.
The Yamoussoukro Declaration had established a new African air transport policy, which focused primarily on airline cooperation and integration. It committed all representative governments to make all necessary efforts to integrate their airlines within eight years (UNECA 1988). The eight-year period was subdivided into three phases: In the first phase (two years), the focus was to be on maximizing capacity usage between carriers. This was to be achieved by exchanging technical and capacity data, preparing for the designation of gateway airports, and promoting cooperation among national carriers in order to eventually merge them into larger and more competitive airlines. The second phase (three years) would have committed the airlines to joint operations on international routes. In addition, certain airline operations would have been conducted jointly to achieve better economies of scale and deeper integration by, for example, instituting a common insurance mechanism and computer reservation system, purchasing spare parts and aircraft, undertaking promotion and marketing, providing training, and maintaining equipment. The last phase (three years) was to be used to strive toward achieving the complete integration of airlines by establishing joint airline operations or entities (UNECA 1988).
Despite its already overly ambitious objectives and its low likelihood of implementation, the Yamoussoukro Declaration set in motion further initiatives aimed at liberalizing the African air transport market. In 1994, having evaluated the steps required to implement the Yamoussoukro Declaration, the African ministers in charge of civil aviation met in Mauritius and agreed on a set of measures to facilitate the granting of third, fourth, and fifth freedom rights to African carriers. Most remarkable was the understanding that fifth freedom rights should be granted on routes where third and fourth freedom flights did not yet exist (UNECA 2004).
Eleven years later, in 1999, African ministers responsible for civil aviation revisited the topic of the liberalization of air services. Based on the objectives of the Yamoussoukro Declaration and the resolutions discussed in Mauritius, the meeting aimed at accelerating implementation of the Yamoussoukro Declaration. This was partially a result of the recommendation of the 11th Conference of African Ministers Responsible for Transport and Communications held in Cairo in November 1997. It called for a regional meeting of African ministers to find ways to implement the Yamoussoukro Declaration (UNECA 2004). The conference in Yamoussoukro ended with the adoption of the “Yamoussoukro Decision Relating to the Implementation of the Yamoussoukro Declaration concerning the Liberalization of Access to Air Transport Markets in Africa,” which became known as the YD. The YD was then formally adopted during the Assembly of Heads of State held in Lomé, Togo, on July 10–12, 2000 (Schlumberger 2010). The YD came into force on August 12, 2000, 30 days after its signature by the chair of the Assembly of the African Economic Community (UNECA 2004). The main elements of the YD are summarized in table 5.7.
Table 5.7 Main Elements of Yamoussoukro Decision
Area |
Provision |
Yamoussoukro Decision |
Traffic rights |
Article 2 |
Free exercise of first, second, third, fourth, and fifth freedom rights on both scheduled and nonscheduled passenger and freight (cargo and mail) air services performed by an eligible airline. |
Tariffs |
Article 4 |
No approval is required by the aeronautical authorities of state parties for any tariff increase. An increase in tariffs only has to be filed with competent authorities 30 working days before they enter into effect; while a lowering of tariffs takes immediate effect. |
Capacity and frequency |
Article 5 |
No limit on the number of frequencies and capacity offered in air services linking any city pair combination between state parties concerned. No state party shall unilaterally limit the volume of traffic, the type of aircraft to be operated, or the number of flights per week unless there are environmental, safety, technical, or other special considerations. |
Designation and authorization |
Article 6 |
Each state party can designate at least one airline to operate intra-African air transport services on its behalf. States can designate any eligible airline from another State party to operate air services on its behalf, including an eligible African multinational airline in which it is a stakeholder. There is no limitation on the number of designated carriers as long as the eligibility criteria are met. Eligibility is based on compliance with minimum standards with regard to the carrier’s legal and physical establishment, its licensing and operating capacity, its insurance coverage, and its capacity to comply with international standards. |
Safety and security |
Article 6.12 |
Obligation for all parties to comply with the established civil aviation safety and security standards and practices of the International Civil Aviation Organization (ICAO). |
Source: Schlumberger 2010.
The YD is a relatively ambitious framework that aims to open air services between all African states. Indeed, it is a relatively progressive and radical move away from regulating air services between states on the basis of restrictive bilateral agreements. However, implementation of the decision has encountered two divergent realities. Implementation in terms of carrying out public policy has seen little progress at the pan-African level. Many of the key policy elements are still missing or exist only on paper. At the same time, in terms of operational implementation, many examples can be seen of countries opening up by applying the YD at the bilateral level. Given the current structure of the air transport sector in many African countries, one can assume that about two-thirds are willing to apply the YD because they see little value in protecting their own markets from outside competition (Schlumberger 2010).
As highlighted, the EAC Treaty of 1999 outlines the modalities of cooperation in infrastructure and services by partner states with particular focus on civil aviation and civil air transport (Article 92). The Treaty provides a list of concrete steps to reach these goals (EAC 1999) including (a) the adoption of common policies to develop civil air transport in collaboration with other relevant organizations; (b) liberalizing the granting of air traffic rights for passenger and cargo operations; (c) harmonizing civil aviation rules and regulations; (d) establishing an upper area control system, that is, a system of ATC for the upper flight levels; (e) coordinating the flight schedules of designated carriers; (f) applying ICAO guidelines to determine user charges for scheduled air services; and (g) adopting common aircraft standards and technical standards.
Some of these steps match elements of the YD, which was signed the same year as the treaty of the EAC. The latter is, however, limited to liberalizing the granting of air traffic rights for passengers and cargo operations and does not specify further the extent of liberalization. Even though the EAC Treaty did not incorporate all of the principles of the YD, the EAC’s Sectoral Council on Transport, Communications, and Meteorology worked continuously on several key measures of the YD. The most important was the formulation of a liberalized air transport policy for scheduled air services. Whereas other RECs developed specific regulations that liberalized air services within their REC (for example, the West African Economic and Monetary Union), the EAC chose to focus on amending the bilateral agreements between the partner states. The 11th Meeting of the EAC Council of Ministers formally approved several projects pertinent to air transport and issued the necessary directives, namely (East African Community Secretariat 2006):
• The amendments to the bilateral agreements between the EAC states toward full implementation of the YD on air transport liberalization are approved and must be incorporated into the respective bilateral agreements.
• The amendments include full liberalization of air services between any points within the territory of the EAC. Following the principles of the YD, no restriction shall be posted on the frequency, capacity, or types of aircraft operated by designated EAC carriers.
• The EAC Secretariat is to inform the Economic Commission for Africa, with copies to COMESA and SADC, that the EAC is fully compliant with the YD. The latter two organizations are urged to “expedite the move towards continental implementation of the Yamoussoukro Decision.”
• The EAC Air Transport Subcommittee for implementation of the YD will be staffed by an official responsible for administering the bilateral agreements, and with officials from the civil aviation authorities, airport authorities, and the attorneys’ general chambers of each partner state.
• The heads of civil aviation and airport authorities of each partner state are authorized and instructed to renegotiate the funding for civil aviation safety and airport projects with their respective ministers of finance and to seek other resources for such projects.
Thus, the EAC has displayed great interest in and motivation toward liberalizing and developing air services within its territory. As a relatively small REC, the EAC relies mainly on mutual consent with respect to major decisions and program implementation. The notion of cooperation among partner states has a long history in the region and must be regarded as the best way forward. The approach of agreeing to bilateral accords that conform to the principles of the YD is therefore the most appropriate manner of implementation.
However, the key element of the EAC’s approach toward implementing the YD, that is, amending the bilateral agreements between EAC states, is still pending. The most recent update from the EAC Secretariat that could be obtained with regard to the implementation of the YD in EAC (from January 2013) announced that the development of the framework for the implementation was progressing well and a draft was to be considered by the end of May 2013. However, no information could be found to verify its implementation (Ssenyonga 2013).
Currently, the existing bilateral regime between EAC states is more restrictive than that established by the YD framework. Air service agreements (ASAs) that could be found for Tanzania (see table 5.8) show that in its current bilateral ASA with Kenya, for example, there are generally no limitations on capacity or types of aircraft. However, limits on frequencies, and in the case of Kenya, the destinations to be served in both countries, are delineated. In addition, there are no provisions for fifth freedom traffic (Munyagi 2006).
The World Trade Organization’s air service agreement projector (ASAP) tool only has information on three ASAs in the region, that is, between Rwanda and Tanzania, Tanzania and Burundi, and Kenya and Uganda. From the information available, the ASA between Rwanda and Tanzania appears to be the most liberal, achieving comparatively high scores in all four areas (“standard,” fifth freedom, designation, and ownership). This is followed by the agreement between Tanzania and Burundi (Category E). The ASA between Uganda and Kenya appears to have the lowest score (Category C), with single designation and capacity constraints (WTO 2013).
Table 5.8 Bilateral Air Service Agreements between Tanzania and EAC Countries

Source: Tanzania Civil Aviation Authority 2013b.
Note: EAC = East African Community; MoU = memorandum of understanding.
COMESA, which includes all EAC member states with the exception of Tanzania, has also been working toward the liberalization of air transport. The REC even decided to go beyond the principles of the YD by allowing COMESA carriers to operate between any destinations within COMESA countries (Schlumberger 2010). The implementation of this had been hinging on the establishment of a competition authority, which was initiated in 2008 jointly with both EAC and SADC under the COMESA-EAC-SADC Tripartite. However, the consolidation of efforts with other RECs has slowed implementation significantly.
The Tripartite, as part of its efforts to integrate air transport policies between the three RECs, has also been working toward the harmonization of all liberalization efforts across the region. Considering the varying scope of liberalization efforts, this may delay implementation. This is further illustrated in table 5.9 outlining the individual efforts to date by each REC, and grading it in accordance with its application to the YD (Schlumberger 2009). Among the RECs, the Bangul Accord Group (BAG), the Economic and Monetary Community of Central African States (CEMAC), and the Economic Community of West African States (WAEMU) seem to have advanced the most significantly. Full implementation of the YD is a crucial step in the development of air services in the region.
Although it is of paramount importance that restrictions on capacity, frequency, and designation be removed, the additional benefit of applying more extended traffic rights, in particular fifth freedoms, is questionable in the current market. There could potentially be significant advantages to the air transport market in EAC in the future, but the impact in the current competitive context would appear to be minimal as traffic is still very limited.
Table 5.9 Implementation of Yamoussoukro Decision (YD) in African RECs
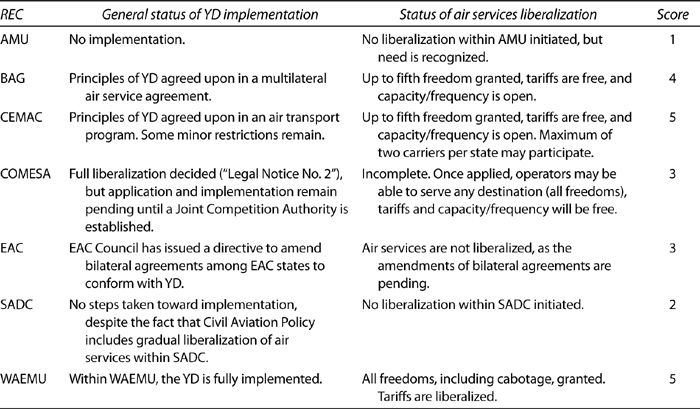
Source: Schlumberger 2009.
Note: AMU = African Monetary Union; BAG = Bangul Accord Group; CEMAC = Economic and Monetary Community of Central African States; COMESA = Common Market for Eastern and Southern Africa; EAC = East African Community; REC = regional economic community; SADC = Southern African Development Community; WAEMU = West African Monetary Union; YD = Yamoussoukro Decision.
Liberalization in domestic markets has occurred to varying degrees, with Tanzania being probably the most advanced in the region. The country’s domestic liberalization has allowed competition in its market to flourish, and has supported the establishment of a strong private operator in addition to the state-owned carrier, Air Tanzania. In Kenya, the reform of its air transport policies in the 1990s allowed for some competition, although implementation has since been slow. Only recently has progress been seen with the entrance of its first LCC, Fly540. This has been driving down fares in the domestic market. The most important milestone has been the privatization of Kenya Airways, which removed government control from day-to-day operations. As noted, however, a recent announcement by the government of an increasing stake brings into question whether government intervention has really been eliminated.
Air transport safety records are still poor in Africa. Despite only representing around 5 percent of global scheduled seat capacity, 43 percent of all fatalities from air transport occurred in the region in 2012 (ICAO 2013a). Only 25 airlines in the region are certified through IATA’s Operational Safety Audit (IOSA), and many are listed on Europe’s airline blacklist (European Commission 2013).
Unfortunately, the EAC is no exception. In the last decade, the region has experienced 41 accidents, of which 13 resulted in fatalities. An analysis of accidents in the region in figure 5.31 (see appendix J for full details of each accident) shows that the majority of accidents or incidents have occurred due to two reasons: (a) human error, such as loss of control, deviation from original flight plans, aircraft overloading, or unlicensed personnel; and (b) aircraft failure, such as engine fires or issues with undercarriage. Some accidents, particularly in the mountainous areas of Kenya, were also linked to the lack of appropriate navigational aids in place. Although these causes are not only present in the developing world, the frequency of accidents, considering the limited traffic, is very high, and points to a systemic deficiency in the air transport system.
Figure 5.31 Assumed Primary Cause of Accidents in EAC, 2003–13
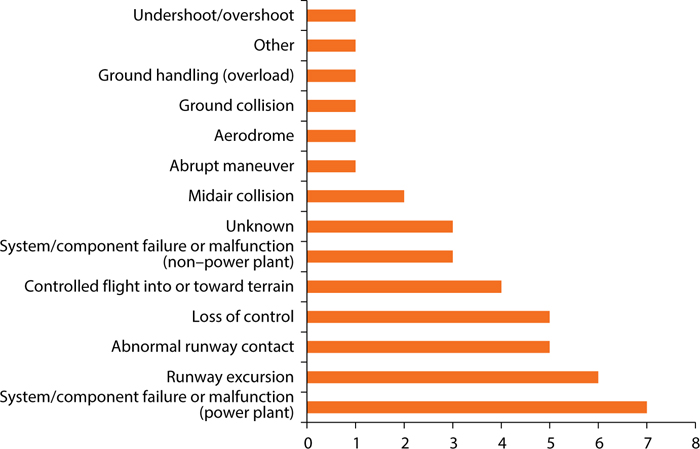
Source: Analysis based on the Flight Foundation’s Aviation Safety Network (2013).
Note: EAC = East African Community.
According to the IATA, the main determining factors for accidents in Africa are related to the lack of three things: (a) effective regulatory oversight; (b) data collection to perform flight data analysis (FDA); and (c) safety management systems (SMS) implementation (Matschnigg 2013).
Poor oversight has been particularly critical, with Africa performing significantly worse than other regions. Although the Universal Safety Oversight Audit Programme (USOAP) results for each critical element (CE) are not publicly available, the level of implementation for each audit area, based on the country’s latest safety audit, is published. In the case of the EAC, the audit results show that implementation in EAC varies between countries and across key areas. Kenya, for example, performs above the global average in most areas, whereas Tanzania displays unsatisfactory implementation in legislation, flight operations, and air navigation services. Similarly, Rwanda’s level of implementation for many areas is above the global average, but nonexistent in the areas of accident investigation and air navigation services (see figure 5.32).
As promulgated in the EAC’s treaty, the region has, with the support of the U.S. Department of Transportation’s Safe Skies for Africa initiative, created a regional safety oversight organization (RSOO) in 2007. The Civil Aviation Safety and Security Oversight Agency (CASSOA), has the mandate to (a) promote the safe, secure, and efficient use and development of civil aviation within and outside the partner states; (b) assist the partner states in meeting their safety and security oversight obligations and responsibilities under the Chicago Convention, including its appendixes; and (c) provide the partner states with an appropriate forum and structure to discuss, plan, and implement common measures required for achieving the safe and orderly development of international civil aviation through the implementation of international standards and recommended practices relating to the safety and security of civil aviation (CASSOA 2013).
One of CASSOA’s major achievements has been the harmonization of regulations and the development of guidance materials between Tanzania, Kenya, and Uganda. The harmonization of regulations of the newer members Rwanda and Burundi is, however, still ongoing. As voiced by CASSOA’s board chairman at the 2nd East African Community Civil Aviation Safety and Security Oversight Agency (EAC-CASSOA) conference, inadequate funding mechanisms as well as attracting and retaining qualified staff has proved to be a considerable challenge (News of Rwanda 2013). There is an attempt to address funding issues through the introduction of an additional passenger surcharge in the amount of US$0.70. This would, however, put more pressure on airlines (Ihucha 2012).
Figure 5.32 Level of Implementation in Key Audit Areas

Source: ICAO Safety Audit Information (2013b).
Note: Information is in accordance with the last scheduled audit for the region in November 2008. For Rwanda and Kenya, a follow-up audit was conducted in 2012 and 2013, respectively.
ICAO has also set up multiple cooperative programs called Cooperative Development of Operational Safety and Continuing Airworthiness Programs (COSCAP) in the region, including one in the SADC REC. COSCAP is an agreement between participant states, which aims at enhancing the safety of air transport operations in a subregion by providing technical services in safety oversight to its member states.
Aviation security is also increasingly becoming a challenge in the region. Industry stakeholders have shown concern due to the increasing levels of drug and human trafficking, as well as terrorism and proliferation of small arms. Kenya has become a particular target with recent terrorist attacks and instability and prevalent militant groups in neighboring Somalia. Various proposals have been made to address the security challenges in the EAC, including the establishment of an antiterrorism task force at the EAC Secretariat, joint training for aviation security personnel, an intervention force, as well as the implementation of corrective action plans resulting from security audit programs such as the ICAO’s Universal Security Audit Programme (USAP) (News of Rwanda 2013).
The availability of qualified aviation staff is still a major challenge across the African region. Indeed, deficiencies are apparent across the whole aviation sector, including pilots and flight attendants, but also maintenance engineers and technicians and regulatory staff.
Kenya’s flag carrier Kenya Airways is facing a shortage of experienced pilots to support its expansion plan. The carrier has been struggling with unions to allow for the hiring of 40 expatriates to fill the void. Kenya is said to need 2,000 more pilots to meet its current requirement of 5,000 pilots (News of Rwanda 2013). Likewise, the director general of the Tanzanian CAA highlighted in an interview in 2012 that local pilots and engineers represent only 40 percent of the total requirement, with 60 percent of staff coming from outside the country. In addition, the Tanzanian CAA has been facing a shortage of adequate inspectors to conduct the necessary audits (Tanzania Daily News 2012). Similarly, in 2007, ICAO’s USOAP for Rwanda identified a lack of qualified aviation personnel as a major deficiency in many areas (In2EastAfrica 2011).
The reasons for these deficiencies vary. Primarily, they are both inadequate and underfunded training centers and civil aviation authorities, and “brain drain.”8 In addition, there appears to be a gap between academia and the airline industry, with limited on-the-job training and practical experience offered to students. In the EAC, regional training schools, such as the East African School of Aviation located in Kenya, and the East African Civil Aviation Academy (EACAA) at Soroti Airport in Uganda, have been able to promote the development of aviation professionals in the region. They have been struggling to achieve the necessary economies of scale, however, which has resulted in high costs. In 2011, the estimated cost for training an air traffic controller was K Sh 3.5 million (Ndegwa 2012).
In spite of the Kenyan CAA spending US$15 million over the last 10 years to improve training and capacity at the East African School of Aviation, the sector is fighting an endless battle against brain drain (Kagwe 2011b). Middle Eastern carriers in particular have been attracting newly-graduated aviation staff from the region’s training centers, offering significantly higher salaries and better opportunities.
Although salaries offered outside of the African market are considerably higher, wages for aviation personnel, particularly airline crews are by no means low in the EAC. The shortage of adequate human resources and the high cost of training have translated into a doubling of salaries for pilots between 2008 and 2011 (Maina 2011).
Various international efforts have been made to address these challenges. Examples include the Initiative on Human Resources Development by the African Civil Aviation Commission (AFCAC), the African Union’s specialized agency for civil aviation matters; and ICAO’s Next Generation of Aviation Professionals (NGAP) Initiative offering courses and seminars aimed at the development of human resources in the region.
In addition to the shortage and high cost of qualified human resources, airlines and businesses in developing countries often face considerable challenges with regard to labor regulations and laws. However, overall labor regulation in Sub-Saharan Africa is seen as less of an impediment when compared with aggregated survey results for Latin America and the Caribbean, and the Middle East and North Africa regions (see figure 5.33). In the EAC region, Tanzania and Kenya appear to be facing higher regulatory constraints than their neighbors. This is surprising in light of the historically anchored labor laws in the region. Kenya, Uganda, and Tanzania’s labor laws are all anchored in British Common Law, which is sometimes seen as more favorable for investors than other legal systems (Astier 2012). Rwanda on the other hand was long governed under the Belgian Civil Law System and is only now gradually moving toward a Common Law system (Uwanyiligira 2012).
Figure 5.33 Percentage of Firms Identifying Labor Regulations as a Major Constraint—Comparison of EAC and Other Regions
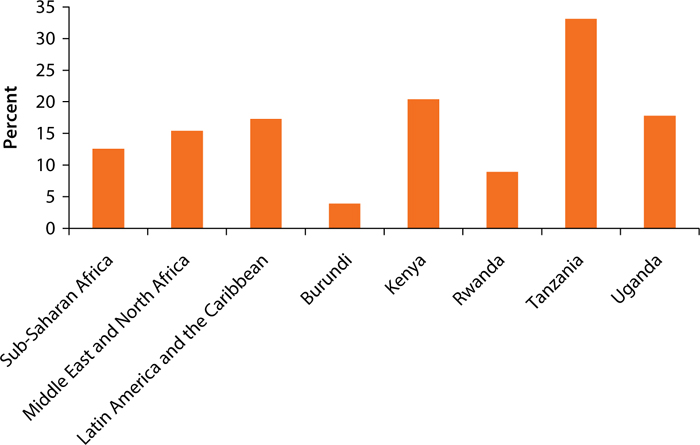
Source: World Bank and IFC Enterprise Surveys (2013).
Note: Year of data capture—Burundi (2006), Kenya (2013), Rwanda (2011), Tanzania (2013), and Uganda (2013). Regional averages vary depending on different years of data capture of each country in the region. EAC = East African Community.
A closer analysis of the EAC labor markets indicates some further challenges related to specific labor regulations in the region. The results from the World Bank’s Doing Business report for the EAC countries (World Bank 2013a) (see details appendix K) highlight a few potentially restrictive labor regulations that could affect an airline:
• In Tanzania, fixed-term contracts are prohibited for permanent tasks, reducing the flexibility of employees and airlines hiring for seasonal flight destinations, for example additional flights during holiday seasons.
• In Burundi, the additional percentage for night work is 35 percent, which would apply for airlines operating at airports that are sometimes open 24 hours per day.
• In Tanzania, Kenya, and Burundi, notification of a third party is required for the dismissal of a person; in Tanzania, this dismissal even needs to be approved by the third party.
• Contributions to social security are very high in Tanzania (20 percent of salary) (PwC 2013). In addition, in Tanzania a “skills and development” Levy of 6 percent of the wage bill is charged, of which only a third goes to the Vocational Education Training Authority (VETA), while the remaining two-thirds is remitted to the treasury (Association of Tanzania Employers 2011).
The presence of unions, sometimes representing a significant challenge for businesses, is relatively low in the region. The latest figure by the International Labour Organization (ILO) estimates the density of trade unions for Kenya at 4.1 percent, Uganda at 1.1 percent, and Tanzania at 2.2 percent (Hayter and Stoevska 2011). No data could be obtained for labor activities by unions.
Aircraft financing has proved to be a considerable impediment to the development of air services in Africa. This is primarily related to the high cost of capital for aircraft finance and to the fact that African airlines, with few exceptions, are unable to reach the economies of scale needed for lower aircraft prices and superior purchasing conditions. Historically African carriers have been reliant on export credit agencies, and operating leases for older aircraft from airlines from developed countries. However, these sources of finance are becoming continuously scarce or more expensive (see chapter 4). This problem is further aggravated by the high rate of accidents, poor safety and security oversight, lack of adequate maintenance facilities, and challenges in the legal protection of borrowers and lenders alike across the continent.
Although deficiencies in other areas such as safety and security still persist, most countries in the region have made progress toward the legal protection of borrowers and lenders. In the 2013 Doing Business report for the EAC (World Bank 2013a), Kenya displays the highest score for protection of lenders and borrowers, followed by Uganda, Tanzania, and Rwanda. Burundi has the lowest score (3 out of 10). Kenya and Tanzania have both ratified the Cape Town Convention, and Rwanda has acceded to the convention. Adherence to the convention is greatly facilitating the countries’ access to aircraft finance.
Development institutions, such as the African Development Bank and the IFC, as well as other private and public institutions, have also played a crucial role in providing financing for airlines in the region. AfriExim, a public-private consortium with the purpose of financing, promoting, and expanding intra-African and extra-African trade, has also been involved in the region providing a US$1.9 billion financing package for Kenya Airways, fleet expansion (Gichane 2012). The IFC has invested US$25 million in equity in the airline (Mutegi 2012; Ngigi 2012) and is currently also reviewing a potential investment in Precision Air. In 2011, the African Development Bank also provided a US$40 million second lien corporate loan to Ethiopian Airlines to support the purchase of five Boeing 777-200LR passenger aircraft (African Development Bank 2011b).
In addition, various initiatives across the continent have been put forward to alleviate the burden of high aircraft financing costs. One of them is the Commercial Aircraft Finance Entity (CAFE), which aims to provide access to infrastructure and related finance on a public-private-initiative basis for aircraft leasing and financing (Tierny 2012).
Access to fuel and the cost of fuel are intrinsically linked to the survival of an airline, especially for LCCs. Jet fuel prices in Africa are considered a major hurdle for the development of air transport. Prices are influenced by high taxation, regulations, and the lack of adequate storage facilities, as well as the often-monopolistic market structure of the oil industry in the region. In addition, many African countries are faced with the geographic challenge of being landlocked, resulting in delays and inflated prices for jet fuel due to higher transport costs in the region.
Publicly available data on jet fuel prices at the airport level is very difficult to obtain. For EAC countries, the book’s authors were only able to obtain information for Kenya. Kenyan airports charge US$1.1 per liter (approximately US$130.9 per barrel), which is around US$6 higher than the average global jet fuel price in 2013 (IATA n.d.). No direct information could be found for jet fuel prices at Tanzanian airports. However, in an interview in 2012, the CEO of Precision Air, Alfonse Kioko, stated that “aircraft operators in Tanzania are badly hurt by rising jet fuel, which almost doubled in the past year, forcing some aircraft to fly to neighboring Kenya for refueling at prices 30 percent lower than Tanzania,” (Tairo 2012) hinting that the situation in Tanzania is not more favorable.
Airline websites, where charges and taxes are individually listed, can be a good indicator of fuel prices. A look at Precision Air’s website shows that for a one-way ticket between Dar es Salaam and Nairobi, a US$50 fuel service fee is applied. On a flight from Dar es Salaam to Entebbe, the surcharge is US$55 for a one-way ticket. For domestic flights, there is a fuel service surcharge of US$40.
There are a variety of reasons for the higher cost of fuel, including government taxation and custom tariffs. As indicated in chapter 4, ICAO’s policies on aviation fuel clearly state that aviation fuel is to be exempt from customs duties and excise taxes or any other form of taxation (ICAO 2009). This not only excludes domestic aviation (which faces a value-added tax [VAT] in some countries), but is also far from being implemented in most African countries. EAC countries have, however, been complying, to varying extents, with these regulations, with no excise or other taxes being applied to jet fuel, at least for international transport.
Uganda has made a special provision for fuel imported by registered airlines and companies with designated storage facilities or contracts with airlines, and Tanzania has abolished all excise duties for jet fuel (PwC 2013). Some countries, such as Rwanda and Kenya, however, still apply VAT and other taxes for domestic usage of jet fuel. According to PricewaterhouseCoopers, Kenya charges a US$0.06 excise duty for kerosene-type, and US$0.22 duty for spirit-type jet fuel per liter—in addition to a US$0.004 petroleum development levy per liter. The new VAT Act in Kenya, which was approved in 2013, also limits the exemption of jet fuel from VAT to three years under a “transitional period” (Kenya Revenue Authority 2013).
Under the EAC Common External Tariff (CET) regulations, to be applied by all countries, customs duties on jet fuel (both kerosene- and spirit-based) are to be removed. The application of the CET has not been uniform, with exceptions being applied on a country basis. Uganda, Rwanda, and Burundi have all produced a list of goods to be exempted from the CET. In some cases, resistance is high, as income from taxation represents a large part of a country’s revenue. Rwanda, for example, lost revenues of US$9.8 million when it abolished customs duties on petroleum products (Rwanda Revenue Authority n.d.). In addition, Tanzania, as part of SADC, has committed to the implementation of both CETs, which poses a considerable challenge. Similar issues have arisen in the other EAC members, which are also a part of COMESA (Makame 2012).
Regional production facilities are also few and comparably small in scope, limiting local supply. Of the EAC countries, the only country that currently appears to have a refinery producing jet fuel is the Kenya Petroleum Refineries near the port of Mombasa. The Mombasa refinery is one of the largest petroleum refineries in the region with a capacity of 90,000 barrels/day (bbl/d) and a throughput of almost 35,000 bbl/d as of 2011. It processes heavy crude, imported solely from the United Arab Emirates. In order to meet local demand, the country also imported around 56,000 bbl/d of refined oil products, primarily from Asia and the Middle East. Together with kerosene, this represents about 22 percent of its total fuel production (see figure 5.34) (U.S. EIA 2011).
Figure 5.34 Mombasa Refinery Output per Type of Product
percent

Source: United States Energy Information Agency (2011) based on data from Kenya Petroleum Refineries (U.S. EIA 2011).
The Kenya Pipeline Company (KPC), responsible for transporting the fuel from the refineries, has two aviation fuel depots at Jomo Kenyatta and Mombasa’s Moi International Airports, and an additional two smaller depots at Eldoret and Kisumu (KPC 2013). Jet fuel throughput was around 970,000 cubic meters in 2011 (KPC 2012). In order to meet growing demand KPC has been seeking financing of US$1 billion to boost its capacity (New Times 2013).
Jet fuel produced in Kenya is transported via the company’s pipeline network from Mombasa to Nairobi and farther to Nakuru, Kisumu, and Eldoret. From there it is trucked to neighboring Rwanda, Uganda, and Burundi. The comparatively poor road conditions and the resulting high transport costs between Eldoret and Uganda, and Rwanda and Burundi, are assumed to have a considerable impact on the retail cost. The dependence on Kenya has also made the countries vulnerable to any political and economic shocks, as occurred during the 2008 political instabilities in Kenya. Uganda is lobbying for a new pipeline to extend from Eldoret to Entebbe, but is also considering its own facilities. In 2010, the country discovered commercially viable oil deposits estimated at around 3.5 billion barrels. A local refinery with jet fuel production is to commence operations soon (Sskika 2013). This can be considered a positive development for airlines serving Entebbe airport, as dependency on jet fuel imports and inadequate inventory planning have created some challenges, with various incidents of fuel shortages at the airport (eTurboNews 2011). Carriers were required to divert to other airports or reduce passenger loads to carry additional fuel. Similar scarcity has also occurred at Malindi Airport in Kenya, forcing aircraft to divert to Mombasa and leaving tourists stranded (Daily Nation 2010).
The lack of adequate facilities at some airports still poses a challenge for regional operations. Many of the smaller airports in the region do not have any refueling facilities; for example Tanzania’s Iringa and Mbeya Airports, which both have scheduled services. In Kenya, over half of the airports in the chosen sample do not have any facilities for refueling. In Rwanda and Uganda, the respective airports in Entebbe and Kigali are the only ones with refueling facilities (Jeppesen 2013). The lack of fueling facilities has a considerable impact on airlines, as aircraft have to take on additional fuel rather than passengers, thereby increasing costs substantially.
Competition between fuel suppliers is still limited at the region’s airports, creating quasi-monopolies in the market. Airlines have been trying to accommodate the higher fuel costs by adjusting their maintenance routines, or by hedging part of their fuel purchases, as seen at Kenya Airways. The region’s larger airlines including Kenya Airways, Precision Air, and Rwandair have also joined forces with six other African airlines to jointly purchase jet fuel, thereby increasing their purchasing power (Okulo 2012).
In order for LCCs to establish low-cost distribution channels, a solid information and communications technology (ICT) infrastructure and corresponding payment methods are required. With the exception of Burundi, Internet usage has been growing considerably in EAC countries, particularly in Tanzania, Uganda, and Kenya (see figure 5.35). Kenya has been at the forefront of Internet penetration with 28 per 100 people using the Internet as of 2011. The country has invested significantly in ICT infrastructure, particularly in fiber-optic cables in 2010, resulting in a doubling of Internet users within one year (Ombok 2011). Uganda also experienced an over 80 percent average increase in Internet users between 2006 and 2011.
Figure 5.35 EAC Internet Usage, 2006–11

Source: World Bank 2013b.
Note: EAC = East African Community.
Although the number of Internet users has been growing, it is still far below that of developed countries such as the United States or the United Kingdom—and even behind other developing countries such as Thailand and Mexico (see figure 5.36). This is primarily caused by poor infrastructure, the high cost of services, a lack of access to electricity, and unreliable power grids. In addition, computer literacy is still low in most African countries.
Figure 5.36 Comparison of Internet Users with the United States, United Kingdom, Thailand, and Mexico, 2006–11
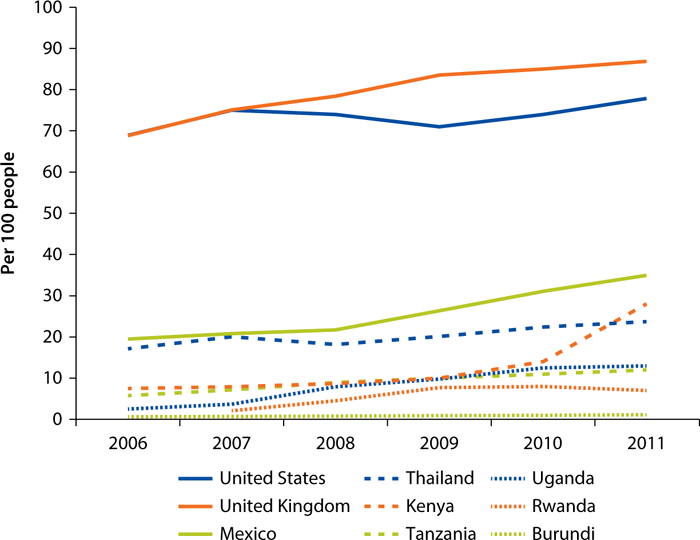
Source: World Bank 2013b.
EAC countries also have similar issues with respect to Internet access and usage. According to the International Telecommunications Union (ITU), only 3.6 percent of households had a computer in Kenya in 2009. In Rwanda, it was only 2 percent in 2011 (ITU 2013a). In Tanzania, only 14 percent of the population had access to electricity in 2010, as compared with 8 percent in Uganda and 18 percent in Kenya. This is further aggravated by limited power availability, with frequent blackouts in larger cities (for example, in Dar es Salaam).
Even where Internet access is available, the speed of fixed broadband is still very slow. By early 2012, the entirety of Kenya’s fixed broadband ran at less than two megabits per second (Mbit/s). In comparison, the most prevalent speed in developed countries is between two and ten Mbit/sec, and in most European countries it is above ten Mbit/sec (ITU 2013b). The low speed further discourages usage, and makes online LCC booking processes particularly difficult.
Nevertheless, opportunities arise from the rapidly increasing use of mobile technology in the region. As the cost of mobile devices and usage prices decline, and coverage increases, mobile cellular subscriptions have seen a substantial rise of up to 100 percent in some markets (figure 5.37).
Figure 5.37 Mobile Cellular Subscriptions in EAC, 2008–11
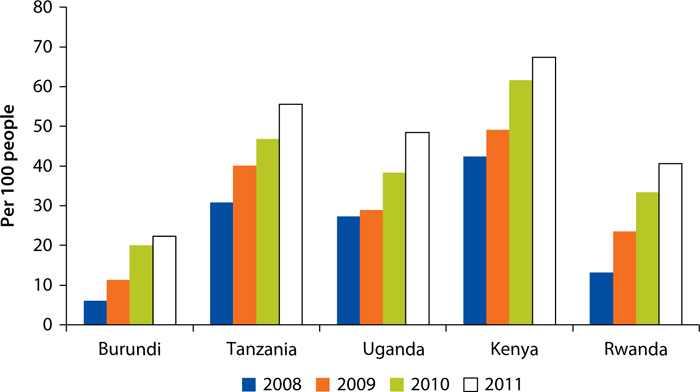
Source: World Bank 2013b.
Note: EAC = East African Community.
This new development gives LCCs the opportunity to facilitate bookings through three channels: short message service (SMS), interactive voice response, and Internet on mobile broadband. For the first two channels, all that is required is a mobile phone with texting and voice calling functionality. Both are available in almost all modern mobile phones. SMS bookings have already been used in other regions of the world, as for example in India with Kingfisher Airlines offering SMS booking by sending a simple text including data, origin, and destination, with a response for the requested schedule via SMS. Similarly for interactive voice response, all that is needed is an automated voice recording guiding a customer through to purchase.
Access to mobile broadband has helped fill the gap arising from the lack of fixed broadband infrastructure, and has enabled many customers to book their airline tickets via mobile Internet browsing and dedicated airline applications. According to a study by Deloitte Consulting and the GSM Association (Deloitte and GSMA 2012), 3G services are now available in all EAC countries. In Tanzania, operator Smile has even launched a faster 4G service for Dar es Salaam. This has considerably increased Internet access via mobile platforms. In Kenya, for example, over 27 percent of Internet browsing is done through mobile devices. The increased usage of smartphones is expected to further support access to mobile broadband in the future. The study estimates that by 2017, the penetration of smartphones in Kenya and Tanzania will be at 28 percent and approximately 22 percent respectively. Decreased costs for smartphones have made the devices more accessible, with the launch of a US$50 smartphone in 2013. Some providers, such as the Tanzanian mobile company Tigo, have even created systems that allow for access to Internet via SMS at a cost of US$0.06 per day (Kazonta 2012).
Mobile markets have increasingly become a solution for coping with the challenge of formal electronic payment methods, such as credit cards. Credit card penetration is still very low in Sub-Saharan Africa, at around 3 percent in 2012 (Togan-Egrican, English, and Klapper 2012), because of a lack of access to financial services, particularly in rural areas. With the exception of Kenya (no data were available for Tanzania), the majority of the population does not deposit their money with commercial banks. In Burundi, only 27 out of 1,000 people use commercial banks for deposits (see figure 5.38).
The mobile payment (M-Pay) market has grown considerably in Africa. M-Pay allows users to make their transactions via their mobile devices, without the need for a bank account. It therefore has the ability to capture a much larger share of the market. EAC countries have been at the forefront of introducing M-Pay initiatives. Kenya has become the global leader in mobile money transfer services through their M-PESA system. Provided by Safaricom, the country’s leading mobile network operator in 2007, personal accounts are held by the operator and transactions are made and recorded using SMS. The conversion of cash into electronic value is done through retail stores. M-PESA had 15 million customers in 2012 (Clayton 2012), and was used by LCC Fly540 for airline bookings (Kagwe 2011a). Zain, a leading mobile telecommunications provider in the Middle East and Africa, launched Zap in 2009, providing a platform for transactions in Tanzania, Kenya, and Uganda (Grail Research 2010).
Good governance is the key for a competitive and transparent market in any country. The World Bank’s Worldwide Governance Indicator Project (World Bank 2013c) has developed a holistic assessment of governance in most countries around the world. For the EAC countries, the study examines governance in light of four out of the six key indicators, which are particularly important in this context: political stability and the absence of violence, regulatory quality, rule of law, and control of corruption. The data set gives an estimate of the level of governance within a range of −2.5 (weak) to 2.5 (strong) as a measure of governance performance.
In four of the five EAC countries, the perceived level of governance is negative for all four indicators (see figure 5.39). The exception is Rwanda, which is perceived to have stronger governance with regard to the indicators for corruption and regulatory quality.
Figure 5.39 Governance Indicators for EAC
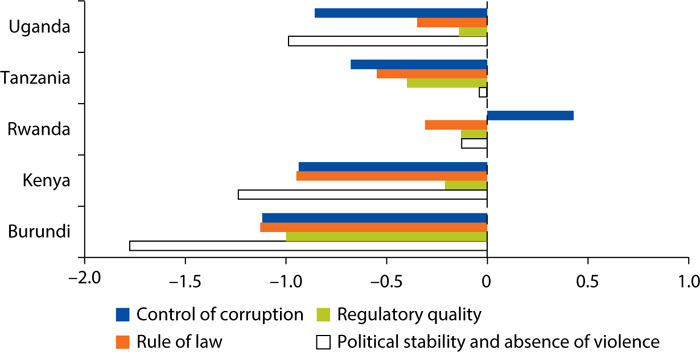
Source: World Bank’s Worldwide Governance Indicator Project (World Bank 2013c).
Note: Estimate of governance ranges from approximately −2.5 (weak) to 2.5 (strong) governance performance. EAC = East African Community.
Political stability appears to be one of the key concerns in the region, particularly in Uganda, Kenya and Burundi. All three countries have undergone political unrest and conflict in the past, with Burundi emerging from a civil war in 2005. Kenya has been in political turmoil since its election in 2008. The re-emergence of the Lord Resistance Army (LRA) insurgency, an ongoing guerilla campaign in Uganda in 2008, has been another significant challenge. Corruption is also perceived to be rife across Burundi, Kenya, Tanzania and Uganda—and rule of law is perceived as weak in most countries.
Chapter 5 provides an overview of the EAC market in light of the LCC framework developed in chapter 4. While this represents a preliminary assessment and further research, particularly of the air transport market, is required to identify the viability of this business model for the EAC market, initial conclusions can be drawn that will give an indication as to whether the environment is conducive to LCC growth.
The air transport market in EAC appears to still be in the early stages of development. Traffic is primarily concentrated around Nairobi and Dar es Salaam, with little intra-regional traffic and only a few high frequency domestic routes. Competition varies on a route basis, but many intra-regional routes are served by only one or two carriers. However, considering the limited traffic, this may be as much as the markets can absorb at this time. Due to limited traffic, the types of aircraft used are primarily 60–80 seaters, which generally have higher unit costs than the A320 or B737 aircraft commonly used by LCCs. Airline operating costs are driven up even higher by airport taxes, fees, and charges in the region. Although still struggling with some unprofitable state-owned carriers such as Rwandair and Air Burundi, the market in the EAC has developed a few privately-owned carriers. The market has also seen the emergence of its first LCC Fly540—later renamed Fastjet. Though overall fare levels are still very high, the presence of the LCC has had a significant impact on fare levels in some markets, particular in Tanzania. The airline has, however, been ridden by financial difficulties in the past, making its future prospects doubtful.
Although economic growth, tourism opportunities, rising urbanization, and the state of transport infrastructure in some EAC countries are all factors conducive to LCC operations, inequality is still very high. Only Kenya appears to have a considerable middle class forming in the near future. Therefore, a lack of sufficient demand will make it difficult for LCCs to fill its planes and utilize its resources efficiently.
Airside infrastructure is generally not the problem. There is still plenty of airside capacity for growth at most EAC airports. In the medium term, some airports may require additional apron space and taxiway layouts must be adjusted in some cases. However, good maintenance routines of existing airside infrastructure may be more effective and cost-efficient than newer runways.
Landside infrastructure may in some cases constrain growth in the future. The size of passenger terminals, particularly in Nairobi, has compromised the quality of service at larger airports. To address this, a considerable number of expansion projects across EAC have been initiated by the World Bank and other donors.
CNS infrastructure is still limited, compromising the safety of operations. Newer GNSS-based technologies such as ADS-B are expected to provide a low-cost CNS solution, enabling countries to avoid costly radar installations.
Aeronautical fees are still high in some cases, but relatively moderate when contrasted with other African countries, such as Angola or Senegal. The burden has mostly been on passengers, however, which significantly influences the level of fares LCCs can charge.
Liberalization of air transport is under way. Progress has been made toward the liberalization of air transport in EAC. However, the required amendment of bilateral agreements in accordance with the YD is still pending. In addition, the frameworks promulgated under other RECs, of which EAC member states are also a part, have slowed progress considerably.
The removal of capacity and frequency restrictions is expected to stimulate air transport significantly. In effect, it will provide more opportunities for emerging carriers to provide intra-EAC routes, which is of particular importance for LCCs. Given the current traffic levels, however, it is questionable whether the application of fifth freedom traffic rights would actually have a significant impact. For LCCs that provide point-to-point traffic, this is generally less relevant.
Safety and security is still a challenge in EAC countries. The region experienced a significant number of accidents in the last decade, which were rooted in poor safety oversight and inadequately trained staff. ICAO audits show that in many audit areas, EAC countries still underperform. The regional body, CASSOA, has been trying to harmonize and improve safety standards in the region, but lacks the necessary financial and human resources.
The lack of human resources and training facilities is a general problem across EAC, with only a few sufficiently funded and cost-efficient training schools in the region. Trained pilots and maintenance engineers frequently get solicited by carriers from other regions, such as the Middle East, which offer better and higher paid opportunities. The lack of aviation personnel has driven costs up in the region, placing a high burden on an airline’s operating costs. In addition, labor regulations in some countries, such as Rwanda and Tanzania, drive up costs by excessive social security contributions and additional labor-related levies.
Aircraft financing is still very expensive, with the cost of finance and the inability to reach economies of scale making it difficult for airlines to finance their aircraft. In addition, the safety standards and the lack of legal protection in some countries make aircraft manufacturers and leasing companies shy away from selling their aircraft to the region. Various initiatives have tried to address this. As a first step, Kenya, Tanzania, and Rwanda have become party to the Cape Town Convention providing lenders with a certain degree of protection in case of failure of the airline.
Taxation of fuel and the lack of appropriate facilities have been an impediment to growth. Most EAC countries have abolished their excise duty. However, Kenya still taxes jet fuel through an excise and a development levy. In addition, tariffs for the import of jet fuel and the high transport cost between Eldoret via road to Uganda, Rwanda, and Burundi drive costs even higher.
Mobile technology and mobile payments are providing for new low-cost distribution channels. The high penetration of mobile technology and the expected rise in smartphones provide important distribution channels for airlines. The EAC has also been at the forefront of developing mobile payment systems to address the lack of credit cards in the region. This is of particular importance to LCCs, as it provides a low cost and accessible means of promoting their product.
Good governance is still an issue in the region. Corruption levels are still perceived to be high in almost all countries, with the exception of Rwanda. Rule of law and regulatory quality have both been compromised in EAC countries, posing a substantial challenge to investments.
This preliminary analysis has shown that LCCs will face a considerable number of hurdles in the EAC market. Challenges include (a) a limited existing network; (b) high levels of economic inequality hampering demand; (c) in some cases high infrastructure costs; (d) limited human resources; (e) high fuel costs; and (f) restrictive ASAs. This renders it difficult for a business model that relies on low input costs and high utilization to survive. The removal of these impediments would considerably accelerate and foster the development of air transport in the region. However, it is questionable whether the LCCs could flourish and sustain profitability at this point in time.
1. The member states (effective December 21, 1981, unless another date is shown) are Angola, Burundi, the Comoros, the Democratic Republic of Congo, Djibouti, the Arab Republic of Egypt (January 6, 1999), Eritrea (1994), Ethiopia, Kenya, Libya (June 3, 2005), Madagascar, Malawi, Mauritius, Rwanda, the Seychelles (2001), Republic of South Sudan, Swaziland, Uganda, Zambia, and Zimbabwe.
2. Purchasing power parity is the ratio between the currencies of two countries at which each currency, when exchanged for the other, will purchase the same quantity of goods as it purchases at home, excluding customs duties and costs of transport.
3. Airside infrastructure is defined as the part of an airport nearest the aircraft, the boundary of which is the security check, customs, and passport control. This includes part of the terminal, airfield, gates, air bridges, runways, aprons, and taxiways.
4. Landside infrastructure is defined as the part of an airport farthest from the aircraft, the boundary of which is the security check, customs, and passport control. It includes part of the terminal, passenger services, food and beverage concessions, duty-free shopping, car parking, and so on.
5. Secondary radar is a radar system used in air traffic control, which detects and measures the position of aircraft and requests additional information from aircraft, such as identity and altitude.
6. Upper airspace is airspace above Flight Level 245 (24,500 ft).
7. PPPs, public-private partnerships, are agreements between a government and one or more private sector partners (which may include the operators and/or the financiers), according to which the private partners deliver the service in such a manner that the service delivery objectives of the government are aligned with the profit objectives of the private partners—and where the effectiveness of the alignment depends on a sufficient transfer of risk to the private partner.
8. “Brain drain” refers to qualified staff emigrating from a vicinity or place for better jobs.
ACI (Airports Council International). Air Traffic Report Africa. 2012.
African Development Bank. 2011a. “AfDB and COMESA Sign Airspace Integration Project Grant Agreement.” African Development Bank Press Release, February 15. http://www.afdb.org/en/news-and-events/article/afdb-and-comesa-sign-airspace-integration-project-grant-agreement-7754/.
———. 2011b. “AfDB Approves USD 40 Million Loan to Ethiopian Airlines.” African Development Bank Press Release, March 24. http://www.afdb.org/en/news-and-events/article/afdb-approves-usd-40-million-loan-to-ethiopian-airlines-7857/.
AICD (Africa Infrastructure Country Diagnostics). 2009. Air Transport: Challenges to Growth. http://siteresources.worldbank.org/EXTAIRTRANSPORT/Resources/515180-1262792532589/challenges.pdf.
Airbus. 2013. Global Market Forecast 2013–32. http://www.airbus.com/company/market/forecast/.
Airline Update. n.d. Airline Ground Handling in Kenya. http://www.airlineupdate.com/content_subscription/gha/africa/kenya.htm.
Air Traffic and Navigation Services. 2013. VSAT Networks—Cape Town to Cairo and Beyond. http://www.atns.co.za/commercial-services/vsat.
allAfrica. 2013. “Tanzania: Dutch Win Dar es Salaam Terminal Three Contract.” April 29. http://allafrica.com/stories/201304291884.html.
Association of Tanzania Employers. 2011. Business Agenda 2011–2014. http://lempnet.itcilo.org/en/hidden-folder/ate-tanzania-business-agenda.
Astier, C. 2012. Exponential Growth of African Business Law and the Spread of Common Law. Hogan Lovells Africa. http://www.hoganlovellsafrica.com/_uploads/Publications/Information_sheet_-_African_business_law_growth.pdf.
Autorité de l’Aviation Civile Burundi. 2013. “Décret portant organisation et fonctionnement de l’AACB.” http://www.aacb.bi/spip.php?article16.
AZ World Airports. 2013a. Runway Surface. http://www.azworldairports.com/cfm/homepage.cfm.
———. 2013b. Passenger Capacity. http://www.azworldairports.com/cfm/homepage.cfm.
Balinda, B. 2013. “Driving Tourism in Africa (The Uganda Case).” Presentation at Routes Africa Strategy Summit, Uganda Tourism Board, Kampala, Uganda.
Butera, S. 2013. “Rwandair May Offer Shares after Returning to Profit in Two Years.” Bloomberg, February 11. http://www.bloomberg.com/news/2013-02-12/rwandair-may-offer-shares-after-returning-to-profit-in-two-years.html.
CAPA (Centre for Asia Pacific Aviation). 2010. “Singapore Aviation Outlook: A Key Asia Pacific Market with Key Asia Pacific Airlines.” March 24. http://centreforaviation.com/analysis/singapores-aviation-outlook-a-key-asia-pacific-market-with-key-asia-pacific-airlines-22861.
———. 2011. “Fly540 Targets Continued Growth in Under-Served African Market.” January 10. http://centreforaviation.com/analysis/fly540-targeting-continued-growth-in-underserved-african-markettargeting-18-country-network-by-2012-43164.
———. 2012. “Opportunities and Challenges as Fly540, First Pan-African Airline, Adopts Stelios Fastjet Brand.” June 14. http://centreforaviation.com/analysis/opportunities-and-challenges-as-fly540-first-pan-african-airline-adopts-stelios-fastjet-brand-76040.
———. 2013a. “Precision Air Reports a USD18.9 Million Loss for FY2013 Due to Overly Ambitious Growth.” September 7. http://centreforaviation.com/analysis/precision-air-reports-a-usd189-million-loss-for-fy2013-due-overly-ambitious-growth-127300.
———. 2013b. “Uganda Plans to Relaunch Airlines and Invest USD400 Million in Airport Development.” August 1. http://centreforaviation.com/analysis/uganda-plans-to-relaunch-uganda-airlines-and-invest-usd400-million-in-airport-developments-121503.
———. 2013c. “Fastjet Pushed Ahead with African Expansion in 2013 but Faces Protectionist Hurdles.” March 12. http://centreforaviation.com/analysis/fastjet-pushes-ahead-with-african-expansion-in-2013-but-faces-protectionist-hurdles-100841.
———. 2013d. “Fastjet Posts USD56 Million Loss but Remains Optimistic about African Success.” June 8. https://centreforaviation.com/analysis/fastjet-posts-usd56-million-loss-but-remains-optimistic-about-african-success-113205.
Carrier, C. 2013. “Regional Aircraft as a Solution to Network Growth in Africa.” Presentation at Routes Africa, Bombardier, July 8. http://www.routesonline.com/library/479/routes-africa-strategy-summit-2013/479/regional-aircraft-as-a-solution-to-network-growth-in-africa-charles-carriere/.
CIA (Central Intelligence Agency). 2013. “The World Factbook.” https://www.cia.gov/library/publications/the-world-factbook/.
CASSOA (Civil Aviation Safety and Security Oversight Agency). 2013. Report of the Second Aviation Symposium. http://www.cassoa.org/docs/FINAL%202ND%20SYMPOSIUM?%20REPORT%20-%20June%202013.pdf.
Clayton, N. 2012. “More to African Mobile Payments than M-Pesa.” Wall Street Journal, October 29. http://blogs.wsj.com/tech-europe/2012/10/29/more-to-african-mobile-payments-than-m-pesa/.
CNN (Cable News Network). 2000. “Easyjet Values Itself at $816 Million; Sets IPO Price Range.” http://cnnfn.cnn.com/2000/10/31/europe/easyjet/.
Comsoft. 2013. “Tanzania CAA Choose COMSOFT for Tandem Delivery of ADS-B and AMHS.” June. http://www.comsoft.aero/press-media-events/press-releases/press-releases/?tx_ttnews%5Btt_news%5D=169&cHash=fff0fbe28f568386afc1fb691d5ab664.
Daily Nation. 2010. “Malindi Airport Hit by Jet Fuel Scarcity.” January 7. http://www.nation.co.ke/business/news/-/1006/838254/-/view/printVersion/-/iftxanz/-/index.html.
Deloitte Consulting and GSMA. 2012. Sub-Saharan Africa Mobile Observatory 2012. http://www.gsma.com/publicpolicy/wp-content/uploads/2012/03/SSA_FullReport_v6.1_clean.pdf.
DiiO SRS Analyzer. 2013. DiiO Online Database. http://www.diio.net.
EAC (East African Community). n.d. Proposal for the Partnership Funding: Global Navigation Satellite System (GNSS) Procedures Development. http://www.dk-export.dk/media/GNSSProposalEAcfrance.pdf.
———. 1999. East African Community Treaty. Arusha, Tanzania: EAC.
East African Community Statistics Portal. 2013. “EAC: A Snapshot.” http://www.statistics.eac.int.
East African Community Secretariat. 2006. Report of the Meeting of the 11th Meeting of the Council of Ministers. Arusha, Tanzania: EAC Secretariat.
Easy Coach. 2013. “Fares Nairobi to Up-Country.” http://www.easycoach.co.ke/nairobi-to-upcountry.html.
easyGroup. 2013. “Fastjet December Passenger Statistics.” http://www.easy.com/fastjet/3360-fastjet-december-passenger-statistics.html.
Emorut, F. 2012a. “Uganda Tops Africa in Tourism Growth.” New Vision, September 29. http://www.newvision.co.ug/news/635781-uganda-tops-africa-in-tourism-growth.html.
———. 2012b. “East Africa: Population Growth Worries UNFPA.” allAfrica, August 11. http://allafrica.com/stories/201208120022.html.
eTurboNews. 2011. “Entebbe Airport Runs Out of Jet Fuel Again.” November 30. http://www.eturbonews.com/26650/entebbe-airport-runs-out-jet-fuel-again.
European Commission. 2013. List of Airlines Banned within the EU. http://ec.europa.eu/transport/modes/air/safety/air-ban/index_en.htm.
Evans, R. 2011. “New Lease of Life for Kenya’s ‘Lunatic’ Railway.” BBC, July 18. http://www.bbc.co.uk/news/world-14151372.
Flight Foundation. 2013. Aviation Safety Network. http://aviation-safety.net/index.php.
Fly540 Africa. 2013. “Destinations.” http://www.fly540.com.
Gichane, C. 2012. “Kenya Airways Signs Up Afreximbank.” Capital FM. June 25. http://www.capitalfm.co.ke/business/2012/06/kenya-airways-signs-up-afreximbank/.
Grail Research. 2010. “Mobile Payment Opportunity in the Middle East and Africa (MEA) Region.” Presentation. http://grailresearch.com/pdf/ContenPodsPdf/Mobile_Payment_Opportunity_in_MEA_Region.pdf.
Gwilliam, K., with H. Bofinger, R. Bullock, R. Carruthers, A. Kumar, M. Mundy, A. Nogales, and K. Sethi. 2011. Africa’s Transport Infrastructure. Washington, DC: World Bank.
Hayter, S., and V. Stoevska. 2011. “Social Dialogue Indicators: International Statistical Inquiry 2008–2009.” Technical Brief, International Labour Organization. http://laborsta.ilo.org/applv8/data/TUM/TUD%20and%20CBC%20Technical%20Brief.pdf.
IATA (International Air Transport Association). 2013. “Demand for Air Travel Stays Firm but Regional Variations.” International Air Transport Association Press Release, May 28, 30. http://www.iata.org/pressroom/pr/Pages/2013-05-30-01.aspx.
———. n.d. Fuel Monitor. http://www.iata.org/publications/economics/fuel-monitor/Pages/price-analysis.aspx.
ICAO (International Civil Aviation Organization). 2009. ICAO’s Policies on Taxation in the Field Of International Air Transport. Montreal, Canada: ICAO.
———. 2013a. 2013 Safety Report. http://www.icao.int/safety/Documents/ICAO_2013-Safety-Report_FINAL.pdf.
———. 2013b. Safety Audit Information. http://www.icao.int/safety/Pages/USOAP-Results.aspx.
IFC (International Finance Corporation). 2013. Challenges and Opportunities in Sub-Saharan Africa: Emphasis on Low-Cost Carriers and Their Potential Impact on the Market. Unpublished presentation, International Finance Corporation, Nairobi, Kenya.
Ihucha, A. 2012. “EAC Civil Aviation Regulatory Body Fails to Get Consent.” The East African, March 31. http://www.theeastafrican.co.ke/business/EAC+civil+aviation+regulatory+body+fails+to+get+consent/-/2560/1377284/-/255m8oz/-/index.html.
IMF (International Monetary Fund). 2013. World Economic Outlook Database April 2013. http://www.imf.org/external/data.htm.
In2EastAfrica. 2011. “Rwanda: Aviation Experts Call for Capacity Building.” November 1. http://in2eastafrica.net/rwanda-aviation-experts-call-for-capacity-building/.
ITU (International Telecommunications Union). 2013a. Core Indicators on Access to, and Use of, ICT by Households and Individuals, Latest Available Data (2008–2012). http://www.itu.int/en/ITU-D/Statistics/Pages/stat/default.aspx.
———. 2013b. ICT Facts and Figures 2013. http://www.itu.int/en/ITU-http://www.itu.int/en/ITU-D/Statistics/Documents/facts/ICTFactsFigures2013-e.pdf.
Jeppesen. 2013. Fueling Facilities Kenya, Uganda, Rwanda, Burundi and Tanzania.
Kagwe, W. 2011a. “Fly540 Connect to MPesa.” The Star, July 26. http://www.the-star.co.ke/news/article-55817/fly540-connects-mpesa.
———. 2011b. “Shortage of Pilot Raises Concerns in Industry.” The Star, June 29. http://www.the-star.co.ke/news/article-58901/shortage-pilots-raises-concern-industry.
Kazonta, H. 2012 “Tigo Launches ‘Xtreme’ Bundles.” Biztech Africa, July 17. http://www.biztechafrica.com/article/tigo-launches-xtreme-bundles/3556/#.U3Db5_mSySo.
Kazooba, C. 2007. “Uganda: Entebbe Radar Monitors Country Airspace.” The New Times. http://www.newtimes.co.rw/news/views/article_print.php?&a=1835&icon=Print.
Kenya Airports Authority. 2013. “About Us.” https://www.kaa.go.ke/about-us/our-mandate.
Kenya Ministry of Tourism. 2010. Kenya Tourism Overview 2010. http://www.tourism.go.ke/ministry.nsf/pages/facts_figures.
Kenya National Bureau of Statistics. 2010. Reported Visitor’s Arrival by Purpose 2001–2010. http://www.knbs.or.ke/sectoral/tourism/Visitor_Statistics.pdf.
Kenya Revenue Authority. 2013. The Value Added Tax Act (2013). Nairobi: Government of Kenya.
Kilimanjaro Airport Development Company. 2013. http://www.kilimanjaroairport.co.tz/.
KPC (Kenya Pipeline Company). 2012. Annual Report and Financial Statements 2011. http://www.kpc.co.ke/images/stories/downloads/KPC_2011.pdf.
———. 2013. Key Achievements 2002 to Date. http://www.kpc.co.ke/achievements?showall=&start=1.
Lonrho Aviation. 2012. “RNS News Item.” Press Release, Lonrho Aviation. June 13. http://www.lonrho.com/Press/News_(RNS)/RnsNews.aspx?id=779&rid=11231504.
Maina, W. 2011. “KQ Sets Sights on Expats to Ease Shortage of Pilots.” Business Daily, December 18. http://www.businessdailyafrica.com/Corporate+News/KQ+sets+sights+on+expats+to+ease+shortage+of+pilots+/-/539550/1291588/-/5e090w/-/index?.html.
Makame, A. 2012. “The East African Integration: Achievement and Challenges.” GREAT Insights 1 (6). http://ecdpm.org/great-insights/trade-and-development-making-the-link/east-african-integration-achievements-challenges/.
Matschnigg, G. 2013. “Safety: Focus on Africa.” Presentation at Annual General Meeting, International Air Transport Association. http://www.iata.org/pressroom/facts_figures/Documents/safety-gunther-agm2013.pdf.
Mbalamwezi, J. 2011. “Tanzania to Upgrade 10 Airports in Infrastructure Project.” The East African, August 20. http://www.theeastafrican.co.ke/business/-/2560/1222228/-/bc59i2z/-/index.html.
McAuliffe, C., S. Saxena, and M. Zabara. 2012. “The East African Community: Prospects for Sustained Growth.” International Monetary Fund Working Paper. http://www.imf.org/external/pubs/ft/wp/2012/wp12272.pdf.
McKormick, D. 2008. Impact of the Financial Crisis on Kenya. Institute of Development Studies. http://www.ids.ac.uk/files/dmfile/KENYADorothyMcCormick.pdf.
Momberger Airport Information. 2012. Who Owns and Manages Privatized Airports. http://www.air-trans-source.com/linked/manage-bk.pdf.
Muchira, J. 2013. “Uganda Announces $400m Plan to Modernise Entebbe Airport.” Engineering News, July 26. http://www.engineeringnews.co.za/article/uganda-announces-400m-plan-to-modernise-entebbe-airport-2013-07-26.
Mueller, J., T. Ulku, and J. Zivanovic. 2009. Privatization, Restructuring and Its Effect on Performance: A Comparison between German and British Airports. German Airport Performance Project, joint research project of the University of Applied Sciences Bremen, the Berlin School of Economics and Law (HWR), and the International University of Applied Sciences in Bad Honnef, Bonn.
Muhumuza, M. 2012. “CAA in Bed with ENHAS as Airlines Cry Foul.” The CEO Magazine, April 5. http://www.theceomagazine-ug.com/news/caa-in-bed-with-enhas-as-airlines-cry-foul.html.
Muiri, J. 2013. “State Wants Bigger Say in Running of Kenya.” Daily Nation, July 9. http://www.nation.co.ke/business/news/State-wants-bigger-say-in-running-of-Kenya-Airways–/-/1006/1910158/-/wmcikuz/-/index.html.
Munyagi, M. T. 2006. Existing Bi-Lateral Air Service Agreements of Tanzania as of 30 November 2006. Dar es Salaam: Tanzania Civil Aviation Authority.
Muson, E. 2009. “Rwanda: The Nation Moves to Control Her Airspace.” New Times. http://www.newtimes.co.rw/news/views/article_print.php?i=13929&a=16671&icon=Print.
Mutegi, M. 2012. “Kenya Airports Authority Doubles Air Passenger Charges.” Business Daily Africa, May 7. http://www.businessdailyafrica.com/Corporate-News/Kenya-Airports-Authority-doubles-air-passenger-charges–/-/539550/1401486/-/sqng97/-/index.html.
National Institute of Statistics of Rwanda. 2012. Statistical Yearbook 2012. http://www.statistics.gov.rw/system/files/user_uploads/files/books/YEAR%20BOOK_2012.pdf.
Ndegwa, N. 2012. “East Africa: EA Aviation Faces Severe Manpower Loss.” Capital FM. April 3. http://www.capitalfm.co.ke/business/2012/04/ea-aviation-facing-severe-manpower-loss/.
NEPAD–OECD Africa Investment Initiative. 2008. “East African Community: Overview of Regional Road Infrastructure Projects.” Background Paper, Expert Roundtable Investment in Transport Infrastructure. http://www.oecd.org/daf/inv/investmentfordevelopment/41775886.pdf.
News of Rwanda. 2013. “East African Community Aviation Calls for Improved Security.” http://www.newsofrwanda.com/english/18963/east-african-community-aviation-calls-for-improved-security/.
New Times. 2013. “Kenya Refinery Seeks $1b to Boost Oil Handling Capacity.” May 4. http://www.newtimes.co.rw/news/index.php?a=66591&i=15347.
New Vision. 2006. “Get Tough with Kenya Airways.” November 28. http://www.newvision.co.ug/D/8/14/534749.
Ngigi, G. 2012. “World Bank’s IFC to Own 7.4 pc Stake in Kenya Airways after Offer.” Business Daily, April 25. http://www.businessdailyafrica.com/World-Bank-IFC-to-own-stake-in-Kenya-Airways-after-offer-/-/539552/1393786/-/b7kgru/-/index?.html.
OECD and WTO. 2011. Aid for Trade Case Story: The COMESA-EAC-SADC Tripartite Trade and Transport Facilitation Programme. http://www.oecd.org/aidfortrade/47407250.pdf.
Okulo, L. 2012. “African Airlines to Purchase Fuel Jointly.” The Star, January 13. http://www.the-star.co.ke/news/article-34322/african-airlines-purchase-fuel-jointly.
Ombok, E. 2011. “Kenyan Internet Usage Doubles over 2010, Ministry Says.” Bloomberg. http://www.bloomberg.com/news/2011-01-19/kenyan-internet-usage-doubles-overAid for Trade Case Story-2010-ministry-says-update1-.html.
Peterson, T. 2013. “Fastjet to Sell Slice of Dar Stake.” The East African, June 15. http://www.theeastafrican.co.ke/business/fastjet+to+sell+slice+of+Dar+stake/-/2560/1883826/-/78158w/-/index.html.
Planespotters. 2013. easyJet Historic Fleet. http://www.planespotters.net/Airline/Easyjet?sort=dd.
PwC (PricewaterhouseCoopers). 2013. Doing Business: Know Your Taxes, East African Tax Guide 2012/13. http://www.pwc.com/ke/en/pdf/2013-east-african-tax-guide.pdf.
Ramah, R. 2013. “East African Community Closer to Common Passport, Tourism Visa.” allAfrica, July 18. http://allafrica.com/stories/201307190057.html.
Ranganathan, R., and V. Foster. 2011. “East Africa’s Infrastructure a Continental Perspective.” Policy Research Working Paper World Bank. http://www-wds.worldbank?.org/servlet/WDSContentServer/WDSP/IB/2011/10/13/000158349_20111013121848/Rendered/PDF/WPS5844.pdf.
Ratha, D., S. Mohapatra, C. Özden, S. Plaza, W. Shaw, and A. Shimeles. 2011. Leveraging Migration for Africa: Remittances, Skills, and Investments. Washington, DC: World Bank.
Rwanda Civil Aviation Authority. 2013. “RCAA Responsibilities.” http://www.caa.gov.rw/about-rcaa/rcaa-responsibilities.html.
Rwanda Development Board. n.d. Highlight of Tourist Arrivals in Rwanda 2010. http://www.rdb.rw/fileadmin/user_upload/Documents/tourism%20conservation/Arrival_Statistics_2010_Jan-Dec.pdf.
Rwanda Institute of Statistics. 2012. Statistical Yearbook 2012. http://www.statistics.gov.rw/publications/statistical-yearbook-2012.
Rwanda Revenue Authority. n.d. East African Community. http://www.rra.gov.rw/rra_article199.html.
Rwigamba, R. 2013. “Rwanda’s View on Tourism as a Life Changing Experience.” eTurboNews, July 21. http://www.eturbonews.com/36340/rwandas-view-tourism-life-changing-experience.
Scandinavia Express. 2013. Scandinavia Express Routes, Fares, Schedules and Charters. http://www.scandinaviagroup.com/Scandinavia%20Express/index.htm.
Schlumberger, C. 2009. “The Implementation of the Yamoussoukro Decision.” Thesis submitted to McGill University in partial fulfillment of the requirements of the degree of Doctor of Civil Law (DCL). http://digitool.library.mcgill.ca/webclient/StreamGate?folder_id=0&dvs=1400678806177~634.
———. 2010. Open Skies for Africa. Washington, DC: The World Bank.
Skytrax. 2013. Airline Travel Rating & Reviews. http://www.airlinequality.com.
Ssenyonga, J. 2013. “Liberalisation of EAC Air Transport on Course.” Sunday Times, January 27. http://www.newtimes.co.rw/news/index.php?i=15250&a=13295.
Sskika, E. 2013. “Uganda: No Cheap Fuel When Oil Starts Flowing.” The Observer, March 12. http://observer.ug/index.php?option=com_content&view=article&id=24163:no-cheap-fuel-when-oil-starts-flowing.
Ssuuna, I. 2013. “New Rwanda Airport Ready for Take-Off.” The East African, April 13. http://www.theeastafrican.co.ke/business/New-Rwanda-airport-ready-for-take-off/-/2560/1747438/-/oqexn5z/-/index.html.
Tairo, A. 2012. “Rising Jet Fuel Prices a Major Setback to African Airlines.” eTurboNews, June 7. http://www.eturbonews.com/29622/rising-jet-fuel-prices-major-setback-african-airlines.
Tanzania Airports Authority. 2013. http://www.taa.go.tz/index.php.
Tanzania Civil Aviation Authority. 2013a. Decision of the Board of Directors on Liberalisation of Ground Handling Services, including Aviation Fuelling. Decision No. 1 of 2013. http://www.tcaa.go.tz/news_detail.php?news=1876.
———. 2013b. The Status of Bilateral Air Services Agreements Concluded between the Government of the United Republic of Tanzania and the Governments of Other Countries as at 28 February 2013. http://www.tcaa.go.tz/files/BASA%20status%20by%2028%20February%202013.pdf.
Tanzania Daily News. 2012. “Tanzania: Tigo Launches SMS Internet Browsing.” http://allafrica.com/stories/201210041051.html.
Tanzania Ministry of Natural Resources and Tourism. 2010. Tourism Statistical Bulletin 2009. http://www.mnrt.go.tz/index.php/tourism-doc?download=25:tourism-statistical-bulletin-2009.
Tanzania National Bureau of Statistics. 2012. Tanzania Tourism Sector Survey. http://www.nbs.go.tz/takwimu/trade/Tourism_Sector_Survey_Report_2010.pdf.
Thome, W. 2010. “Fly540 Takes Over East African Safari Air Express.” Kenya Aviation News, December 19. http://www.eturbonews.com/20101/fly-540-takes-over-east-african-safari-air-express.
Tierny, M. 2012. “Africa: Modernising Africa’s Commercial Aircraft Fleet.” This is Africa, May 1. http://www.thisisafricaonline.com/Perspectives/Modernising-Africa-s-commercial-aircraft-fleet.
Togan-Egrican, A., C. English, and L. Klapper. 2012. “Credit Cards and Formal Loans Rare in Developing Countries: Informal Loans Most Common in Low-Income Countries.” Gallup. http://www.gallup.com/poll/154340/credit-cards-formal-loans-rare-developing-countries.aspx.
Uganda Bureau of Statistics. 2007. Labor Market Condition Indicators. http://www.ubos.org/onlinefiles/uploads/ubos/pdf%20documents/2007%20National%20Labour%20Market%20Indicators.pdf.
———. 2010. Migration and Tourism: Report VI 2005–2009. http://www.ubos.org/onlinefiles/uploads/ubos/pdf%20documents/migration2005_09.pdf.
Uganda Civil Aviation Authority. 2013. “CAA Profile.” http://www.caa.co.ug/index.php?option=com_content&view=article&id=71&Itemid=74.
UNECA (United Nations Economic Commission for Africa). 1988. Declaration of Yamoussoukro on a New African Air Transport Policy. Yamoussoukro, Côte d’Ivoire: UNECA.
———. 2004. La Décision de Yamoussoukro et le transport aérien en Afrique. Paris: Servedit.
UNWTO (United Nations World Tourism Organization). 2011. “Kenyan President Mwai Kibaki Highlights Tourism’s Cultural Benefits upon Joining UNWTO/WTTC Global Leaders Campaign.” United Nations World Tourism Organization Press Release, June 27. http://media.unwto.org/en/press-release/2011-06-27/kenyan-president-mwai-kibaki-highlights-tourism-s-cultural-benefits-upon-jo.
U.S. EIA (United States Energy Information Agency). 2011. Kenya Petroleum Imports. http://www.eia.gov/countries/regions-topics.cfm?fips=EEAE.
Uwanyiligira, I. 2012. Rwanda and the Restoration of Rule of Law. Keynote Address by the Ambassador of Rwanda at The Hague Academic Coalition. http://www.haguecoalition.org/storage/Lecture%20Rwanda%20by%20H.E.%20Ambassador%20Mrs%20Uwanyiligira.pdf.
Vasigh, B., and M. Haririan. 2003. “An Empirical Investigation of Financial and Operational Efficiency of Private versus Public Airports.” Journal of Air Transportation 8 (1): 91–110.
Ventures. 2013. “Kenya’s Lamu Airport Upgrade Nears Completion.” January 3. http://www.ventures-africa.com/2013/01/lamu-airport-upgrade-nears-completion/.
Vogel, H. A. 2006. “Impact of Privatization on the Financial and Economic Performance of European Airports.” The Aeronautical Journal 110 (1106): 197–213.
WEF (World Economic Forum). 2013. Global Competitiveness Report. http://www.weforum.org/issues/global-competitiveness.
World Bank. 2005. East Africa Air Transport Survey. http://siteresources.worldbank.org/INTAIRTRANSPORT/Resources/514573-1117230543314/050617-East_Africa_Air_Transport_Survey_Revision_2.pdf.
———. 2011a. East Africa Infrastructure Report. http://elibrary.worldbank.org/doi/pdf/10.1596/1813-9450-5844.
———. 2011b. “Turning the Tide in Turbulent Times: Making the Most of Kenya’s Demographic Change and Rapid Urbanization.” Kenya Economic Update, No. 4. Poverty Reduction and Economic Management Unit Africa Region.
———. 2011c. Migration and Remittances Factbook 2011. http://data.worldbank.org/data-catalog/migration-and-remittances.
———. 2013a. Doing Business: EAC. http://www.doingbusiness.org/~/media/GIAWB/Doing%20Business/Documents/Special-Reports/DB13-EAC.pdf.
———. 2013b. World Development Indicators. http://data.worldbank.org/indicator/SI.POV.2DAY.
———. 2013c. Worldwide Governance Indicator Project. http://info.worldbank.org/governance/wgi/index.asp.
World Bank and IFC (International Finance Corporation). 2013. Enterprise Surveys: What Businesses Experience. http://www.enterprisesurveys.org.
WHO (World Health Organization). 2013. Road Safety Status Report 2013. http://www.who.int/violence_injury_prevention/road_safety_status/2013/en/.
World Travel and Tourism Council. 2013a. Travel and Tourism, Economic Impact 2013: Kenya. http://www.wttc.org/site_media/uploads/downloads/kenya2013_1.pdf.
———. 2013b. Travel and Tourism, Economic Impact 2013: Rwanda. http://www.wttc.org/site_media/uploads/downloads/rwanda2013_2.pdf.
———. 2013c. Travel and Tourism, Economic Impact 2013: Uganda. http://www.wttc.org/site_media/uploads/downloads/uganda2013.pdf.
———. 2013d. Travel and Tourism, Economic Impact 2013: Tanzania. http://www.wttc.org/site_media/uploads/downloads/tanzania2013.pdf.
WTO (World Trade Organization). 2013. ASAP Analytical Tool. http://www.wto.org/asap/index.html.