5 Measurement of environmental health and energy security benefits
This chapter discusses the estimates of the environmental emissions, environmental health, and energy security benefits from the on-road operation of EDVs.1 Environmental health benefits are presented for three time periods: the retrospective time period of 1999 to 2012; the remaining vehicle lifespan, 2013 to 2022; and the full life cycle of these vehicles, 1999 to 2022.2
Approach to emissions estimation
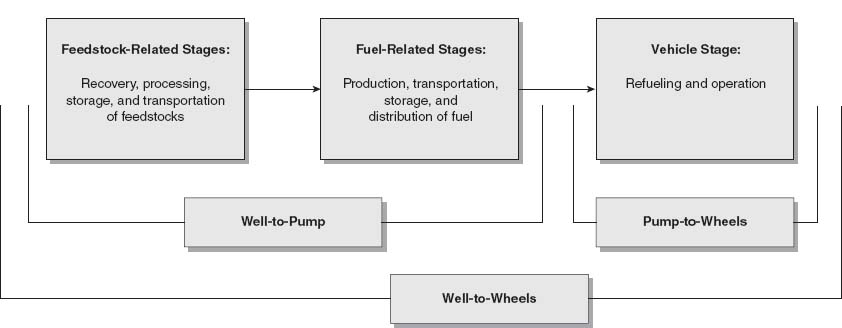
Emissions from vehicles can be divided into two parts: well-to-pump (WtP) and pump-to-wheel (PtW); see Figure 5.1. This chapter focuses on the PtW, or vehicle operation, emissions reductions from EDVs. Estimates of impacts from well-to-wheel (WtW), or total emissions that also account for fuel production, feedstocks, distribution, and transportation, are included in the appendix to this chapter.
Under the operation of a gasoline internal combustion engine, vehicles emit a number of pollutants that contribute to climate change, air pollution, acid rain, visibility impairment, and surface water pollution (U.S. EPA, 2000). The ability of EDVs to operate on electric power for a portion of, or all of, the vehicle’s operation reduces the amount of gasoline combusted and therefore the amount of tailpipe emissions. The impacts of EDVs on greenhouse gas (GHG) emissions, health impacts from reductions in air pollutants, and energy security benefits from reduced fuel consumption are based on the following assumptions:
• Each HEV, PHEV, or EV purchase offsets the purchase of a new ICV.
• All vehicle types use a fuel blend of 90.5 percent reformulated gasoline and 9.5 percent ethanol.3
• Emissions from brake and tire wear do not change by vehicle type.
The GREET model, developed by Argonne National Laboratory, was used to estimate emissions reductions. The GREET model estimates emissions factors for each vehicle type (ICV, HEV, PHEV, and EV) in 5-year intervals called vehicle model years. GREET provides emissions factors for GHGs and common air pollutants. Table 5.1 lists the specific pollutants relevant to this analysis.
Well-to-wheels, well-to-pump, and pump-to-wheels analysis for fuel and vehicle systems |
Source: Based on Wu et al. (2006).
Name |
Abbreviation |
Type |
Carbon dioxide |
CO2 |
Greenhouse gas |
Methane |
CH4 |
Greenhouse gas |
Nitrous oxide |
N2O |
Greenhouse gas |
Carbon monoxide |
CO |
Air pollutant that can oxidize into a greenhouse gasa |
Volatile organic compounds |
VOC |
Air pollutant that can oxidize into a greenhouse gasa |
Nitrogen oxides |
NOx |
Air pollutant |
Particulate matter smaller than or equal to 2.5 micrometers |
PM2.5 |
Air pollutant |
Sulfur dioxide |
SO2 |
Air pollutant |
Ammonia |
NH3 |
Air pollutant |
Sources: U.S. EPA (2012a, e)
Note
aThe carbon contained in CO and VOCs can oxidize into CO2 (ANL 2012).
In 2000, the U.S. EPA instituted their Tier 2 requirements, which required reductions of nitrogen oxides (NOx) and volatile organic compounds (VOCs) emissions as well as requiring lower sulfur content in gasoline for all vehicles. These requirements were phased in throughout the mid-2000s (U.S. EPA, 2000). To account for this adjustment in the analyses that follow, it was assumed that all vehicles purchased in 2005 and before possess the emissions factors from the GREET 2005 vehicle model year. All vehicles sold between 2006 and 2012 were assumed to possess the emissions factors of the GREET 2010 vehicle model year.4 Figure 5.2 provides an overview of the methodology for this chapter.
Avoided greenhouse gas emissions
The combustion of gasoline during vehicle operations is a major contributor to GHG emissions. When an EDV operates on the electric drivetrain rather than using the gas engine, no tailpipe emissions occur, so it emits fewer GHGs into the atmosphere. These reductions will vary by vehicle type because an HEV operates using its gasoline engine more than a PHEV, while an EV will have zero tailpipe emissions because it does not use a gasoline engine. The three GHGs produced during fossil fuel combustion are carbon dioxide (CO2), methane (CH4), and nitrous oxide (N2O).5 Each has a differing impact depending on the gases’ ability to absorb energy and how long the gas remains in the atmosphere; this is called the global warming potential (GWP). GWP is measured in equivalents of a metric ton of CO2. Gasoline combustion emits far fewer quantities of CH4 and N2O than CO2; however, CH4 and N2O are more effective at trapping heat in the atmosphere; thus, they both have a higher GWP than CO2. CH4 and N2O contribute 20 and 300 times, respectively, more to global warming than CO2 (U.S. EPA 2012a).
Approach for assessing environmental health benefits and energy security benefits from EDVs |
The GREET model is used to estimate the rate of GHG emissions per mile driven by each vehicle type. The GREET model estimates a GHG emissions factor that captures the emissions of CO2, CH4, N2O, and the carbon contained in VOCs and carbon monoxide (CO) that will fully oxidize into CO2. This GHG estimate is measured in metric tons of equivalent CO2 and accounts for the higher GWP of the non-CO2 gases. Table 5.2 lists the emissions factors of GHGs by vehicle type and model year.
To calculate GHG emissions, the attributable miles from Table 4.11 were separated into the appropriate model year and vehicle type; see Table 5.3.
GHG emissions reductions were calculated by multiplying the attributable miles by the difference in emissions between the appropriate vehicle type and the conventional ICV to determine avoided GHG emissions. For example, in 1999 HEVs were driven 97,000 miles (rounded to the nearest thousand miles). This value was multiplied by 97.2 (the emissions factor of an ICV [337.2] subtracted from the emissions factor of an HEV [240.4]) and then converted to metric tons. Figure 5.3 shows avoided GHG emissions associated with EDVs sold from 1999 through 2012 for the years 1999 to 2022. Reductions peaked in 2012 at just over 1.3 million metric tons of equivalent CO2 (CO2eq).

Source: Based on ANL (2012).
Attributable miles driven by vehicle type, 1999 through 2022 |
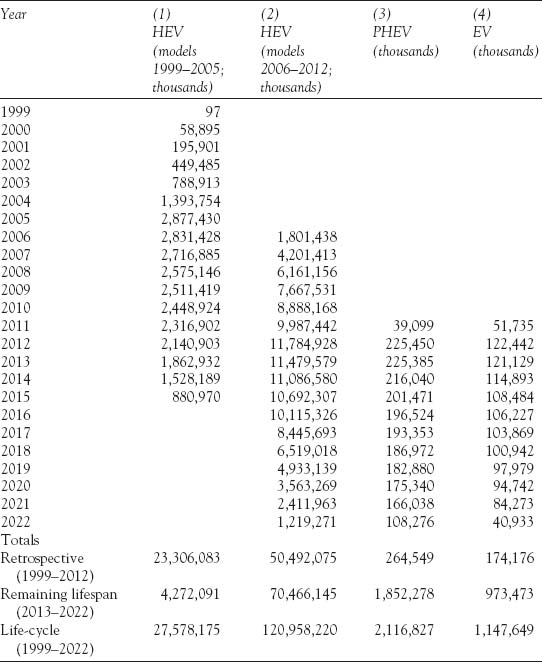
Note: Numbers match those in Table 4.11. HEVs were broken out by model years before and after 2005.
During the retrospective time series, EDVs were responsible for avoiding 7.0 million metric tons of CO2eq. When accounting for the full life cycle of these vehicles, the emission of 14.5 million metric tons of CO2eq will be avoided. Table 5.4 shows the breakdown of GHG emissions reductions by vehicle type.
The majority of the avoided GHG emissions come from HEVs, which were responsible for over 98 percent of the GHG emissions during the retrospective time series and over 95 percent of the life-cycle time series. Although PHEVs and EVs have significantly lower PtW GHG emissions than HEVs and ICVs, these vehicles only account for a small percentage of the GHG reductions as a result of their comparatively lower sales volume through 2012.
Cumulative pump-to-wheel avoided greenhouse gas emissions (thousands of metric tons of CO2eq) |
Pump-to-wheel avoided greenhouse gas emissions, by vehicle type |
Vehicle type |
1999–2012 (Thousands of metric tons of CO2eq) |
2013–2022 (Thousands of metric tons of CO2eq) |
1999–2022 (Thousands of metric tons of CO2eq) |
HEV |
6,893 |
6,873 |
13,766 |
PHEV |
41 |
288 |
329 |
EV |
55 |
310 |
366 |
Total |
6,989 |
7,471 |
14,461 |
The U.S. EPA’s Greenhouse Gas Equivalency Calculator was used to convert these estimates of CO2eq into everyday terms (U.S. EPA 2012b). The avoided 14.5 million metric tons of CO2eq emissions from throughout the life-cycle time series is the equivalent of:
• the GHG emissions from the electricity used by 2,164,827 homes for 1 year;
• the carbon sequestered annually by 11,853,313 acres of U.S. forests; and
• the annual CO2 emissions of 4.1 coal-fired power plants.
There are concerns that WtP emissions associated with the fuel source used for charging PHEV and EVs may cause a negative impact on the WtW, or total, GHG emissions. For example, CO2 emissions would be higher if the electricity fuel source for a vehicle was a coal-fired power plant rather than a natural gas plant. Thus, CO2 emissions in the WtP stage may be higher for a PHEV or EV than for an ICV and could increase GHG emissions. An assessment of the WtW stage avoided emissions for EDVs is in the appendix to this chapter.
WtW-avoided emissions of CO2eq for PHEVs and EVs were calculated to be lower than the PtW stage but still positive. Ultimately, when accounting for the substantial avoided emissions of CO2eq from HEVs, total WtW CO2eq EDV emissions are higher than the PtW stage. It is important to note that GHG emissions from the WtP stage could become a real concern as sales of PHEVs and EVs increase, highlighting the importance of complementing clean energy technology on the roads with clean energy technology in the generation of electricity.
Current efforts are underway to account for the economic impact of climate change damages such as declined agricultural productivity or property damages from extreme weather events (U.S. EPA 2012c). The retrospective values of the Social Cost of Carbon (SCC), for nonregulatory analysis purposes, are still in their early stages of development. For this study, reductions in GHG emissions are not monetized. However, for the future, units of CO2 and other GHG emissions may have monetary value based on social cost and/or CO2 mitigation policies.
Avoided air pollutant emissions
The avoidance of fossil fuel combustion from using EDVs also reduces the emissions of several non-GHG pollutants. These pollutants do not trap heat in the atmosphere; however, they contribute to ozone and particulate matter (PM) pollution, which can negatively affect air quality and thus human health (U.S. EPA 2012e).6 For example, when a vehicle emits VOC and NOx, these pollutants interact in the lower atmosphere to form ambient ozone, which in high levels can exacerbate existing respiratory illness (such as asthma) and over the long term may cause lung damage (U.S. EPA, 2000). This study estimated the avoided emissions of VOCs, NOx, PM smaller than or equal to 2.5 micrometers (PM2.5), sulfur dioxide (SO2), and ammonia (NH3) from the reduced gasoline combustion of EDVs.
The analyses herein look at societal impacts; however, it is important to note that the majority of EDVs are purchased and operated in urban environments where air quality improvements are needed the most.7 Because these impact estimates do not account for the higher marginal value of pollution abatement in urban areas where EDVs are most intensively used, they should be viewed as conservative lower bounds on actual impacts.
Emissions factors from the GREET model were used to determine avoided emissions in short tons. Similar to the GHG emissions calculated above, these emissions factors depend on vehicle type and model year; see Table 5.5. An estimate of NH3 was provided from the U.S. EPA (2013) MOVES2010b model for a ICV, and reductions in NH3 for EDVs were scaled based on the percentage reduction of VOCs (about 54 percent for HEVs) from the GREET model.
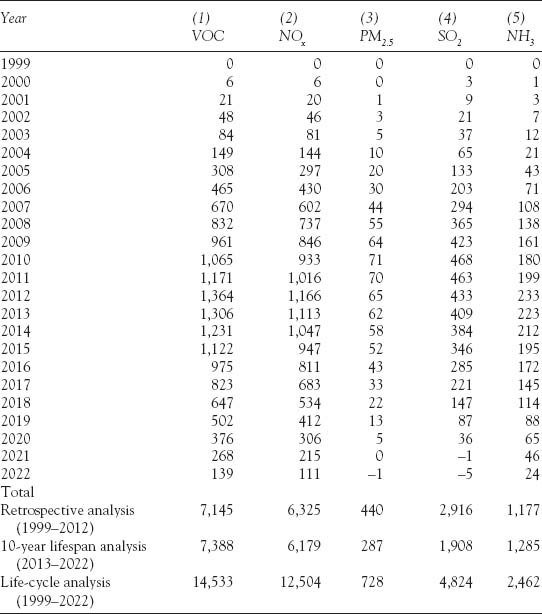
To determine the avoided emissions of air pollutants, the mileage estimates from Table 5.2 were multiplied by the difference in emissions between the appropriate vehicle type and the conventional ICV. Table 5.6 demonstrates the total avoided emissions of air pollutants from EDVs for the full life-cycle time series.
Pump-to-wheels air quality criteria pollutant emissions factors |
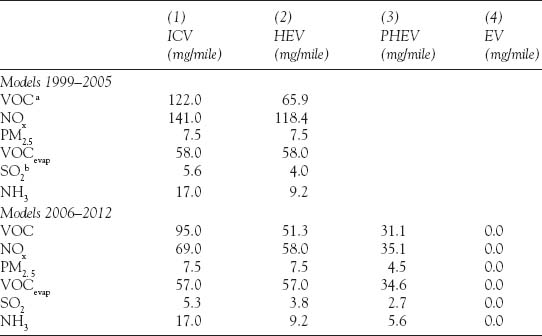
Source: Based on ANL (2012) and U.S. EPA (2013)
Notes
aVOC emissions were derived from two sources: the emissions from vehicle exhaust and from the evaporation of gasoline in the fuel system (U.S. EPA 2000). These emissions are listed separately in this table and then are combined for an estimate of total avoided VOC emissions in subsequent tables.
bEmissions factors for SOx were used as a proxy for SO2 as for most combustion processes in GREET. SOx is nearly 100 percent SO2.
Pump-to-wheel avoided air quality criteria pollutant emissions from EDVs, 1999 through 2022 |
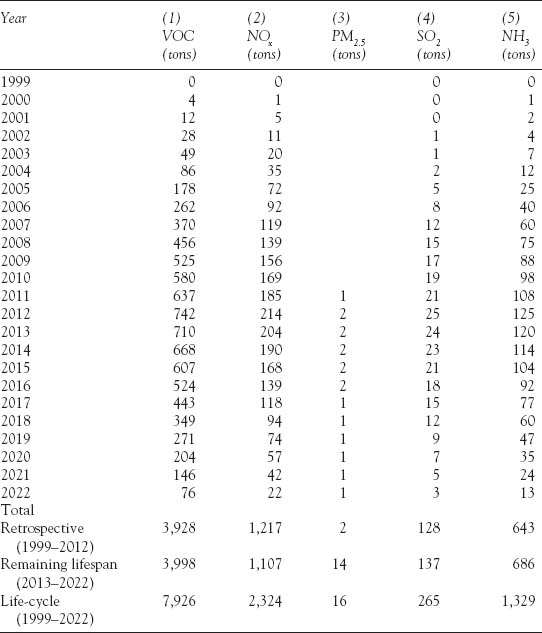
Note: Totals may not add precisely because of rounding.
Similar to GHG emissions, HEVs account for over 90 percent of the VOC, NOx, SO2, and NH3 avoided emissions. As with GHG emissions as discussed above, there are concerns that the WtP emissions associated with the fuel source used for charging PHEVs and EVs may cause there to be a negative impact on the WtW, or total, emissions of these air quality pollutants. For example, if the electricity fuel source is a coal-fired power plant, then SO2 emissions in the WtP stage may be higher for a PHEV or EV than a conventional ICV and could increase overall emissions.
An assessment of the WtW stage avoided emissions for EDVs can be found in the appendix to this chapter. WtW emissions of SO2 and PM2.5 were found to increase from using PHEVs and EVs. This increase was offset by substantial declines in emissions of these pollutants from HEVs, resulting in a net reduction of emissions that was higher than the PtW stage. However, WtP emissions may become more of a concern as sales of PHEVs and EVs increase. Again, this highlights the need to complement clean energy technology on the roads with clean energy technology in the generation of electricity.
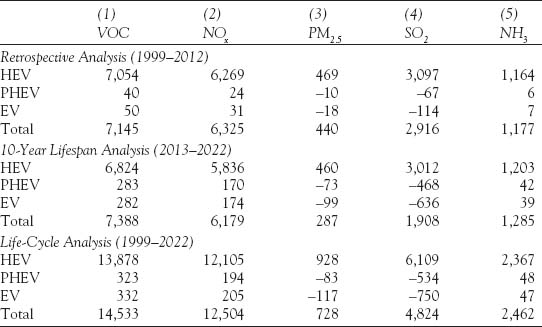
The majority of emissions reductions come in the form of VOC and NOx reductions with 7,926 and 2,324 short tons avoided, respectively, throughout the life-cycle time series.
Reductions in PM2.5 were small because only PHEVs and EVs were estimated to reduce PM2.5 emissions in the PtW stage. Table 5.7 displays the total avoided emissions by vehicle type for the retrospective, lifespan, and life-cycle time series.
Environmental health benefits
The COBRA model, developed by EPA, was used to value the avoided health impacts from the reductions in air quality pollutants from EDVs. The COBRA model converts inputs of emissions changes in several air pollutants into changes in health effects and calculates the economic value of these changes (EPA 2012d; O’Connor et al. 2013). A discussion of COBRA is also included in the appendix to this chapter.
Pump-to-wheels avoided air quality criteria pollutant emissions, by vehicle type |
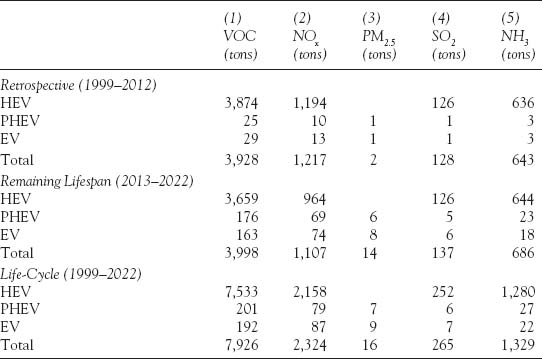
Note: Totals may not add precisely because of rounding.
COBRA’s estimates of health impacts and their value are based on projected air quality, population, and income in 2017. For each year, the PtW avoided emissions from Table 5.6 were inputs into the COBRA model. The number of health incidents for each year was scaled to reflect changes in the national resident population based on U.S. Census estimates through 2012. The resident population from 2013 through 2022 was estimated by applying the percentage changes in population from the 2013 Annual Energy Outlook to the 2012 population estimate from the U.S. Census.
Several valuation endpoints in COBRA, including the value placed on premature mortality, are adjusted over time based on projected changes in income and elasticity estimates for how willingness to pay for health outcomes will change with time. The 2017 value for health impacts was adjusted to the years in our analysis based on COBRA’s elasticity estimates and per capita real GDP changes based on BEA estimates through 2012. Income changes from 2013 through 2022 were estimated by applying the percentage changes in per capita real GDP from the 2013 Annual Energy Outlook to BEA’s 2012 per capita real GDP estimate.
Table 5.8 shows the avoided incidence, or the reduced number of health incidents, and their associated cost estimate by COBRA for 2012. The COBRA model produces high and low estimates of total health benefits based on two different sets of assumptions for the impact of ambient PM2.5 on adult mortality and nonfatal heart attacks. For adult mortality and nonfatal heart attacks, benefits or costs are expected to continue in future years, therefore COBRA calculates the present value for these endpoints using either a 3 percent or 7 percent discount rate. COBRA does not report undiscounted values.
Pump-to-wheels environmental health benefits associated with using EDVs, 2017 |
Health effect |
Avoided incidence |
Benefit (thousands of 2012$) |
Adult mortality (low) |
2.3 |
17,348 |
Adult mortality (high) |
6.0 |
44,589 |
Infant mortality |
0.0a |
43 |
Nonfatal heart attacks (low) |
0.3 |
34 |
Nonfatal heart attacks (high) |
2.6 |
316 |
Resp. hospital admissions |
0.9 |
26 |
Cardio-vascular (CDV) hospital admissions |
0.8 |
34 |
Acute bronchitis |
3.8 |
2 |
Upper respiratory symptoms |
68.4 |
5 |
Lower respiratory symptoms |
47.9 |
2 |
Asthma ER visits |
1.6 |
1 |
Minor restricted activity days (MRAD) |
2,114.6 |
147 |
Work loss days |
357.3 |
56 |
Asthma exacerbations |
71.9 |
8 |
Total health costs (2012$) |
17,706 (Low) 45,229 (High) |
Note
aThe COBRA model rounded the incidence value to zero from a very small value; however, because of the high monetary value associated with prolonging life, even a very small value produces some cost.
In 2012 alone, the health benefits associated with using EDVs are estimated to be between $17.7 and $45.0 million using a 7 percent discount rate. The majority of these benefits come from avoided mortality, estimated to be between $17.3 and $44.6 million. The full time series of environmental health benefits is presented in Table 5.9. Note that the low and high environmental health benefits from the COBRA model are presented in Table 5.9. The mean of the low and high values is used in the economic analysis in Chapter 6.
PtW stage health benefits totaled between approximately $88.2 and $225.3 million for the retrospective time series and between $192.0 and $490.6 million for the life-cycle time series. An assessment of WtW health benefits is presented for reference in an appendix to this chapter.
Energy security benefits
The reduced consumption of gasoline from using EDVs not only reduces GHG and air quality pollutant emissions, but can also provide energy security benefits. Avoided fuel consumption can lead to a reduced demand for foreign oil importation, which may lessen the risk of oil disruptions and price shocks that could threaten the U.S. economy, environment, and national security.
To measure energy security benefits, we calculated the number of barrels of foreign oil avoided across the time series; see Table 5.10. The assumption in this time series is that each marginal barrel of oil is sourced from the same export nations as the total volume of imported crude oil.
From 1999 to 2012, approximately 27.2 million barrels of foreign oil were avoided from using EDVs. Accounting for the full life cycle of these vehicles, this study estimates a total of 47.8 million barrels of foreign oil will be avoided by 2022. These energy security benefits are not included in the economic analysis of this study because no consensus estimates of a so-called oil importation premium exist to monetize energy security benefits.
Pump-to-wheels time series of environmental health benefits associated with using EDVs, 1999 through 2022 |
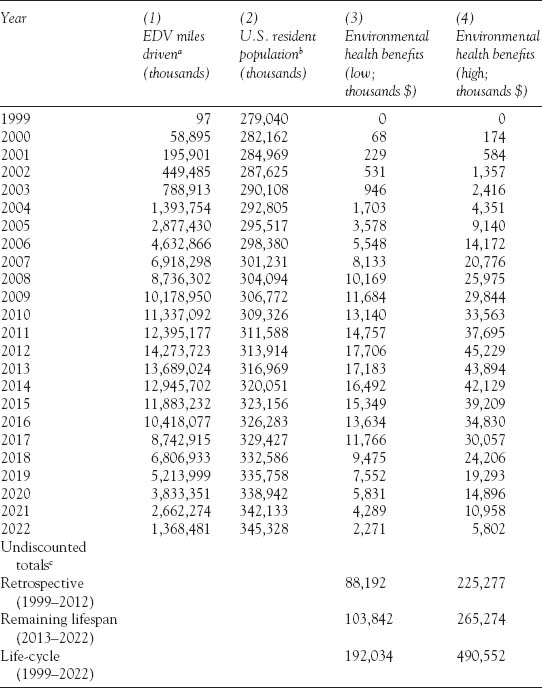
Notes
aSum of all columns in Table 5.3.
bSources: 1999 through 2012 estimates from U.S. Census Bureau (2004, 2011, 2013). 2013 through 2022 based on percentage changes in population projected in the 2013 Annual Energy Outlook (U.S. Energy Information Administration 2013).
cThe COBRA model applied a 7 percent discount rate to the stream of benefits associated with the emissions reduction in each year. Totals are undiscounted in the sense that no further discounting is applied here.
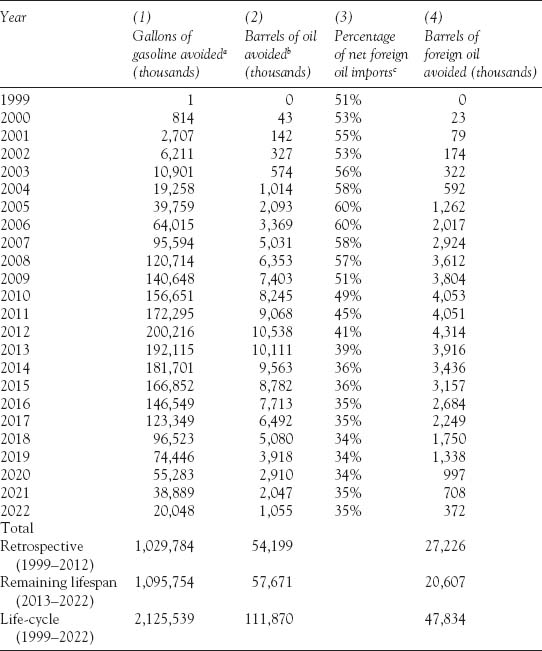
Notes
aColumn 7 from Table 4.11.
bAccording to the U.S. EIA (2012b), on average, 19 gallons of motor gasoline can be yielded from 1 barrel of oil.
cSource: Based on U.S. EIA (2012a).
Appendix 5.1: Assessment of avoided emissions and overview of the COBRA model
WtW-avoided emissions
The WtW analysis accounts for emissions from feedstock and the distribution of fuel (WtP) in addition to those emissions from operating the vehicle (PtW). Although the emissions factors are different for the WtW analysis, avoided emissions were calculated in the same manner as the PtW analysis in Chapter 5. For energy security benefits, only PtW avoided barrels of foreign oil were calculated. See Table A5.1, Figure A5.1, and Tables A5.2 through A5.5.

Source: Based on ANL (2012).
WtW-avoided GHG emissions (thousands of metric tons of CO2eq) |
WtW-avoided GHG emissions by vehicle type (thousands of metric tons of CO2eq) |
Vehicle type |
Retrospective |
Lifespan |
Life cycle |
HEV |
9,198 |
9,159 |
18,358 |
PHEV |
24 |
169 |
193 |
EV |
25 |
138 |
163 |
Total |
9,247 |
9,466 |
18,714 |
WtW air quality criteria pollutant emissions factors (mg/mile) |
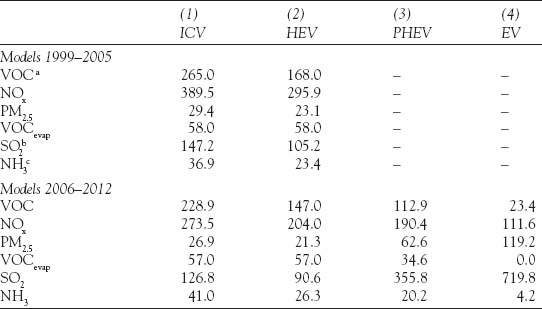
Sources: Based on ANL (2012) and U.S. EPA (2013).
Notes
aVOC emissions were derived from two sources: the emissions from vehicle exhaust and from the evaporation of gasoline in the fuel system (U.S. EPA 2000). These emissions are listed separately in this table and then are combined for an estimate of total avoided VOC emissions in subsequent tables.
bEmissions factors for SOx were used as a proxy for SO2 as for most combustion processes in GREET. SOx is nearly 100 percent of SO2.
cNH3 WtW emissions for GV were scaled based on the percentage increase of VOC emissions from PtW to WtW. EDV reductions in NH3 were scaled based on the percentage reduction of VOCs.
Overview of the COBRA model
The COBRA model provides estimates of health effect impacts and the economic value of these impacts resulting from emission changes. The COBRA model was developed by the U.S. EPA to be used as a screening tool that enables users to obtain a first-order approximation of benefits due to different air pollution mitigation policies.
WtW-avoided air quality criteria pollutant emissions from EDVs (short tons), 1999 through 2022 |
At the core of the COBRA model is a source-receptor (S-R) matrix that translates changes in emissions to changes in PM concentrations. The changes in ambient PM concentrations are then linked to changes in mortality risk and changes in health incidents that lead to health care costs and/or lost workdays (O’Connor et al., 2013). Figure A5.2 provides an overview of the modeling steps.
Changes in emission → changes in ambient PM concentrations
The user provides changes (decreases) in emissions of pollutants (PM2.5, SO2, NOx, VOCs, NH3) and identifies the economic sector from which the emissions are being reduced. These changes are in total short tons of pollutants by sector for the U.S. economy for the chosen analysis year. The economic sectors chosen determine the underlying spatial distribution of emissions and hence the characteristics of the human population that is affected.8 For example, emissions reductions due to the use of EDVs are typically applied to light-duty gasoline vehicles. The S-R matrix consists of fixed transfer coefficients that reflect the relationship between annual average PM2.5 concentration values at a single receptor in each county (a hypothetical monitor located at the county centroid) and the contribution by PM2.5 species to this concentration from each emission source. This matrix provides quick but rough estimates of the impact of emission changes on ambient PM2.5 levels as compared with the detailed estimates provided by more sophisticated air quality models (U.S. EPA, 2012d).
WtW-avoided air quality criteria pollutant emissions, by vehicle type (short tons) |
Note: Values may not add because of rounding.
COBRA model overview |
Source: Based on U.S. EPA (2012d).
hanges in ambient PM concentrations → changes in health effects
The model then translates the changes in ambient PM concentration to changes in incidence of human health effects using a range of health impact functions and estimated baseline incidence rates for each health endpoint. The data used to estimate baseline incidence rates and the health impact functions used vary across the different health endpoints. To be consistent with prior U.S. EPA analyses, the health impact functions and the unit economic value used in COBRA are the same as the ones used for the Mercury and Air Toxics Standards (MATS) Final Rule (U.S. EPA, 2012d). The U.S. population estimates are based on projections from Woods and Poole (2011).
The model provides (in the form of a table or map) changes in the number of cases for each health effect between the baseline emissions scenario (included in the model) and the analysis scenario. The different health endpoints are included in Table A5.6.
Each health effect is described briefly below. For additional detail on the epidemiological studies, functional forms, and coefficients used in COBRA; see Appendix C of the COBRA user’s manual (U.S. EPA 2012d).
Health effect |
Description |
Mortality |
Number of deaths (adult or infant) |
Acute bronchitis |
Cases of acute bronchitis |
Nonfatal heart attacks |
Number of nonfatal heart attacks |
Respiratory hospital admissions |
Number of cardiopulmonary-, asthma-, or pneumonia-related hospitalizations |
CDV-related hospital admissions |
Number of cardiovascular-related hospitalizations |
Upper respiratory symptoms |
Episodes of upper respiratory symptoms (runny or stuffy nose; wet cough; and burning, aching, or red eyes) |
Lower respiratory symptoms |
Episodes of lower respiratory symptoms: cough, chest pain, phlegm, or wheeze |
Asthma emergency room visits |
Number of asthma-related emergency room visits |
MRAD |
Number of minor restricted activity days (days on which activity is reduced but not severely restricted; missing work or being confined to bed is too severe to be MRAD) |
Work loss days |
Number of work days lost due to illness |
Asthma exacerbations |
Number of episodes with cough, shortness of breath, wheeze, and upper respiratory symptoms in asthmatic children |
Mortality researchers have linked both short-term and long-term exposures to ambient levels of air pollution to increased risk of premature mortality. COBRA uses mortality risk estimates from an epidemiological study of the American Cancer Society cohort conducted by Krewski et al. (2009) and by a Six-City cohort by Laden et al. (2006). These two studies provide a high and low estimate of mortality associated with changes in ambient PM2.5. COBRA includes different mortality risk estimates for both adults and infants. Infant mortality is based on Woodruff et al. (1997). Because of the high monetary value associated with prolonging life, mortality risk reduction is consistently the largest health endpoint valued in the study.
Nonfatal heart attacks were linked by Peters et al. (2001) to PM exposure. Nonfatal heart attacks were modeled separately from hospital admissions because of their lasting impact on long-term health care costs and earning. COBRA provides a high and low estimate of incidence for nonfatal heart attacks based on differing literature.
Hospital admissions include two major categories: respiratory (such as pneumonia and asthma) and cardiovascular (such as heart failure, ischemic heart disease). Using detailed hospital admission and discharge records, Sheppard et al. (1999) investigated asthma hospital emissions associated with PM, CO, and ozone, and Moolgavkar (2000, 2003) found a relationship between hospital admissions and PM. COBRA includes separate risk factors for hospital admissions for people aged 18 to 64 and aged 65 and older.
Acute bronchitis, defined as coughing, chest discomfort, slight fever, and extreme tiredness lasting for a number of days, was found by Dockery et al. (1996) to be related to sulfates, particulate acidity, and, to a lesser extent, PM. COBRA estimates the episodes of acute bronchitis in children aged 8 to 12 from pollution using the findings from Dockery et al.
Upper respiratory symptoms include episodes of upper respiratory symptoms (runny or stuffy nose; wet cough; and burning, aching or red eyes). Pope et al. (2002) found a relationship between PM and the incidence of a range of minor symptoms, including runny or stuffy nose; wet cough, and burning; aching or red eyes.
Lower respiratory symptoms in COBRA are based on Schwarz and Neas (2000) and focus primarily on children’s exposure to pollution. Children were selected for the study based on indoor exposure to PM and other pollutants resulting from parental smoking and gas stoves. Episodes of lower respiratory symptoms are coughing, chest pain, phlegm, or wheezing.
Asthma related emergency room visits are primarily associated with children under the age of 18. Sheppard et al. (2003) found significant associations between asthma ER visits and PM and CO. To avoid double counting, hospitalization costs (discussed above) do not include the cost of admission to the emergency room.
Minor restricted activity days (MRAD) in COBRA were based on research by Ostro and Rothschild (1989). MRADs include days on which activity is reduced but not severely restricted (e.g., missing work or being confined to bed is too severe to be an MRAD). They estimated the incidence of MRADs for a national sample of the adult working population, aged 18 to 65, in metropolitan areas. Because their study is based on a convenience sample of nonelderly individuals, the impacts may be underestimated because the elderly are likely to be more susceptible to PM-related MRADs.
Work loss days were estimated by Ostro (1987) to be related to PM levels. Based on an annual national survey of people aged 18 to 65, Ostro found that 2-week average PM levels were significantly linked to work loss days. However, the findings showed some variability across years.
Asthma exacerbations estimates were pooled from Ostro et al. (2001) and Mar et al. (2004) to calculate impacts of changes in air quality on asthmatic children. Cough, wheeze, and shortness of breath are all considered to be exacerbations.
Changes in health effects → changes in monetary impacts
COBRA translates the health effects into changes in monetary impacts using estimated unit values of each health endpoint. The per-unit monetary values are described in Appendix F of the COBRA user’s manual (U.S. EPA 2012d). Estimation of the monetary unit values varies by the type of health effect. For example, reductions in the risk of premature mortality are monetized using value of statistical life estimates. Other endpoints such as hospital admissions use cost of illness units that include the hospital costs and lost wages of the individual but do not capture the social (personal) value of pain and suffering. COBRA allows users to choose between a discount rate of 3 percent or 7 percent to calculate the present value of health effects that may occur beyond the year 2017.
Limitations
It should be noted that COBRA does not incorporate effects of many pollutants, such as carbon emissions or mercury. This has two potential implications. First, other pollutants may cause or exacerbate health endpoints that are not included in COBRA. This would imply that reducing incidences of such health points are not captured. Second, pollutants other than those included in COBRA may also cause a higher number of incidences of the health effects that are part of the model. This is also not captured in this analysis. Thus, the economic value of health effects obtained from COBRA may be interpreted as a conservative estimate of the health benefits from reducing emissions.
Notes
1 This chapter draws from RTI International (2013), which was written by Sara Casey and Ross Loomis, previously at RTI International.
2 The full life of an EDV is assumed to be 11 years (Table 4.7). EDV sales were categorized by calendar year (January to December).
3 According to U.S. DOE (2013), over 95 percent of U.S. gasoline contains up to 10 percent ethanol, or E10.
4 Because PHEV and EVs were not introduced to the market until 2011, only the GREET 2010 model year estimates were used for these vehicle types. This assumption will account for the greater avoided reductions associated with early HEV models before the U.S. EPA’s regulations took effect on all vehicles.
5 Hydrofluorocarbons, perfluorocarbons, and sulfur hexafluoride are also considered GHGs. However, these are not directly associated with fossil fuel combustion and therefore are not included in this analysis.
6 Ozone and PM also affect the environment through reduced visibility, reduction in agricultural and forestry yields, increased acid deposition, and increased eutrophication and nitrification of surface waters (U.S. EPA 2000). For the purposes of this study, only the impacts on human health were monetized.
7 Huo et al. (2009) found that HEVs and EVs can reduce emissions compared with ICVs of VOC, NOx, and PM2.5 at a higher percentage in urban areas than when applied to a national model.
8 The COBRA model has a variety of spatial capabilities. However, for this study there was limited information on the specific location of pollution reductions. Thus, a national analysis was conducted where the national distribution of emissions was used to determine the emission location as input to the S-R matrix.