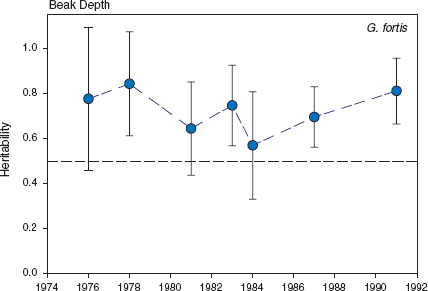
Fig. 3.1 Heritability (h2) of fortis beak depth in 1976, estimated from the slope of the regression of mid-offspring on mid-parent values. From Boag and Grant 1978 and Boag 1983, recalculated with additional measurements.
Heritable Variation
Quantitative genetics is concerned with the inheritance of those differences between individuals that are of degree rather than of kind, quantitative rather than qualitative. These are the individual differences which, as Darwin wrote, “afford materials for natural selection to act on and accumulate, in the same manner as man accumulates in any given direction individual differences in his domestic productions.”
(Falconer and Mackay 1995, p. 1)
The journey of populations through genetic space is intimately linked with the environment around them.
(Coen 2012, p. 278)
Introduction
FOR EVOLUTION TO OCCUR there must be heritable variation, so one of the first questions that arise from both the small size of fortis on Daphne and the evolutionary trajectory in figure 1.6 is how heritable are size traits? We addressed this question by using the methods of quantitative genetics to estimate heritable variation from degree of family resemblance. Many nests were found (box 3.1) and mapped (appendix 3.1), their owners (banded or not banded) were identified, nestlings were banded when they had reached a posthatching age of 8 days, and, sometime after they had fledged, they were captured in mist nets and measured (box 2.2). By capturing many young birds of different ages, we discovered they ceased growing at an age of about 60 days; therefore only birds of this age or older were included in subsequent analyses (Boag 1984). After the first two years we attempted to find every nest on the island (Millington and Grant 1984, Price 1984a, Grant and Grant 1996c).
We studied reproduction in every year for 16 years: 1976–91. We used maps to record nest locations (appendix 3.1). Most finches nest in Opuntia cactus bushes, with less than 5 percent nesting in Bursera trees or in Portulaca, Chamaesyce, and Sesuvium (perennial) plants close to the ground. Except for a couple of cactus bushes on a sea cliff in which finches may have nested, all nests were accessible at heights of less than 2.5 m. The goal was to determine clutch size, hatching success, and fledging success at every nest throughout each breeding season from 1978 to 1991; the coverage was approximately 50% in 1976, and only a few pairs of scandens bred in 1977. Nests were missed very rarely (Boag and Grant 1984b). As the study progressed, the fraction of breeding pairs that had been banded and measured increased to 99.5%; in early 1992 the last scandens, a male, was captured and banded, so at that time every adult of both species was identifiable. Nests were checked every 2–4 days, and nestlings were weighed and banded at day 8, counting the day of hatching as day 0. The first two broods produced in 1992 and 1993 were studied with complete coverage. In subsequent years breeding was monitored in an opportunistic way and for a shorter time, except that in 1998, a year of El Niño, breeding was studied again throughout the season (Grant et al. 2000).
Starting in 1988, we took a drop of blood for DNA analysis from the brachial vein of each finch, both adults and nestlings (fig. 2.13). In the absence of a buffer we developed our own method of storage with very good results. Samples were stored on EDTA-soaked filter paper in Drierite® in the field and at –80°C in the laboratory, and they yielded high-quality DNA. A decade later it became possible to use these samples to identify parentage unambiguously with 16 microsatellite DNA markers (Petren 1998). Our identification of mothers by observations at nests was confirmed in all cases, but paternity was sometimes misidentified by observation. The 1988 and subsequent samples were dominated by birds hatched in 1987, but there were some old birds among them, including one that had hatched in 1975! Most offspring of known (genotyped) parents in our samples hatched in 1991.
This chapter explains how we estimated the genetic component of phenotypic variation in body-size and beak-size traits, and what we found after taking into account possible biases in the estimates that arise from misidentified paternity due to extra-pair mating, maternal effects, and correlations between genotypes and environments. The overall conclusion we reach is that a large fraction of the measurable variation can be attributed to genetic factors: all morphological traits are highly heritable. This applies to both fortis and scandens, although there are small differences between them. Therefore both species on Daphne possess a strong potential for evolution in all size traits.
Estimating Heritable Variation
A phenotypic trait is heritable to the degree that measured variation in the trait reflects variation in genotype. Family members are genetically more similar to each other than to nonfamily members. This fact is used to estimate the amount of phenotypic variation that can be attributed to the additive effects of genes. In formal terms the heritability (h2) of a trait in the narrow sense is the additive genetic variance (Va) as a proportion of the phenotypic variance (Vp): h2 = Va/Vp. In practical terms it is estimated most simply by regressing measurements of offspring on the average of the measurements of their two parents. If there is no genetic component to the phenotypic variance, the slope will be 0. The theoretical maximum is 1.0. Most studies of morphological variation in birds find values between 0 and 0.5, sometimes higher (Grant and Grant 2000a, Merilä and Sheldon 2001). There are more statistically refined ways of estimating heritable variation by taking into account genetic effects from relatives other than parents when extensive pedigrees are available, and by estimating and excluding certain sources of environmental variation (reviewed in Kruuk et al. 2008). These give greater precision to the estimates, but even if only one parent is known, an estimate can be obtained by doubling the slope of the regression of offspring on single-parent measurements (Falconer and Mackay 1995, Lynch and Walsh 1998). The main caveat in all these studies of natural populations is the estimates may be biased by uncontrolled factors. For example, heritability estimates may be inflated as a result of parents and offspring growing up in similar environments that affect their final sizes, with different families experiencing different environments (genotype × environment correlations).
Heritable Variation
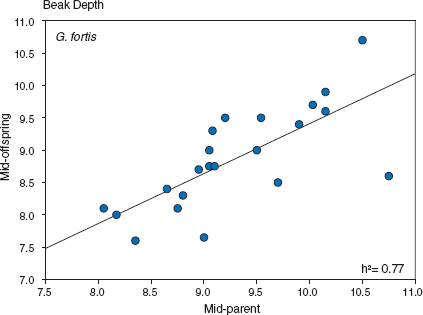
Our first estimates of heritabilities were remarkably high (fig. 3.1); in fact some of them were statistically indistinguishable from 1.0 (Boag and Grant 1978, Boag 1983). However, the standard errors of the estimates were also large. Sampling variance is large because our samples were relatively small and not because of unreliability in the measurements. In fact measurements of beak traits were highly repeatable (table 3.1, appendix 3.2). We minimized effects of measurement error by averaging repeated measurements of the same bird taken at different times.
The high heritability estimates were confirmed in a follow-up study in 1978 (Boag 1983). The slopes of regressions of offspring on mid-parent values in 1976 and 1978 were almost identical (Boag 1983), despite a strong difference in rearing conditions. Finches bred at high density and produced one brood in 1976, and bred at low density and produced three broods in 1978. Offspring that hatched in 1978 were closer in size to their parents, on average, than were the 1976 offspring, suggesting density-dependent suppression of growth in 1976: slower, incomplete, or earlier cessation. The fact that the regression slopes were identical in years of different conditions shows that large adult size is not a conspicuous function of the particular rearing environment experienced during growth (genotype × environment interactions). Growth is stunted when conditions are poorer than in 1976, but then the offspring do not survive long enough to be caught and measured as adults (Price 1985) and therefore do not enter the analysis.
We estimated heritabilities from five more years of breeding (1981, 1983, 1984, 1987, and 1991). Number of families ranged from 51 in 1981 to 101 in 1987, and number of offspring varied from 99 in 1981 to 467 in 1987 (Grant and Grant 2000a). The two main results were (a) beak trait heritabilities exceeded those for body-size traits, and (b) for beak depth the estimates were equal to or greater than 0.50 in all seven years (fig. 3.2). Relatively little annual variation in the estimates means relatively little influence of annual variation in growth conditions.
Our overall conclusion is there is substantial genetic variation in all six traits. It supports the hypothesis of evolutionary change of morphological traits on Daphne. However, heritability estimates may be biased, and possible biases need to be examined before the conclusion can be considered secure.
Fig. 3.1 Heritability (h2) of fortis beak depth in 1976, estimated from the slope of the regression of mid-offspring on mid-parent values. From Boag and Grant 1978 and Boag 1983, recalculated with additional measurements.
TABLE 3.1
Repeatabilities: the degree to which repeated measurements of the same individual are the same, as assessed by analysis of variance (Lessells and Boag 1987)
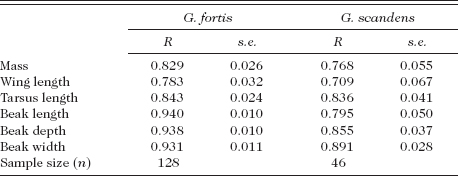
Note: Body-size traits have lower repeatabilities (R) than beak-size traits, due to inherently higher measurement error and higher variation within an individual over time; wing feathers abrade and are replaced, and body mass fluctuates daily and seasonally. Measurement error, as a proportion of the phenotypic variance, is 0.06–0.21 for fortis traits and 0.11–0.29 for scandens traits (Grant and Grant 1994). Abbreviation: s.e. is standard error of the repeatability estimate. Changes from first to second year only are illustrated in fig. A.3.2.
Fig. 3.2 Consistency in the estimates of fortis heritability of beak depth. Vertical bars show 95% confidence limits on estimates from offspring mid-parent regressions. The estimates have not been corrected for extra-pair young. From Grant and Grant 2000a.
Potential Biases
High heritabilities may be more apparent than real. Bias can result from similar environments being experienced by parents and offspring during growth, which would increase the estimate, by extra-pair paternity, which would decrease it, and by maternal effects, which could do either. We consider each of these in turn.
EXTRA-PAIR PATERNITY
Initially we believed that pairs were socially monogamous and rarely bigamous, since we saw no extra-pair copulations. Only later, in 1999, did it become possible to identify paternity unambiguously (box 3.1) with the development of 16 microsatellite DNA markers (Petren 1998). And we learned that our initial supposition was wrong! Most offspring of known parents in our samples hatched in 1991. These yielded estimates of 19.7% extra-pair young (EPY) out of a total of 223 genotyped fortis offspring, and 35.5% of 93 families with at least one EPY (Keller et al. 2001). Pooling all data from all years gave us an overall estimate of 17.1% EPY (Grant and Grant 2011a). In the total sample there were only two indications of incorrect identification of the mother, and they were ignored because they could have been recording errors.
MISIDENTIFIED PATERNITY
Most offspring and their parents were measured at an age of approximately one year. We calculated heritabilities for the six measured traits after correcting for extra-pair paternity. Because all six traits are positively correlated with each other, we used principal components analysis to find linear combinations of the traits that best summarize their variation and covariation along fewer uncorrelated axes. We did this for the three body-size measures (weight, wing, and tarsus) and separately for the three beak-size measures. In the first analysis PC1-body is a measure of size and PC2-body is a measure of proportions: weight and wing in relation to tarsus. In the second analysis PC1-beak is a measure of beak size, and PC2-beak is a measure of shape: depth and width in relation to length.
The effect of EPY on heritability estimates can be assessed from calculations with and without them. Because family sizes varied from 1 to 9 young, we used a family weighting technique in the calculations and standardized the variables to a mean of 0 and variance of 1.0 prior to analysis to eliminate small differences in either mean or variance between sexes. Excluding all extra-pair young resulted in a 21% increase in heritability of PC1-beak from the mid-parent regression alone, and an average of 21% for the four PC traits together. Effects of EPY on heritability estimates for the individual traits contributing to the PCs were sometimes larger, and varied in proportion to how different social and extra-pair fathers were in those traits (Keller et al. 2001).
MATERNAL EFFECTS
After removing all extra-pair young from the analyses, mother-offspring resemblance still exceeded father-offspring resemblance at PC1-beak and PC1-body by 19% and 23% respectively (Keller et al. 2001). This is one indication of maternal effects on adult size; however, neither difference was statistically significant. By restricting attention to just those offspring produced in 1991 by parents that hatched in 1987, because this was the only cohort of sufficient size for analysis, we found the mother-offspring regression for PC1-beak exceeded (significantly) the father-offspring regression by 41% after we removed extra-pair young. By adopting the same procedure for grandparental regressions we found, after excluding EPY, that maternal grandmother regressions for PC1-body were significantly larger than paternal grandmother regressions. For the other PCs there was no difference, and hence no evidence of maternal effects. Thus there are three indications of maternal effects, but the evidence is inconsistent and their magnitude has not been well estimated. We consider misidentified paternity to be a more serious problem in the estimation of heritable variation than failing to take into account the possibility of maternal effects.
Our overall conclusion is there are substantial extra-pair young effects but inconsistent evidence for maternal effects. After removal of EPY the revised heritabilities become 0.83 for beak size and 0.88 for beak shape. These values are much higher than in other studies (Grant and Grant 2000a, Merilä and Sheldon 2001) but comparable to human height heritability (Visscher 2008). They could result from higher additive genetic variance, lower environmental variance, or some combination. The phenotypic variance is large in this population (Grant et al. 1985); therefore, assuming environmental variances to be similar, elevated genetic variance is the probable cause of the high heritabilities.
GENOTYPE × ENVIRONMENT CORRELATIONS
If one part of the island is richer in food supply and better for rearing young than others, the young there might reach large size, survive well, obtain better territories in the same areas, and rear large offspring. Contrariwise, small parents may raise small offspring on poor territories. Continuation of this tendency from generation to generation would yield a resemblance between parents and offspring at least in part for environmental reasons; they were both raised in food-rich or food-poor territories. Randomizing clutches among foster parents is a technique for breaking any such environment correlations in order to estimate the magnitude of their effects, but experiments like this are understandably not permitted in the Galápagos National Park.
There is some evidence that parents do breed in the same habitat in which they were raised. We know the natal and breeding locations of 962 fortis and 304 scandens. Most of these birds hatched from nests on the outer slope: 56.4% of the fortis sample and 59.5% of the scandens. The species were similar in where the rest were hatched: on the inner slope (22.4% and 23.4%) and plateau (21.2% and 17.1%) respectively. These proportions are the basis for expecting in a 2 × 3 contingency χ2 test what fraction of the samples should breed in each habitat. Males and females were combined because they do not disperse different distances, in either species (Krakower 1996). A disproportionate number of G. fortis that hatched on the inner slope bred there (48.9%), twice as many as expected (22.4%; χ12 = 30.19, p < 0.0001). Similarly a disproportionate number that hatched on the outer slope bred there (68.9%; χ12 = 18.38, p < 0.0001). Males and females contributed roughly equally to these results. There was no tendency for plateau birds to breed on the plateau, and no tendency for G. scandens to breed in their natal habitats more often than expected by chance (all p values > 0.1).
These associations could give biased heritability estimates if fortis adult size varied systematically across the three habitats (fig. 1.4); they did differ in some size traits according to where they hatched. We tested for differences in size between habitats by two-way analysis of variance (ANOVA), including sex as a factor because males are larger than females on average. After the sex difference was removed, there were no significant differences between habitats in any of the PC indices of size and shape, nor were there any differences within each of the habitats between those that bred in their natal habitat and those that bred in another one (all p > 0.1).
CONCLUSIONS ON BIAS
We found substantial extra-pair young effects upon heritability estimates, inconsistent evidence for maternal effects, and no evidence that the estimates are inflated by genotype × environment correlations. Two other pieces of information support the last conclusion. First, regressions of extra-pair young on their apparent, social (cuckolded) fathers were all small and nonsignificant, indicating little or no inflation from common environment effects (Keller et al. 2001). Second, experimental manipulation of clutches in seven studies of birds elsewhere all failed to find an effect of foster-rearing environment on adult size (Grant and Grant 2000a).
Heritabilities: A Comparison of Species
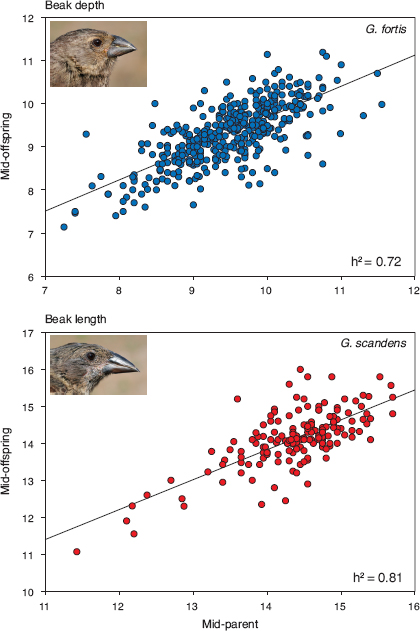
Given these findings, we asked if high heritabilities are solely a feature of fortis or if they apply to other species as well. Specifically, can the absence of an evolutionary trend in scandens beak depth (fig. 1.7) be explained by lack of genetic variation? The answer is no. G. scandens heritabilities were estimated in three years when family sizes exceeded 20 (Grant and Grant 2000a): in 1981 (n = 37), 1983 (n = 68), and 1987 (n = 25) but before we were able to identify EPY. Heritability estimates for the six traits uncorrected for EPY averaged 0.53, which is lower than an average of 0.70 for fortis (table 3.2, fig. 3.3). For beak depth, the trait shown in figure 1.7, the heritability estimate is 0.55 (table 3.2). Heritabilities for scandens traits corrected for EPY should be almost the same as the uncorrected ones (Keller et al. 2001), because EPY rate for this species is only 8%–10% (Petren et al. 1999a, Grant and Grant 2011a).
Heritabilities (h2) with standard errors (s.e.) for fortis and scandens on Daphne and G. conirostris on Genovesa
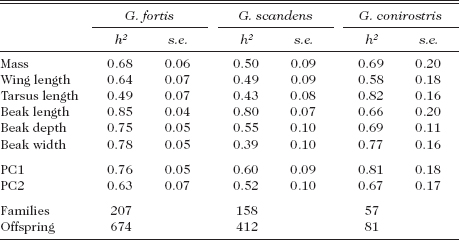
Note: PC1 and PC2 refer to the first two components of a principal components analysis of all six measured traits. Separate analyses were performed for each species and are roughly comparable because the loadings of the traits on the components were similar in the species. In each analysis all traits contribute approximately equally to PC1, which is therefore interpreted as a synthetic measure of body size. In all cases PC2 has a beak-shape element, with contributions of beak depth and width being approximately equal and having opposite sign to those from beak length. In all analyses PC1 statistically accounts for 60%–70% of the variance, and PC2 for an additional 11%–12%. Note that other principal components analyses referred to in this chapter were restricted to three body-size traits or three beak-size traits (pp. 64–65). From Grant and Grant 2000a.
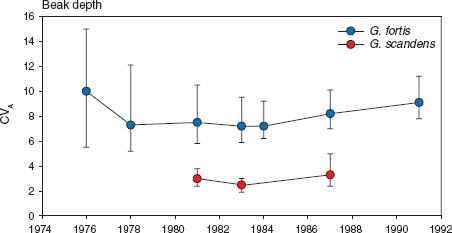
G. scandens differs from fortis in another respect. Heritability of beak length is consistently higher than heritability of depth and width in scandens, whereas in fortis all three heritabilities are approximately equal in magnitude. Since the two species differ in the average size of most traits, we compared them after standardization by using the coefficient of additive genetic variation, which is the square root of the additive genetic variance divided by the mean (Grant and Price 1981, Houle 1992). It is a comparative measure of “evolvability” (Houle 1992, Garcia-Gonzalez et al. 2012). G. fortis is both genetically and phenotypically more variable than scandens, especially in mass and beak dimensions, less so in wing and tarsus (table 3.3). Expressed another way, the difference in phenotypic variation between the species reflects an underlying genetic difference (fig. 3.4).
Fig. 3.3 Family resemblance indicates strongly heritable variation in ecologically most important beak dimensions of fortis and scandens on Daphne; from the combined samples of measurements in all years, and not corrected for extra-pair young or for unequal family sizes. G. fortis families (n = 413) comprised 1,106 offspring, 1–13 per family, and scandens families (n = 159) comprised 335 offspring, 1–11 per family. From Grant and Grant 2000a.
Coefficients of phenotypic (CVP), additive genetic (CVA) and residual, mainly environmental (CVE) variation allow comparison of the six measured traits of scandens (158 families) and fortis (207 families)
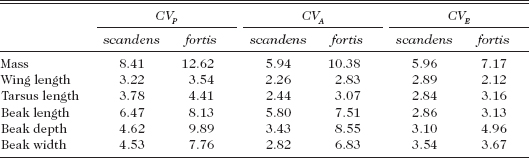
Note: All coefficients have been multiplied by 100. From Grant and Grant 2000a.
The difference between species in heritabilities is expected from the larger breeding population size of fortis than scandens, since heritabilities scale positively with effective population size (Lynch and Hill 1986, Houle 1989). However, the magnitudes of the heritabilities are surprisingly high for the small populations of these two species; theoretically they should be in the region of 0.25 when mutation is the sole source of new genetic variation (Houle 1989, Caballero and Keightley 1994). We consider possible explanations in chapter 8.
The combined results stimulated an analysis of heritable variation in a third species, G. conirostris on Genovesa Island (Grant and Grant 1989). Heritabilities were found to be high, almost identical to those of fortis, and with the same average of 0.70. Therefore all three species of Darwin’s finches studied in detail have highly heritable morphological variation and therefore a strong potential for evolutionary change. Evolutionary change as a result of natural selection is the subject of the next chapter.
Fig. 3.4 Equilibrial genetic variation in fortis and scandens beak depth. Estimated coefficients of additive genetic variation (CVA) are shown with 95% confidence limits. The limits are most asymmetrical where the sample size of families is lowest, as in 1976 for fortis (22 families). The estimates for scandens (2–4) are consistently lower than the estimates for fortis (7–10). Redrawn from Grant and Grant 2000a.
Summary
For evolution to occur there must be heritable variation. This chapter describes our attempts to estimate the magnitude of heritable variation of three body-size traits and three beak dimensions. Heritabilities were estimated from the slope of offspring mid-parent regressions, and found to be uniformly high (> 0.50) for fortis, especially those of the beak traits, and consistently so in seven cohorts. Misidentified paternity through extra-pair fertilization causes heritability estimates to be underestimated by this method. The frequency of extra-pair paternity was approximately 20%. When corrected for this bias the heritability of beak size is 0.83 and for beak shape it is 0.88. They are exceptionally high values for wild bird populations. The estimates may be inflated to an unknown but small extent by maternal effects on offspring size. We investigated a potential source of bias arising from correlations between genotypes and the environment. Although there is a tendency for fortis to breed in the same habitat in which they were raised, the size of adult traits does not vary systematically among habitats; therefore the bias is at most minor. G. scandens displays lower heritable variation than fortis, due to lower levels of additive genetic variation. The species are similar in one important respect: beak traits are more highly heritable than body-size traits, which is not surprising given the extra sources of environmental variation for body size (daily diet, body fat, etc.). We conclude there is substantial heritable variation in all traits of both species on Daphne, hence a strong potential for evolution.