© Jones & Bartlett Learning.
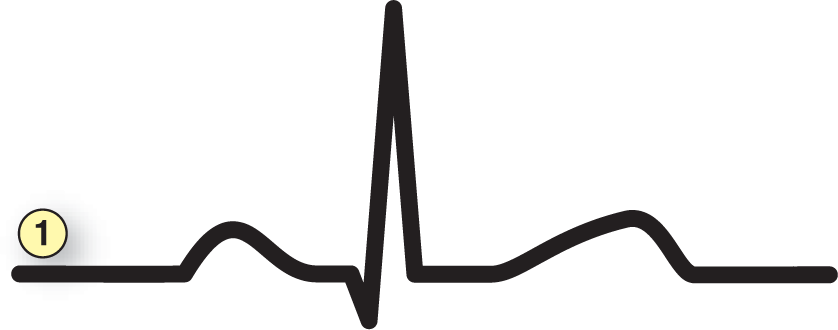
1. Is the Rhythm Fast or Slow?

© Jones & Bartlett Learning.
It should be simple enough for you at this point to calculate the rate, and you can review this information in Chapter 3, Paper, Tools, and Calculating Rates. But, just because calculating the rate is simple does not mean it is not useful or important. As we see in Table 40-1, it can quickly make a significant difference in the direction that you will head to figure out the rhythm in question.
Clinically, when you are calculating the rate, a variance of a few beats per minute will not have any significance. That is why, in this text, we have made it a point to say “about ___ BPM.” Does it really matter if you calculate the rhythm to be 85 BPM and it is actually 87 BPM? No—the main thing is to focus on whether the rhythm is slow, normal, or fast. However, for completeness, you should get used to calculating the rate as closely as possible to the true number. (Author’s note: The main decision points where accuracy is very important will be around the rates of 60 BPM and 100 BPM. In these two zones, the difference of a couple of beats per minute can make a difference in whether the rhythm is called a bradycardia or normal, or whether the rhythm will be called normal or tachycardic, respectively.)
The list of potential arrhythmias causing slow, normal, or fast ventricular responses is limited in each category (see Table 40-1). This single step will narrow down the list of potential arrhythmias dramatically and will let you concentrate your attention in a more focused manner.
Remember, you can have two separate rhythms on one strip. This can occur when there is a transition from one rhythm to another along the same strip or if there is AV dissociation or a third-degree heart block. When you are approaching an AV dissociation or a third-degree heart block, it is essential that you state the rate for the atrial component and the rate for the ventricular component separately.
2. Is the Rhythm Regular or Irregular?

© Jones & Bartlett Learning.
The real way that this question should be asked is as follows: Is the rhythm regular or irregular? If the rhythm is irregular, is it regularly irregular or irregularly irregular? As we have seen throughout the text, this question is essential to the interpretation of any arrhythmia. Once again, the differential diagnosis can be narrowed down greatly based on the answer to this one question (Table 40-2). Now, putting it together with the list derived from answering the previous question, your list of possible diagnoses should be getting smaller.
Table 40-2 Differential Diagnoses Based on the Regularity of the Ventricular Response
|
Regular |
Regularly Irregular |
Irregularly Irregular |
|
Normal sinus rhythm Sinus tachycardia Sinus bradycardia Ectopic atrial rhythm Focal atrial tachycardia Atrial flutter Junctional rhythm Accelerated junctional Junctional tachycardia AV nodal reentry tachycardia AV reentry tachycardia Idioventricular Accelerated idioventricular monomorphic VTach |
Sinus arrhythmia Premature complexes* • Atrial • Junctional • Ventricular Escape complexes* • Atrial • Junctional • Ventricular Atrial flutter with variable conduction Sinus pauses* Sinus blocks* Sinus arrest* |
Wandering atrial pacemaker Multifocal atrial tachycardia Atrial fibrillation Atrial flutter with variable conduction Polymorphic VTach Torsade de pointes |
*These are actually events but the strips are frequently considered to be regularly irregular.
© Jones & Bartlett Learning.
Regular rhythms typically have only one pacemaker setting the pace. Regularly irregular rhythms can have two or more pacemakers working simultaneously either due to escape mechanisms or due to increased automaticity or reentry. They are usually caused by events that break up the regularity of some other underlying rhythm rather than a rhythm in its own right. Irregularly irregular rhythms may have either three or more pacemakers and or pathologic transmission of the supraventricular impulses through the AV node.
Remember that there are essentially only three major irregularly irregular rhythms: wandering atrial pacemaker, multifocal atrial tachycardia, and atrial fibrillation. If you see P waves, it is either wandering atrial pacemaker or multifocal atrial tachycardia. If you do not see P waves, it is atrial fibrillation. (In atrial fibrillation, always remember to change leads to make sure that you are not dealing with an isoelectric lead for the P waves.) Can other rhythms be irregularly irregular? Yes, for example, atrial flutter with variable block, polymorphic VTach, and torsade de pointes can occasionally be irregularly irregular. But, these are uncommon rhythms. If you think of the big three, you will be right in a very, very large percentage of the cases.
5. Are the P Waves Upright in Lead II?
© Jones & Bartlett Learning.
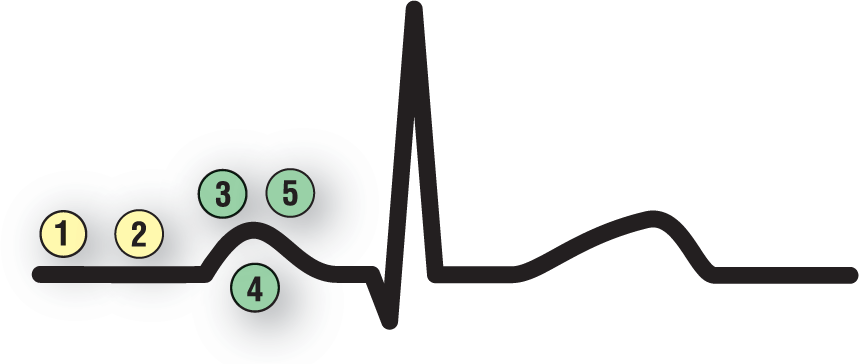
Dr. Henry J. L. Marriott asked his readers to “Cherchez le P,” which roughly translates to “look for the P wave.”1 We like stressing the same concept, but with a bit more emphasis. We like to say: Beat the P’s to death! You need to severely scrutinize each P wave for all of the information it contains. Notice that 4 questions out of these 10 are dedicated directly to the subject of P waves (questions 3, 4, 5, and 10). Why all the fuss? Because, as we have seen so far in the text, the P waves are probably the single most important thing to look for in the evaluation of any arrhythmia.
The presence of P waves before the QRS complexes indicates a supraventricular origin for the complex. The P waves could have been formed by the sinus node, an ectopic atrial pacemaker, or an AV junctional pacemaker, but they are always formed somewhere in the supraventricular area. (The only exception is in retrograde conduction of the impulse to the atria from an ectopic ventricular rhythms.) This bit of information will narrow down your differential diagnosis to the supraventricular rhythms (Table 40-3).
Table 40-3 Differential Diagnosis Based on the P Waves
|
P Wave Is Present and Upright |
P Wave Is Present but Inverted |
P Wave May Be Present but Inverted |
|
Normal sinus rhythm Sinus tachycardia Sinus bradycardia Sinus arrhythmia Ectopic atrial rhythm* Focal atrial tachycardia* Wandering atrial pacemaker* Multifocal atrial tachycardia* Premature atrial complexes* Escape atrial complexes* |
Ectopic atrial rhythm* Focal atrial tachycardia* Wandering atrial pacemaker* Multifocal atrial tachycardia* |
Junctional rhythm Accelerated junctional Junctional tachycardia AV nodal reentry tachycardia AV reentry tachycardia |
The AV blocks may be associated with either upright or inverted P waves depending on the underlying rhythm.
*P waves may be upright or inverted in these rhythms.
© Jones & Bartlett Learning.
P waves that originate in the sinus node will be positive in lead II. Inverted P waves, or P waves that are negative in lead II, are found in either ectopic P waves, junctional complexes, or retrograde conduction. The site of origin in inverted P waves can be further narrowed down when we look at the PR interval (question 6). Briefly stated, normal or prolonged PR intervals are associated with ectopic atrial P waves and short PR intervals are associated with junctional complexes.
The presence of different P-wave morphologies on the same strip will also assist you in making the diagnosis. If there are irregular, premature complexes with differing P-wave morphologies, you are dealing with PACs. If the beats in question arrive late in the cycle, you are dealing with atrial escape complexes. If you have more than three different morphologies, with differing PR intervals in an irregularly irregular rhythm, then you have either wandering atrial pacemaker or multifocal atrial tachycardia, depending on the underlying rate.
Sometimes it is critical to switch leads in order to obtain the most information about the P waves. In general, lead V1 is the best lead in which to study the P waves. However, your patient is an individual; so are his or her P waves. Your patient’s P waves may be best viewed in aVL or V5; you never know which is the best lead. That is the reason why, when you have questions about the morphology or the presence of P waves, you should obtain a full 12-lead ECG. Once you know the best lead to view the P waves, you can go back and get a longer rhythm strip from that particular lead if you need to. (Just keep in mind that inverted P waves can be normal in certain leads. In these cases, the P wave is not formed by ectopy but simply by the angle from which the lead is viewing the event.)
Look for buried P waves. We will spend much more time on this topic when we get to the question, Have I mined for gold?, but it is worthwhile to mention it here as well. The P waves can be buried anywhere, but usually are buried in the previous T wave.
Speaking of buried P waves, whenever the ventricular rate is 150 BPM, give or take a few beats, think about atrial flutter with 2:1 block. This association needs to become instinctual—you shouldn’t even have to think about it. When you see a heart rate of 150 BPM, look at the lead with the smallest QRS complexes and try to find some buried P waves.
6. Are the PR Intervals Normal and Consistent?

© Jones & Bartlett Learning.
The PR interval represents conduction through the atria and the electrical conduction system, including the AV node. As such, the PR interval provides us with a window into the functional state of that system. Measuring the PR interval should be an automatic part of your analysis of any rhythm strip. As we have discussed, the PR interval is measured from the beginning of the P wave to the beginning of the QRS complex, and can be either short, normal, or prolonged (Table 40-4).
Table 40-4 Differential Diagnosis of the Various PR Interval Lengths
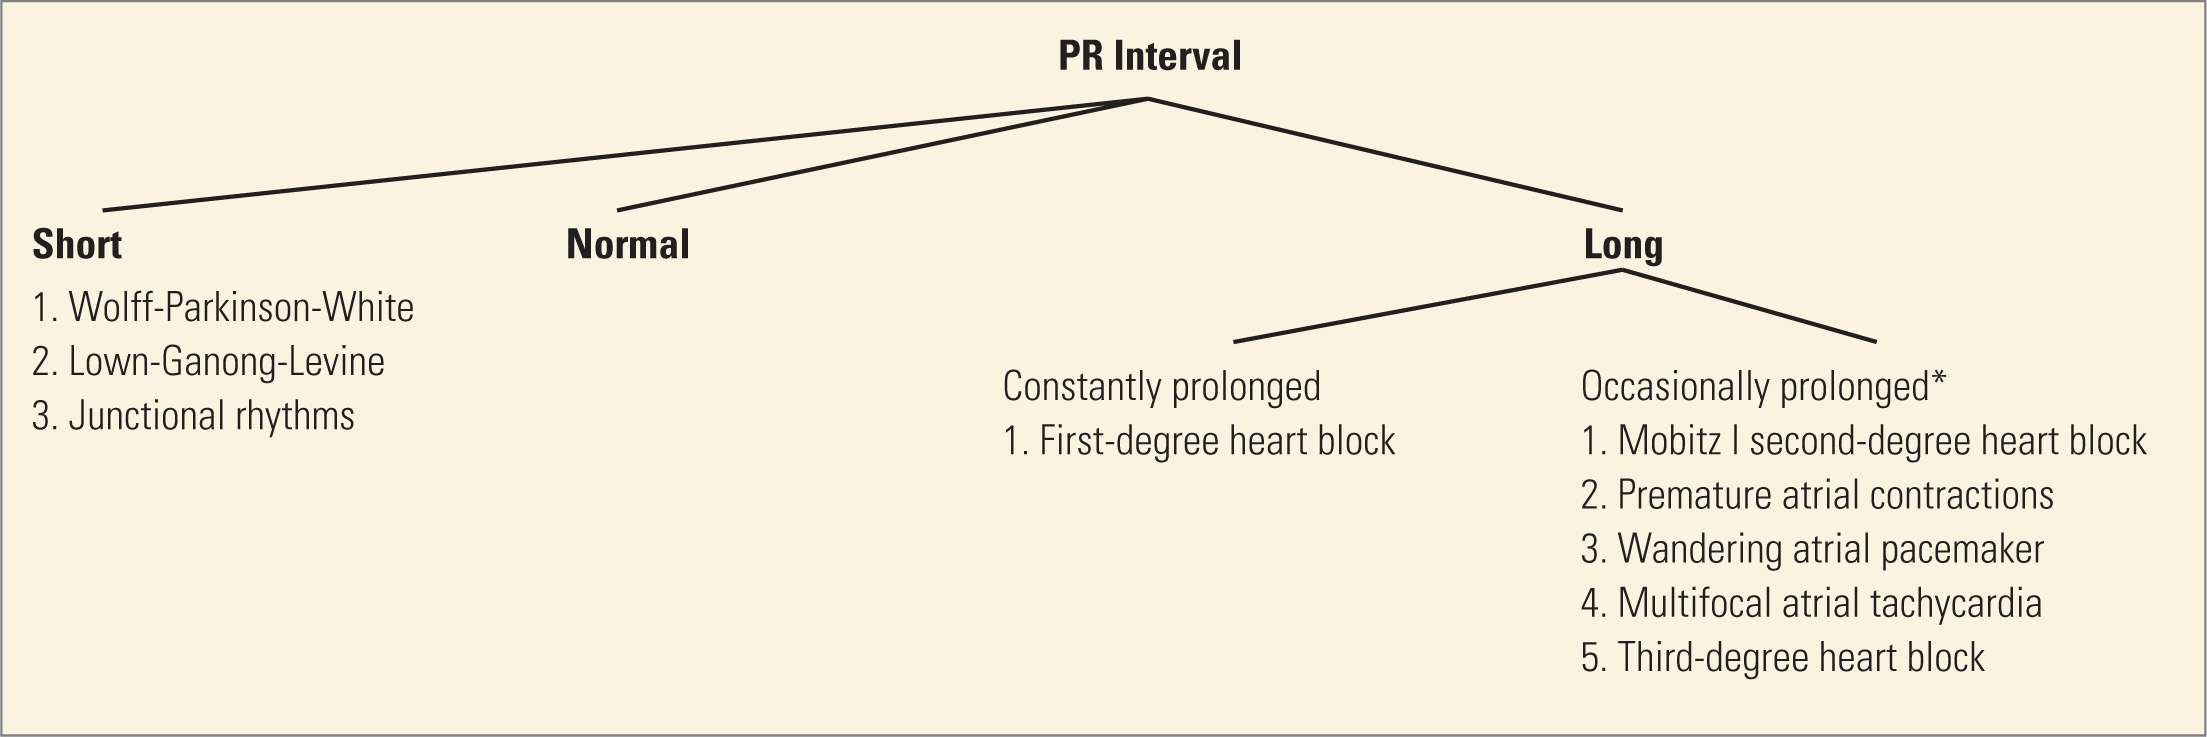
*Note that the occasionally prolonged PR intervals can be prolonged, normal, or short. They are placed under “Prolonged” here because the prolonged intervals are easier to diagnose.
© Jones & Bartlett Learning.
The normal PR interval is between 0.12 and 0.20 seconds. A normal PR interval is typically found in all of the sinus rhythms (normal sinus rhythm, sinus bradycardia, sinus tachycardia, and sinus arrhythmia). It can also be seen when an ectopic atrial pacemaker is at just the right distance from the AV node. The right distance is one that is neither too close nor too far from the AV node. If the ectopic pacemaker is too close to the AV node, the PR interval will be shorter because the impulse only has a short distance to travel before it reaches the AV node. If the ectopic pacemaker is too far from the AV node, the PR interval will be longer, reflecting the added distance that the impulse has to travel by direct cell-to-cell transmission in order to reach the AV node.
The PR interval is considered short if it is less than or equal to 0.11 seconds. A short PR interval can narrow down your differential into two major groups: The low ectopic atrials and the junctionals. As mentioned in the previously, an ectopic atrial pacemaker that is close to the AV node will result in an impulse that only has to travel a very short distance through the atria before reaching the AV node. An AV junctional pacemaker will trigger impulses in both the atria and the ventricles simultaneously, either greatly shortening the PR interval or not forming one at all.
Now, let’s start putting our PR intervals together with their P waves. You can have either upright or inverted P waves with a short PR interval. Upright P waves with short PR intervals are very rare and typically found in only two pathologic states: Lown-Ganong-Levine (LGL) syndrome and Wolff-Parkinson-White (WPW). LGL is a rare condition associated with short PR intervals, narrow QRS complexes, and episodes of tachycardia. LGL was originally thought to be due to a small bundle of cells that bypassed the section of the AV node responsible for the physiologic block known as the James fibers. However, electrophysiology has shown that this is not the case. Presently, the LGL syndrome is considered a variant of normal. WPW was covered in Chapter 26, AV Reentry Tachycardia. It is associated with short PR intervals, and QRS complexes that are wide due to fusion with the delta wave.
Inverted P waves with short PR intervals are associated with either very low ectopic atrial or junctional complexes. Distinguishing between these two requires invasive electrophysiologic studies, which are both costly and impractical. Differentiation cannot be accomplished using a simple surface ECG recording alone. For this reason, all complexes with inverted P waves and short PR intervals are considered to be junctional complexes. Normally, there are no major clinically significant problems encountered by making this assumption and it definitely makes our lives much, much simpler.
A prolonged PR interval (greater than 0.20 seconds) is the hallmark of a first-degree AV block. As we saw in Chapter 28, Atrioventricular Blocks, first-degree AV blocks are not really blocks but delays caused by AV nodal malfunction or disease. The delay in first-degree AV blocks does not have to occur exclusively in the AV node, but can actually occur anywhere along the ventricular portion of the electrical conduction system.
In Table 40-4, the prolonged PR intervals are broken down further into those that are either constantly prolonged (all of the PR intervals in the strip are prolonged) and those that are occasionally prolonged (some of the PR intervals in the strip are prolonged and some are normal).
© Jones & Bartlett Learning.
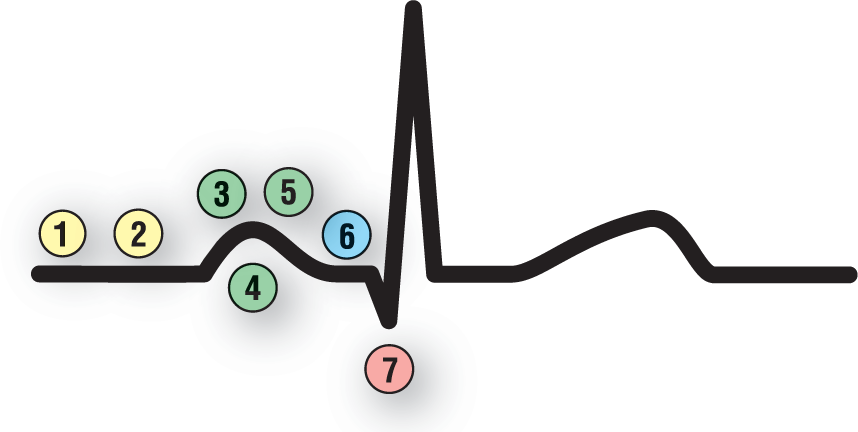
This question strikes at the heart of all the AV blocks. Normally, the P:QRS ratio is one to one because each supraventricular impulse (the P wave) causes only one ventricular depolarization (the QRS complex). When there are multiple P waves associated with only one QRS complex, you have the makings of an AV block of some sort.
The AV block can occur because of a normal physiologic response to a very fast supraventricular rate. In these cases, the supraventricular rates are so fast that, if they were conducted at a 1:1 ratio, the ventricles would be unable to function properly, causing hemodynamic compromise or maybe even cardiovascular collapse. For this reason, the AV node has a built-in safety feature that does not allow 1:1 conduction in those cases, essentially slowing down the ventricular response and protecting the heart. Examples of this type of functional block are found in focal atrial tachycardias (focal ATs) with block and atrial flutter.
The rate at which this functional AV block takes place is not written in stone. In some patients, it can occur when the supraventricular rates reach the mid to lower 200 BPM range. Typically, however, the block occurs in the upper 200s and especially at 300 BPM. The most common functional block is at a 2:1 ratio. This means that when the atrial rate is 300 BPM, the typical ventricular rate is 150 BPM. Keep this number foremost in your mind. As mentioned, the number 150 BPM should trigger a visceral response that makes you ask the question: Am I dealing with atrial flutter? You will be amazed at how often the answer is “yes!”
The AV block can also be pathologic, leading to either a second- or third-degree AV block. Different conduction ratios from 1:1 and grouping are the hallmarks for the second-degree AV blocks. Wenckebach or Mobitz I second-degree AV block is associated with an N:(N − 1) conduction ratio. This means that there will always be one more P wave than a QRS complex in each group. Mobitz II second-degree AV block is associated with dropped QRS complexes without any widening of the PR interval.
Finally, there can be a complete absence of conduction between the atria and the ventricles. This occurs when you have a third-degree or complete AV block. In these cases, the atria and the ventricles are simply beating to the pace set by their own drummer.
8. Are the QRS Complexes Narrow or Wide?
© Jones & Bartlett Learning.
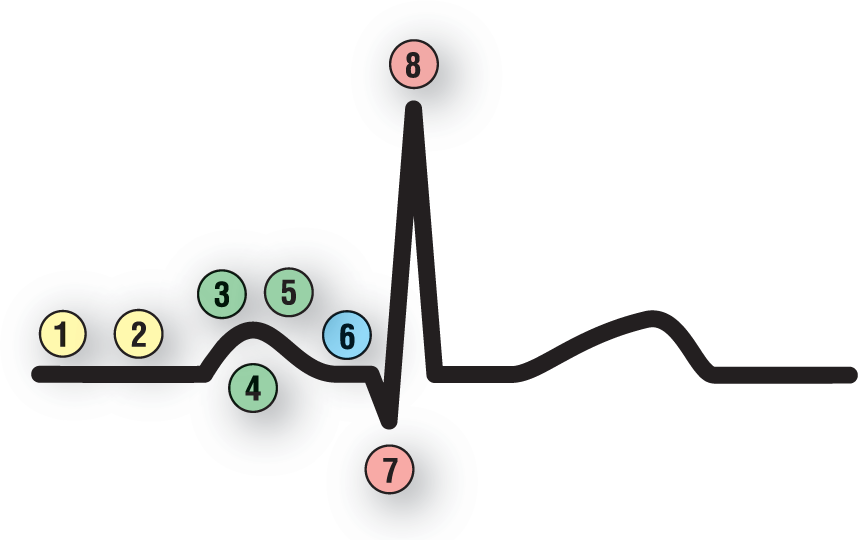
In general, supraventricular events and rhythms are narrow-complex (less than 0.12 seconds) and ventricular events and rhythms are wide-complex (greater than or equal to 0.12 seconds). There are, however, a few uncommon exceptions to this rule. To begin with, supraventricular complexes can be wide when they occur in patients with preexisting bundle branch blocks. They can also be wide when they are aberrantly conducted in the ventricles for whatever reason. They can also be wide when there are electrolyte abnormalities causing inappropriate biochemical conduction through the atria and the ventricles.
There are a couple of other things that will affect the morphology of the complexes and possibly cause them to appear abnormally wide. One of these possibilities is fusion. Fusion with the waves from other complexes can cause abnormally wide morphology to develop in the QRS complex. Fusion is also responsible for the delta wave of WPW, giving these complexes their characteristically wide appearance (fusion of the impulse traveling through the accessory pathway and the one traveling through the regular electrical conduction system).
NOTE
Occasionally, another very rare event can occur that causes narrow complexes to develop even though the rhythm is actually ventricular. As you know, ventricular rhythms are wide because most of the conduction through the ventricles occurs by direct cell-to-cell transmission of the depolarization wave. In very rare cases, a VTach originating in one of the bundles transmits faster down that bundle, causing a narrow, or at least narrower than expected, QRS complex. In these cases, there is partial transmission of the depolarization wave through the normal electrical conduction system. Faster transmission equals narrower QRS complexes. This event is so rare that you will probably never see it in your clinical practice. We just want you to be aware that it can happen and that it does exist.
9. Are the Complexes Grouped or Not Grouped?
© Jones & Bartlett Learning.
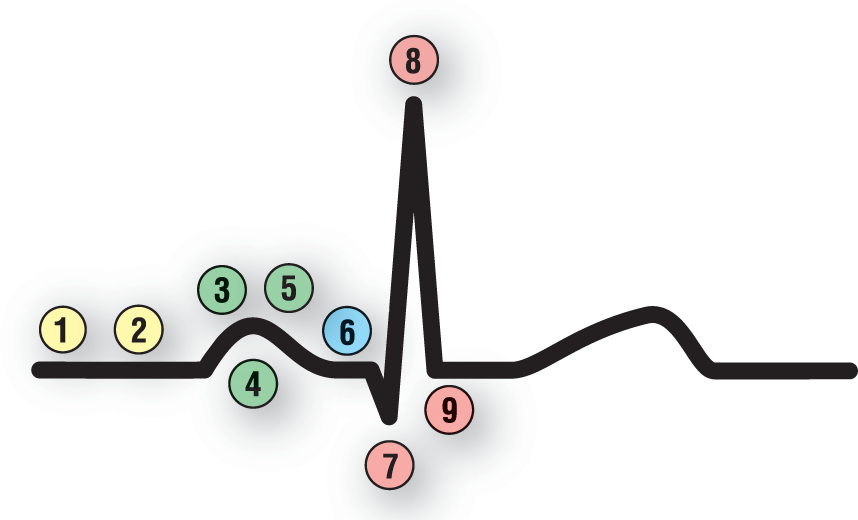
Grouped complexes are some sort of AV block until proven otherwise. Most commonly, grouping is seen with Mobitz I second-degree AV block. But, it can also be seen in Mobitz II second-degree, 2:1 second-degree AV block, advanced AV block, and sometimes even in third-degree AV block if the rates are just right.
The physiologic block that occurs at very fast supraventricular rates in atrial flutter and focal AT with block can also give the appearance of grouping. A search for the buried F or P waves in these cases will quickly lead you to the correct diagnosis.
Another common occurrence that can lead to a grouping pattern involves premature complexes. Frequent PACs, PJCs, and PVCs can give the appearance of grouping. This is especially true when the pattern involves bigeminy, trigeminy, quadrigeminy, or any other number. The rhythmic disruption of the underlying cadence of the rhythm causes the grouping appearance. In these cases, the abnormal morphology and timing of the P wave, PR interval, or the lack of P waves, will point you in the direction of premature beats rather than AV block.
10. Are There Any Dropped Beats?
© Jones & Bartlett Learning.
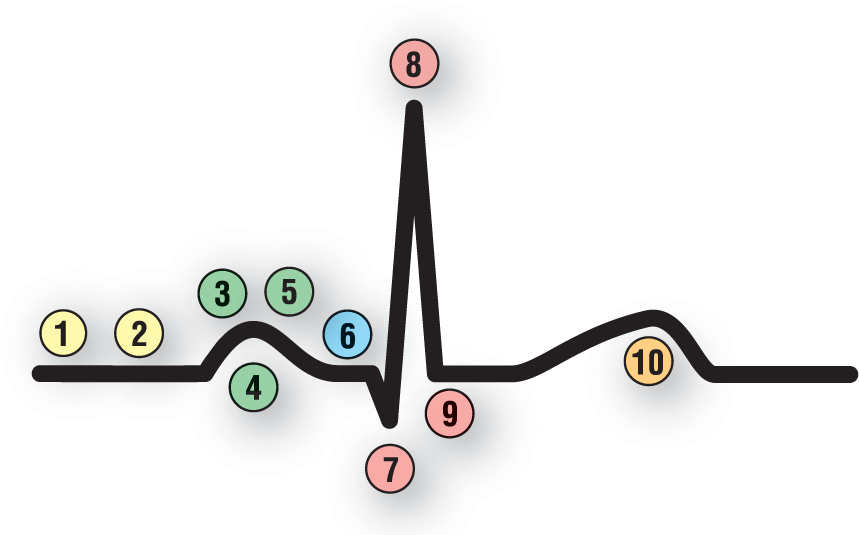
Dropped complexes can occur for many reasons. They can present either as independent events that are not transmitted to the ventricles for whatever reason, due to blocked or buried P waves that fall on the refractory period of the previous complex, or as part of an underlying AV block.
Blocked PACs should be easier for you to spot by now, as should blocked P waves due to an existing AV block . Identification should also be easier by applying the principle of look for the “company they keep” (grouping and characteristics matching the criteria for Mobitz I or II second-degree AV block, high-grade AV block, and third-degree AV block or complete heart block).
What are we getting at when we ask the question: Have I mined for gold? Well, we are asking you to examine your strip very carefully and look below the surface. Do not overlook any little irregularity, because that is where the “gold” will most likely be buried. Many times, it is these small, obscure areas of the strip that hold the key to the final diagnosis. In general, focus on two basic principles as you answer this question: (1) Concentrate on the abnormality, and (2) look at the “company it keeps.”
Take a look at a strip you want to try to figure out. Mentally at first, and later using your calipers, compare all of the waves and intervals. Where are the differences? Is it the timing of one of the complexes that is off? Is it a wave that is a bit wider, shorter, taller, or narrower? Is the morphology different in any one wave? Are the intervals all the same? Are there any notches present that shouldn’t be there? When you spot that little abnormality, do not leave it alone until you have an answer. Sometimes, the answer will be simply that it is an artifactual fluke; most of the time, however, you have found “gold.”
Buried P waves are the best example that we can think of when we say “mining for gold.” Typically, a buried P wave will cause the preceding T wave to be a little taller and fatter or it will cause it to lose some of its curves. This T wave will stick out like a sore thumb when compared to the others on the strip and will usually be associated with a prematurely occurring complex. If the P wave is blocked from conducting to the ventricles, however, you will only see the abnormal T wave (with the buried P) and then a long pause. These blocked, buried P waves will not conduct to the ventricles and will not have any QRS complexes or T waves associated with them.
Dr. Henry J. L. Marriott, in his book Practical Electrocardiography, talks about Bix’s rule (named after Dr. Harold Bix).1 This rule basically states that if you see a P wave about halfway between two QRS complexes in a supraventricular tachycardia, you should always look for the buried P wave hidden inside the QRS complexes (Figure 40-3). This is an important principle and we can use it with many rhythms, not just the tachycardias. Practically speaking, PR intervals can be quite prolonged and intervals up to 0.60 seconds can occur, but they are extremely rare. Since they are common, you need to think of a buried P wave and an AV block whenever you see these markedly prolonged PR intervals. The odds will definitely be in your favor. In these cases, a little mining will clarify if you are dealing with a prolonged PR or an example of Bix’s rule.

Figure 40-3: Bix’s rule. Take a look at the strip above. The PR interval is 0.43 seconds. This is a markedly prolonged PR interval that only rarely occurs. The blue arrow points to a notch in the QRS complex. Is that notch a part of the QRS morphology or is it a buried P wave? It is a buried P wave and this is an example of Bix’s rule. The blue dots mark the timing of the P waves along the strip.
© Jones & Bartlett Learning.
Differences in the R-R intervals also need to be addressed. Abnormal irregularity in the R-R intervals may be due to a sinus arrhythmia but, more likely, there is some other pathology involved. Premature complexes, escape complexes, blocked PACs, and AV blocks can all cause changes in the R-R interval.
Look closely at the events immediately before and after a different R-R interval or a pause. This is the area where gold is usually found. Frequently, you will see differences in the PR intervals which could represent a Wenckebach AV block. Blocked PACs can oftentimes be spotted in the T wave of the previous complex as mentioned before.
Sometimes, you may think that a notch or deflection may be a buried P wave but in reality it is part of the morphology of the QRS complex. This is especially true in looking at the pseudo-S and pseudo-R waves in AV nodal reentry tachycardia. Make sure that you check the regularity of the other P waves and see if the notch in question falls in line. If it does, it probably is a P wave; if it doesn’t, it is probably not a P wave. This is exemplified in Figure 40-3. Note that the cadence of the supraventricular rhythm falls in perfect alignment with the notch on the QRS complex and that the PR interval is markedly prolonged. Why are we so sure that, in this case, we are dealing with buried P waves and not notches? Because of the company it keeps. . .
This brings us to our other big principle in mining for gold: The company it keeps. When we say look at the “company it keeps,” we are talking about a principle that we’re sure your mother has told you a number of times. It could be something like “Show me your friends and I’ll show you what you are.” or “Birds of a feather, flock together.” The company it keeps refers to the events occurring around an abnormality. In Figure 40-3, we are sure about the buried P waves not only because of the notch, but because the notch was associated with a very rare, very prolonged PR interval. In addition, the cadence of the supraventricular rhythm fits perfectly. The diagnosis was not made because of only one finding, but because of the finding and the “company” that finding “kept.”
When you approach an obvious abnormality, look at everything around it in close detail. Do not leave the question unanswered. You need to be persistent when you mine for gold and if you are, eventually, you will be rewarded.
How Can I Put It All Together?
© Jones & Bartlett Learning.
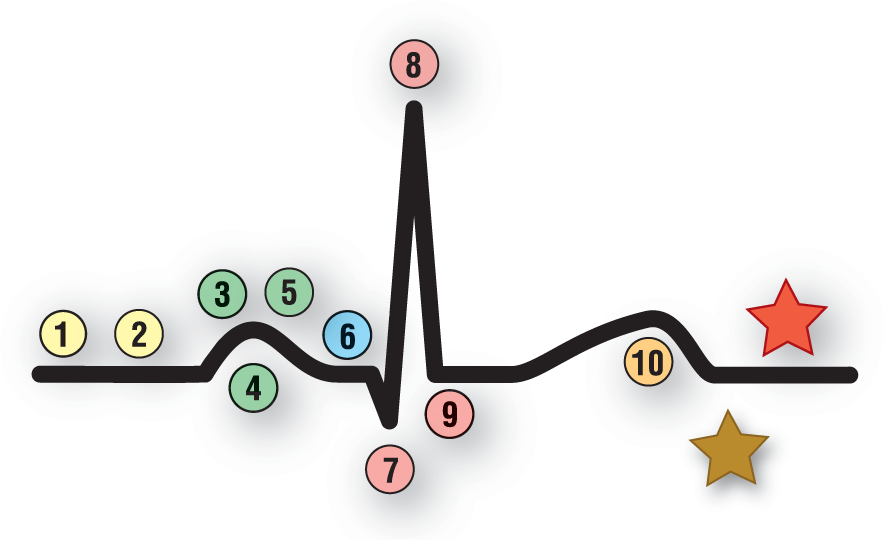
Unless you ask a question, you won’t get an answer. The question we ask in this section makes perfect sense to ask oneself when approaching an arrhythmia. The problem is that most people never ask it. The result is that you will be lost in the small intricacies of the rhythm, but you will miss the diagnosis because you are not seeing the “big picture.”
You need proof? When you took the end-of-section tests in this text, you probably came upon a strip that puzzled you. You saw the findings present on the strip, but couldn’t put it together. When you looked up the answer, you likely saw the diagnosis very clearly and knew that it was correct. Why? Because you saw the big picture.
Chances are, you would have gotten the answer correct if it had been a multiple-choice question, because the answers themselves would have made you think of how the pieces fit together. Unfortunately, in our clinical lives, we cannot turn to the back of the book to get the answer, and the monitor does not provide multiple choices at the end of the strip. So, what should we do? We need to ask the big question: How can I put it all together?
Let’s use an analogy to make our point a little differently. How do you build a jigsaw puzzle? You start out by looking at the “big picture” on the front of the box. Then, you find the corners and put them down. Then, you find the border pieces and build the outside frame. Then, you separate the rest of your pieces by color and put them down. Finally, you look at your finished work and see if it looks exactly like the “big picture.” Now, suppose you had to build the puzzle without seeing the picture on the front of the box. That would be a tough way to build a puzzle. That is exactly what we are doing when we analyze a rhythm strip or an ECG—we are looking at the individual pieces with no guidance from the big picture.
To start your analysis of any strip or ECG, formulate an initial impression of the strip. This is like imagining what the puzzle picture would look like before we build it. Then look at each individual piece of the puzzle and answer the 10 questions about the strip. Then step back and look at the finished picture. Does it make sense? Do all the pieces fit? Are there any pieces left over?
That last question (Are there any pieces left over?) is an important one. This is because, many times, there will be one piece of our arrhythmic puzzle that just doesn’t seem to fit. It is easy to ignore that one finding because it doesn’t want to fit into your diagnosis. This is a major mistake. In general, things will always fit. If it doesn’t, you may be looking at the wrong picture. You have to keep looking for a solution in which all of the information fits. As we always say: If it doesn’t fit, you mustn’t quit.
Putting it all together includes the history and physical exam of your patient. Suppose you had a patient who was cyanotic, diaphoretic, and hypotensive—in other words, sick as a dog. You looked at the rhythm strip and the patient was in a normal sinus rhythm at 65 BPM. Does this piece of the puzzle fit? No, it doesn’t; this patient should at least be tachycardic because the heart rate would increase trying to compensate for the low blood pressure. Should you just discard the physical exam and say that he is in normal sinus rhythm and the heart rate cannot be the problem, or do you quickly look around to see how this bit of information fits into the whole picture? Of course, you should look around a bit further and put it all together. In this particular case, the reason that the patient’s heart rate was only at 65 BPM was that he had taken a beta blocker that was preventing his heart rate from compensating for the hypotension caused by his massive gastrointestinal bleed. Now every piece in the puzzle fits.
We believe that the one fact that separates the great clinicians from the mediocre ones is how they fit all of the pieces together. If we are meticulous and spend the time, each of us can get all of the pieces. Fitting them together is the art form. The title of this text is Arrhythmia Recognition: The Art of Interpretation. Putting it together is the art. We can all do it. We just need to ask the question: Why?