Key Concepts
- change in the quantity demanded
- complementary goods
- congestion effect
- decrease in demand
- diminishing marginal benefit
- “holding other things constant”
- increase in demand
- individual demand curve
- inferior goods
- law of demand
- market demand curve
- movement along the demand curve
- network effect
- normal good
- The Rational Rule for Buyers
- shift in the demand curve
- substitute goods
Discussion and Review Questions
Learning Objective 2.1 Discover the shape of your individual demand curve.
You just took an Uber from home to campus for the first time and were willing to pay $13 for the trip. It was so much easier than driving yourself that you are willing to pay $21 for the same trip tomorrow. Have you violated the law of demand? Why or why not?
Learning Objective 2.2 Apply the core principles of economics to make good demand decisions.
Do you use water for things that are beyond what is necessary to sustain life? What if the price of water in your home tripled? How would you respond? Are there activities that you would change or stop doing? Briefly explain. Does your demand for water obey the law of demand?
Learning Objective 2.3 Add up individual demand to discover market demand.
A team of analysts at Amazon is researching the viability of producing a smart watch. How might they estimate potential demand for their smart watch? What kinds of factors would the analysts want to keep in mind to create the most accurate estimates?
Learning Objective 2.4 Understand what factors shift demand curves.
For each of the following goods or services, indicate whether you think they are normal or inferior goods for most consumers. Briefly explain your reasoning.
The newest iPhone
10-year-old used cars
Dental services
When Sony released the PlayStation 4, it was reported that it was taking a loss of $60 on every console. However, Sony expected to make this up with sales of online play subscriptions (PS+) and increased royalties from video games. Use the concepts described in this chapter to help explain this strategy.
Learning Objective 2.5 Distinguish between movements along a demand curve and shifts in demand curves.
- Find the flaw in reasoning in the following statement: “An increase in the cost of oil will cause the price of a plane ticket to increase. This increase in price will cause a decrease in demand for airline travel and a leftward shift in the demand curve.”
Study Problems
Learning Objective 2.1 Discover the shape of your individual demand curve.
GrubHub, a food delivery service, has recently expanded to your area. The accompanying table contains the number of deliveries per month that you demand at various delivery prices. Use this information to plot your individual demand curve. Describe the slope of your individual demand curve.
Price Deliveries $10 2 $7 4 $5 6 $4 8 $2 10 $1 12
Learning Objective 2.2 Apply the core principles of economics to make good demand decisions.
Consider Ron’s demand for after school care for his children. The marginal benefit Ron receives for every hour of child care is provided in the accompanying table. Using the Rational Rule for Buyers, if an hour of child care costs $24, how many hours would Ron purchase each day? What about for $18 per hour? Draw Ron’s marginal benefit curve and his demand curve.
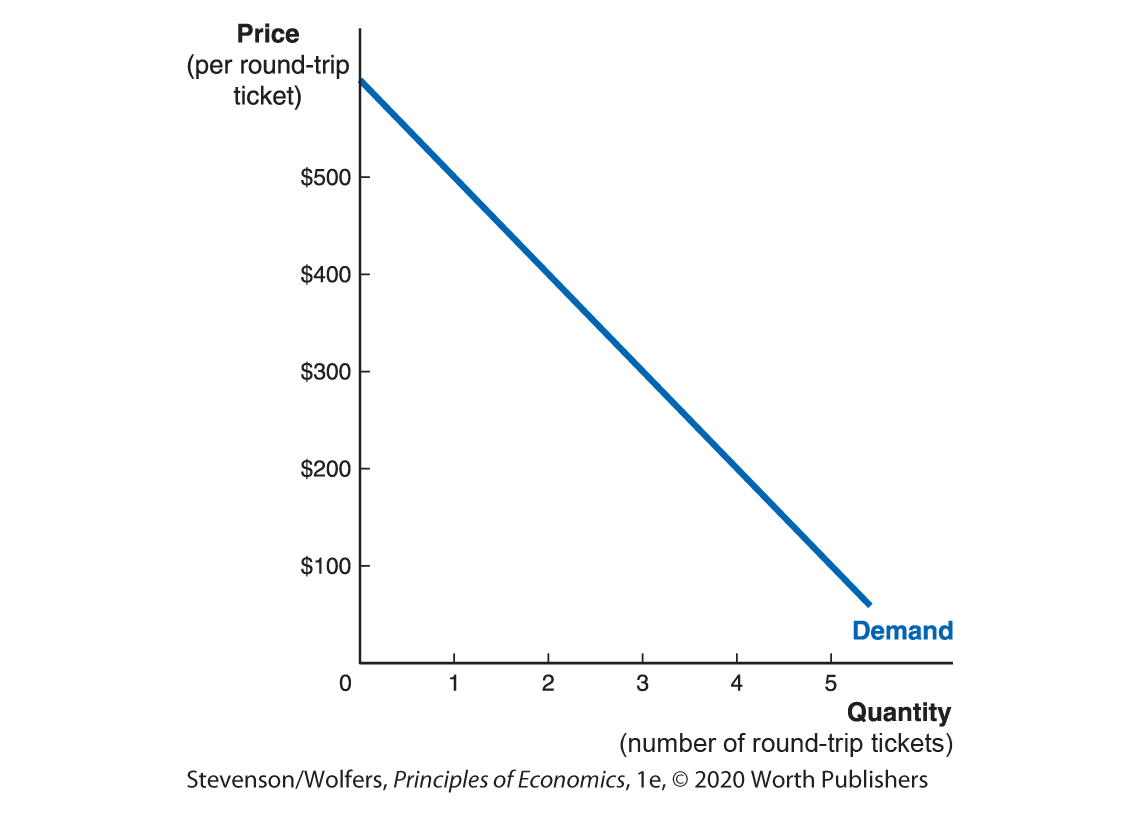
Hours of after school child care Marginal benefit (per hour) 1 $32 2 $30 3 $20 4 $14 - Kathy is attending school in Philadelphia. Each year she returns home to visit her family and friends in New York City. Kathy’s annual demand curve for train tickets from Philadelphia to New York is provided in the accompanying graph. How much benefit does Kathy receive from each trip home? If the price of a round-trip ticket is $230, how many trips should Kathy take?
Learning Objective 2.3 Add up individual demand to discover market demand.
The marginal benefit received for each gallon of gasoline consumed per week for Ang, Tony, and Gianna is provided in the accompanying table. On the same graph, plot each of their individual demand curves. Assuming these are the only people in the market, graph the market demand curve for gasoline.
Gallons consumed per week Ang’s marginal benefit Tony’s marginal benefit Gianna’s marginal benefit 1 $7 $4 $8 2 $5 $3 $6 3 $3 $2 $4 4 $1 $1 $2 You own the only pharmacy in the small town of Jackson City, which has 40,000 residents. You would like to get a sense of what the local demand is for seasonal allergy medicine so you can determine how many packages to keep in stock and what price to charge. You conduct a survey of four residents of Jackson City, asking them about the quantity of allergy medicine they would buy each allergy season at various prices. Their responses are shown in the accompanying table. Estimate and graph the demand for the entire town of Jackson City.
Price Lee June Carlotta Eric $8 8 5 6 9 $10 6 4 5 5 $12 4 3 4 3 $14 2 2 2 1 $18 0 1 1 0
Learning Objective 2.4 Understand what factors shift demand curves.
For each of the following pairs of goods, identify if they are substitutes or complements and use a graph to illustrate how the change described impacts the markets for both goods or services.
Gasoline and sport utility vehicles: The price of gasoline increases.
Taking a train or plane between NYC and Washington, DC: The price of airfare increases.
A smartphone and a Verizon data plan: The price of a monthly data plan increases.
Consider the market demand curve for the Samsung Galaxy smartphone. For each of the following, assess whether it would cause a rightward shift in the demand curve, a leftward shift in the demand curve, or no change in the demand curve.
Batteries in Samsung smartphones begin to spontaneously combust.
Apple decides to increase the price of the newest iPhone by 10%.
Samsung increases the price of the Galaxy by 10%.
According to a 2018 article in the Wall Street Journal, proposed tariffs on imported steel could cause the price to consumers of new cars to increase by as much as $300. Use a graph to illustrate the impact of this on the current demand curve for new cars in the United States.
As part of the marketing team at Delta airlines, you must develop a strategy to increase demand for flights between Kansas City and Detroit. You examine the data from previous flights and determine that the existing demand for flights between the two cities is as given in the following table.
Price per flight Quantity demanded per day $200 1,200 $300 1,100 $400 1,000 $500 900 $600 800 $700 700 However, your team launches a viral advertising campaign that is so successful that all existing consumers increase their willingness to pay by $100, and 50 new customers demand flights at every price. Fill in the following table to show the new quantity demanded at each price following the advertising campaign.
Price per flight Quantity demanded per day after the advertising campaign $200 1,350 $300 $400 $500 $600 $700 Use a graph to illustrate both the initial demand curve and the new demand curve from part (a).
Learning Objective 2.5 Distinguish between movements along a demand curve and shifts in demand curves.
Illustrate graphically how each of the following events will impact the demand for cups of coffee and explain why demand changes.
Average hourly wages increase in the United States.
The state of California requires all coffee houses to post warnings to consumers of the cancer-causing components of coffee.
Coffee houses increase the price of coffee in order to pay their baristas more.