21.2 GDP Measures Total Spending, Output, and Income
The fact that GDP is three things at once—total spending, total output, and total income—is not just a surprising insight; it’s also useful. It means that there are three different ways to measure GDP:
- by adding up every dollar of spending;
- by adding up every dollar’s worth of output produced; or
- by adding up every dollar of income earned.
In order to get a good estimate of the state of the economy, the government does all three. That’s why our next task is to explore how each of these measures is compiled and to investigate the useful business intelligence that each reveals. The simplest way to do this is to follow a single item on its path through the economy, which is why I want to begin by telling you about a couch.
The story begins with Bennet Lumber, a family-owned lumber company in Washington. Bennet Lumber chops down and transforms trees into lumber that can be used to make furniture. The company might sell $400 worth of lumber to McCreary Modern, a furniture manufacturer in North Carolina. McCreary Modern turns that lumber into a couch that it will sell to a retailer, such as Crate & Barrel, for $1,000. (While couches also need other inputs like fabric, cushion fillings, nails, and glue, we’ll put these aside for now to keep things simple.) Crate & Barrel markets the couch and sells it to a happy customer for $1,500.
As we’re about to discover, there are three different ways of figuring out how much GDP this little story just created, and they all lead to the same answer.
Perspective One: GDP Measures Total Spending
The first perspective on GDP comes from viewing it as the sum of total spending in the economy. Tracking spending is useful, because you can figure out who’s doing all that spending—whether it’s businesses, households, governments, or foreigners—and what they’re buying.
GDP is total spending on final goods.
This method of measuring GDP simply adds up total spending in the economy. But remember: GDP only includes spending on final goods, so the key transaction occurs when the final user buys the couch at Crate & Barrel. We focus on the final good—the Crate & Barrel couch—because its price embodies the productive efforts of the earlier stages of production at Bennet Lumber and McCreary Modern. Consequently, total spending on final goods—and hence the GDP created by this chain of production—is $1,500.

GDP includes new inventories.
Because GDP is a measure of production (that’s the “P” in “GDP”), it counts goods in the year they’re made, regardless of the year in which they’re sold. This means that it’s important to also count new inventories—goods that have been produced but not yet sold—as part of GDP. And so when more unsold couches sit in Crate & Barrel’s showrooms or warehouses, they’re included in GDP, because they’ve been produced. You can think of this as a form of spending—if you’re willing to imagine that Crate & Barrel’s inventory division bought those couches from its couch division. Because everything that’s produced will either be bought this year or stored as inventories, the inclusion of inventories in GDP ensures that total spending equals total output.
GDP is the sum of consumption, investment, government purchases, and net exports.
Now here’s the big payoff to measuring GDP by tracking spending: You can track who’s doing all that spending, and what they’re buying. Indeed, total GDP is calculated by adding up the value of different types of spending.
Economists often use abbreviations to describe each type of spending: Consumption is denoted C; Investment is I, Government purchases are G, and Net eXports is NX. Finally, GDP is denoted Y. (Why Y? Y not.)
Because GDP is the sum of each type of spending, it’s calculated as follows:
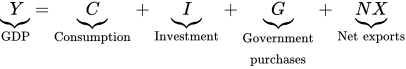
This equation is an identity, which means that it’s always true because it describes the definition of GDP. That’s because consumption, investment (including investment in inventories), government purchases, and net exports collectively define all the goods and services produced in the economy.
As a result, we measure GDP by adding total spending on consumption, investment, government purchases, and net exports. Figure 3 illustrates these calculations.
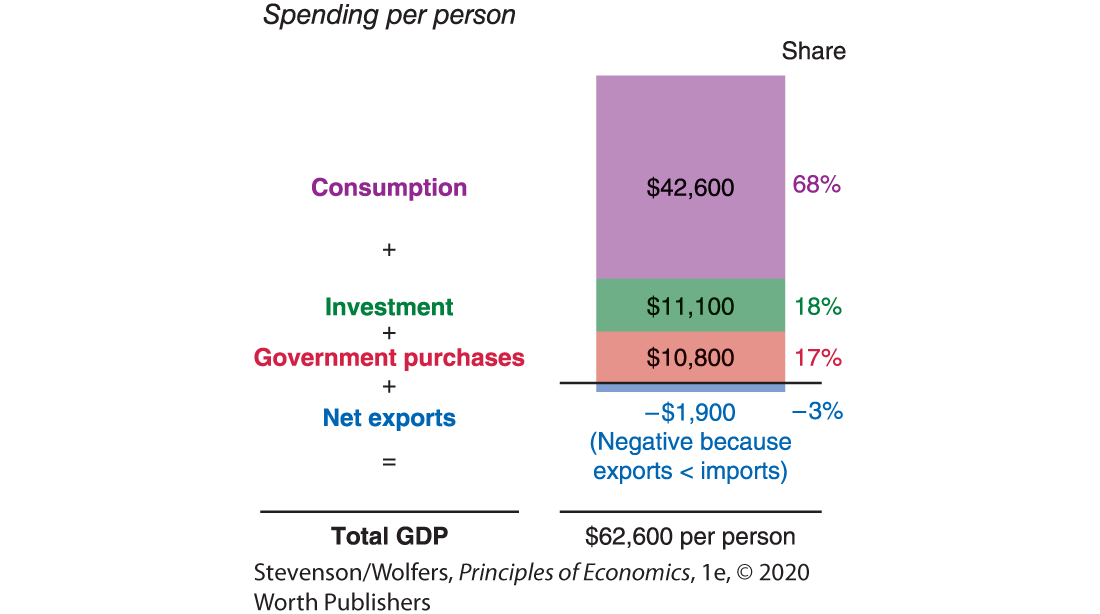
Figure 3 | GDP Is the Sum of All Spending on Final Goods and Services …
2018 Data from: Bureau of Economic Analysis.
Okay, that’s the big picture. Now, let’s take a look at the details of each of these types of spending.
Household purchases are typically called consumption.
When your household buys goods and services, it’s counted in GDP as consumption. Your consumption includes goods such as food, clothes, and gas, as well as services such as doctor visits, bus fares, and your cell phone bill. It also includes durable goods, which are long-lasting goods such as cars, couches, and washing machines. Even though durable goods take many years to fully use, they’re counted as consumption in the year that they’re purchased.
The money you spend on rent is also counted in GDP as a form of consumption. This raises a tricky issue, because homeowners enjoy a similar stream of benefits in terms of shelter and comfort, but don’t pay any rent. In order to treat all housing services equally, GDP also counts an imputed rent—an estimate of the rental value of your home—that you (the consumer of housing services) effectively pay to yourself (the homeowner). We’ll dig deeper into consumption in Chapter 25.
Business purchases are typically called investment.
Economists use the word investment to refer to spending on new capital assets that increase the economy’s productive capacity. It includes both the purchase and the production of long-lived assets that contribute to future production. Building a factory is an investment because you’ll use it to produce goods for many years. Office furniture, computers, and airplanes are all investments in equipment that you’ll use to produce more goods and services. Business investment also includes spending on research and development. New inventories are counted as a form of investment because they’ll lead to future sales.
But be careful, because this macroeconomic definition of the word investment is very different from its everyday usage. Remember, GDP is about production, so a macroeconomist says that investment occurs only when something new—such as a newly constructed office building—is produced. By contrast, casual conversations about “investing,” are often about depositing your money in the bank, buying stocks, or purchasing a block of land. But when you put your money in the bank, you’re not actually buying anything—you’re saving it to spend later. When you buy stocks, you’re usually buying a share of an existing business from someone else. And when you buy a block of land, you’re buying an existing asset. Because GDP measures what’s produced, it doesn’t count the storage of your savings, the resale of stock in existing companies, or the resale of real estate as investment.
While most investment is done by businesses, when your household buys a newly built home, it counts as investment, because it increases the economy’s capacity to provide housing services. And so newly built houses are added to GDP as residential investment. But if you buy an existing house, you’re simply changing who owns an existing asset, so your purchase isn’t included in GDP. We’ll take a deep dive into investment in Chapter 26.
Government purchases are called … government purchases.
Whenever the government buys stuff—goods and services—it’s counted as government purchases. This includes local government spending on schools, state government expenditures on highways, and federal government outlays on the military.

Social Security payments transfer income and so they don’t count toward GDP.
When the government pays the salary of a teacher or a corporal in the Marines, it’s paying them to produce educational or defense services, so their salaries are counted in GDP as government purchases. But a lot of government spending doesn’t count as government purchases. For instance, the government sends out billions of dollars in Social Security and unemployment insurance checks. These are examples of transfer payments, which transfer income from one entity (the government) to another (an individual). Because transfer payments involve no new production of goods or services, they’re not counted in GDP. The term government purchases might sound a bit clunky, but the word purchases is there to remind you that it’s all about the stuff the government buys (and so excludes transfers). We’ll take a closer look at government spending in Chapter 35.
Foreign purchases of our goods less our purchases of foreign goods is called net exports.
Finally, we need to account for linkages with the global economy, while remembering that GDP measures domestic production. Exports are goods and services that we produce domestically in the United States and sell to people and businesses in other countries. Because exports are produced domestically, this spending is included in GDP.
Imports are goods and services that are produced in other countries and purchased by domestic American buyers. Because imports aren’t produced domestically, they’re excluded from GDP. This means that your spending on Canadian maple syrup isn’t included in U.S. GDP. This gets a bit tricky because that syrup was purchased by a household and so was already counted as consumption. Indeed, all imports of final goods and services are already counted as either consumption, investment, or government purchases (depending on who bought them). So to exclude any influence of foreign-produced goods and services from GDP, we need to subtract spending on imports from total spending.
As a result, GDP adds in exports and subtracts imports. This is why it counts net exports, which is spending on exports minus spending on imports. But don’t let this confuse you into thinking that imports subtract from GDP. They don’t. They’re simply excluded from GDP—they’re neither a positive nor a negative. But in calculating GDP, we need to subtract spending on imports to offset the fact that spending on imports has already been counted in the other categories.
We’ll explore imports and exports further in Chapter 28.
Perspective Two: GDP Is Total Output
An alternative perspective views GDP as the sum of total output. It’s a useful perspective, because it highlights what’s being made and by whom. It provides an economy-wide benchmark against which you can compare your company’s size and productivity. And by tracking goods through the production process, this perspective maps the structure of production, so that you can assess which sectors are large (Hint: the services sector), which are growing, and how interdependent they are.
GDP is the sum of value added at each stage of production.
So far, we’ve seen that GDP is equal to total spending. Because every dollar that is spent buys someone else’s output, it’s also a measure of the market value of total output. And this in turn implies that we can measure GDP by adding up total output across all businesses.
Economists have devised a clever way to measure the output of each business involved in a complicated production process. It’s based on the idea that at each step of the production process, a company uses materials prepared by others, and then transforms them into something more valuable. The amount by which your company increases the value of an item is called its value added, and it’s a measure of your contribution toward producing that item. This means that your company’s value added is your total sales minus the cost of the intermediate goods and services you bought from other firms.
Each stage of the production process before the final sale adds value.
As a therapist might say, let’s return to the couch to really explore these issues. The production process began when Bennett Lumber took raw material—a tree—and turned it into lumber that it sold to McCreary Modern for $400. That tree cost Bennett Lumber nothing (we’ll come back later to the problems of valuing natural resources as if they’re free). And so the work it did felling the tree, sawing it into planks, and drying and finishing it into commercial grade lumber that sold for $400, created $400 of value. Next, McCreary Modern used that $400 worth of lumber and turned it into a couch that it sold to a retailer for $1,000, which means that transforming raw lumber into a couch added $600 of value (again, for simplicity we’re ignoring fabric, cushion fillings, etc.). The couch then went to Crate & Barrel, which advertised it and helped get it in the hands of a customer who loves it. Crate & Barrel bought the couch for $1,000 and sold it for $1,500, which means that its efforts—online ads, the sales staff, and its retail location—added $500 of value.
Add the output of each firm in this production chain—$400 of value added by Bennett Lumber plus $600 from McCreary Modern plus $500 by Crate & Barrel—and you’ll discover that this production process added $1,500 to GDP. More generally, total GDP is the sum of the value added across all businesses in the economy.
Total output and total spending are equal (and they both equal GDP).
This calculation of total output yields the exact same answer as calculating GDP based on spending on final goods. Both suggest the couch adds $1,500 to GDP.
I didn’t “fix” the numbers to work this way. Rather, it always works out this way, because of a deeper truth. The spending-based measure of GDP focuses on the value of the couch once it emerges from the final stage of production. The output-based measure takes a different perspective, adding up the value created at each stage along the way. But these are just two different perspectives on the same couch, and they must yield the same answer because whatever value that couch has at the end of the process (that’s the spending-based measure) must have accrued somewhere along the way (which is what the sum of value-added measures).
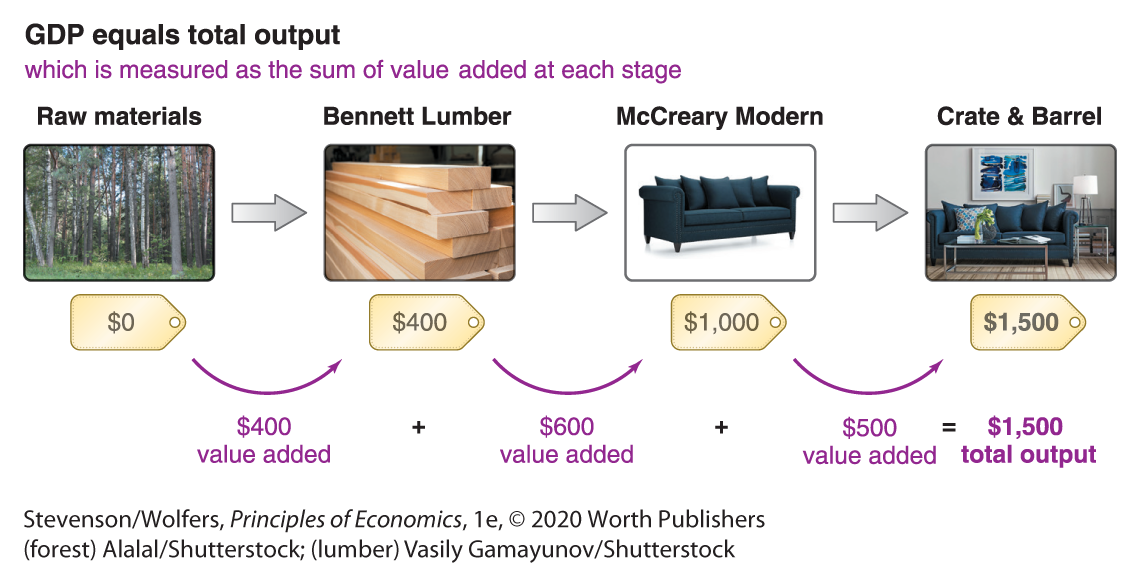
Do the Economics
Let’s work through the value added of one particular business. In 2017, Harley Davidson reported revenue of $4.9 billion from sales of motorcycles and related products. It used $3.2 billion in intermediate inputs to make this output. What was its value added?

As a result, Harley Davidson’s motorcycles added $1.7 billion to GDP in the United States.
2017 Data from: Harley Davidson annual report.
You can use the idea of value added to calculate the total GDP created by your favorite business. Many companies release data on their sales and costs and a quick Google search will turn up annual reports that provide you the data you need.

Production of services dominates goods.
Once you’ve measured the value added by businesses in different sectors of the economy, measuring total output simply requires adding up the output across each of these sectors, as shown in Figure 4. These data are particularly valuable because they reveal the structure of production. They show that the modern U.S. economy is dominated by the service sector, which accounts for 83% of output. By contrast, goods account for only 17% of the economy. Make sure that your image of a modern economy matches this service-based reality. If you’re thinking about a factory, you’ve got the wrong image. It’s far more realistic to picture banks, hospitals, schools, restaurants, wholesalers and retailers, as well as consulting, legal, and accounting firms.
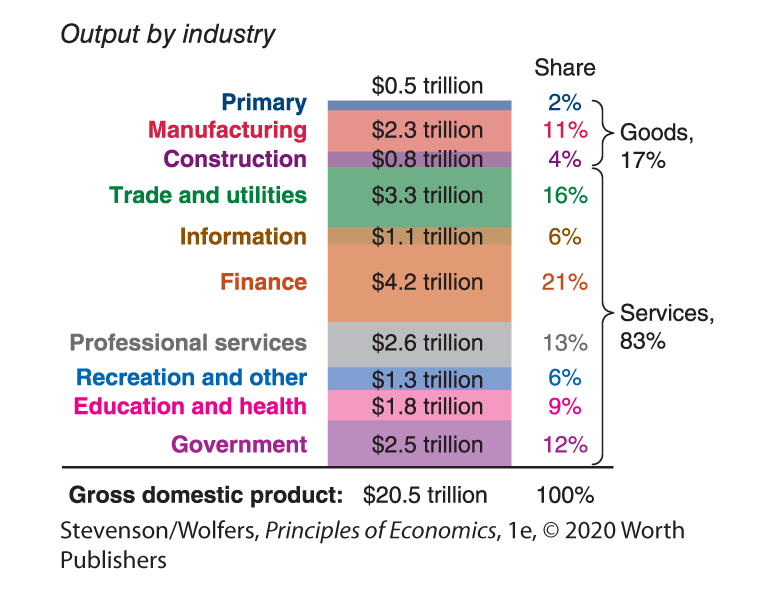
Figure 4 | GDP Is the Sum of Output across All Sectors …
2018 Data from: Bureau of Economic Analysis.
While Figure 4 shows total output broken down into a handful of broad industries, you can dive into the numbers at www.bea.gov/industry/ and drill down into dozens of sub-sectors, comparing output of, say, paper products to water transportation.
Perspective Three: GDP Measures Total Income
Our final perspective views GDP as the sum of all incomes. It’s a particularly useful perspective, because GDP per person measures average income, which you can use to assess the material living standards in a country, and whether they’re improving. And by tracking whether this income is going to workers as wages or to business owners as profits, this perspective tells you who is enjoying the fruits of all this economic activity.
GDP is total income, which is the sum of total wages and total profits.
There are two sides to every transaction—a buyer and a seller—and so every dollar that a buyer spends also registers as a dollar of income to a seller. This means that we can also measure GDP by adding up the total income earned in productive activities. That means adding up all of the wages earned by workers, as well as the profits that shareholders and business owners earn.
Let’s return to the couch to see how this plays out. Bennett Lumber started with raw materials that cost it nothing, and ended up with $400 of revenue. In terms of income flows, it paid $300 in wages to its workers, leaving it with a $100 profit. McCreary Modern got $1,000 revenue from selling its couch, and paid $400 to Bennet Lumber, and spent an additional $500 on wages, so the company was left with $100 in profit. Finally, Crate & Barrel got $1,500 from selling a couch it bought for $1,000. It paid $200 in wages and salaries, which left it with a $300 in profit. Across all three firms, total wages add up to $1,000 and total profits add up to $500.

Total income is the sum of wages and profits, so measuring GDP as total income suggests that this couch added 
Capital gains and losses aren’t counted as new income.
Just as your purchase of an existing asset isn’t counted as new investment, your earnings from selling an existing asset (such as shares, land, or other financial assets) doesn’t count as new income. Capital gains don’t count as GDP even when you sell assets at a higher price than you paid for them, because they’re simply the resale of existing assets, rather than income earned from productive activity. Nothing is gained from speculative transactions, because a seller’s gain from getting a higher price is offset by the buyer’s loss at having to pay that higher price.
Labor’s share of total income is declining.
These income-based data are useful, because they describe how we divide the economic pie between workers and the owners of capital. As such, they reveal the extent to which GDP boosts the purchasing power of households, versus the financial status of businesses.
The labor share describes the share of total income that goes to workers as wages, salaries, and benefits. Historically workers received nearly two-thirds of all income, but as Figure 5 illustrates, the labor share has declined over recent decades. In turn, the capital share—the share of income that goes to the owners of capital—has risen. Because capital is owned by a smaller and richer group of Americans, this rising capital share has led to rising income inequality.
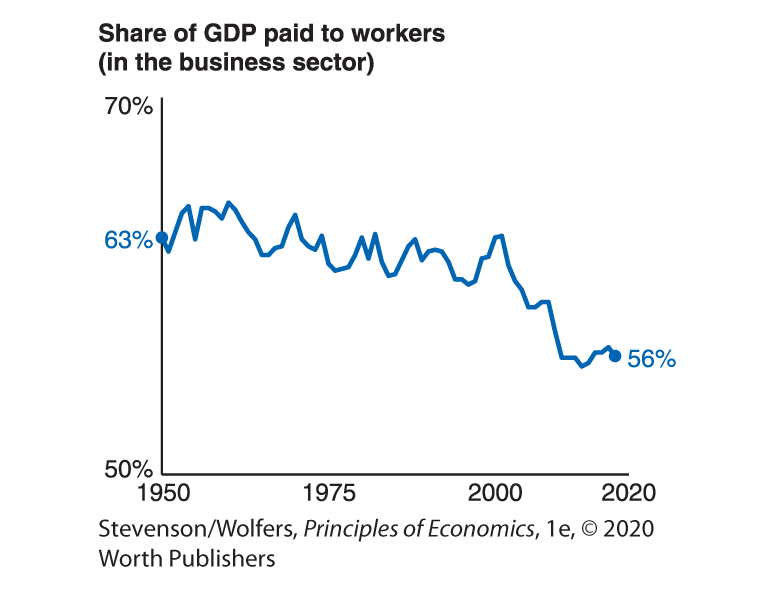
Figure 5 | Labor’s Share of GDP Has Declined over Recent Decades
Data from: Bureau of Economic Analysis.
Recap: Three Perspectives on GDP
Okay, it’s time to take a breath and look at the big picture to see how far we’ve come. We started by defining GDP as “the market value of all final goods and services produced within a country in a year.” Next came the conceptual insight that you can think of GDP as total spending, as total output, and as total income. Finally, we’ve dug into the practical implication that we can measure GDP by adding total spending, total output, or total income.
Even though these each measure the same thing—GDP—U.S. government statisticians give them different names, which are listed in Figure 6. While total production, total spending, and total income are the same in theory, they get different names because real-world measurements can differ because each relies on different sources of imperfect data.
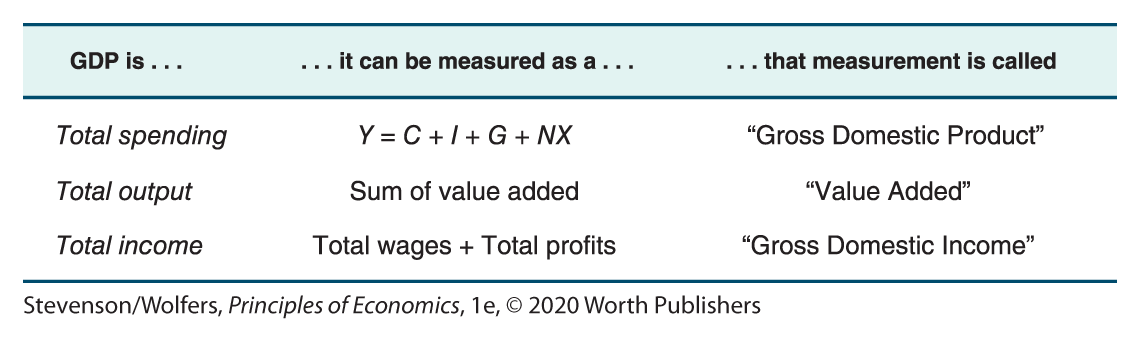
Figure 6 | Alternative Measures of GDP
You’re now equipped to make sense of all these data. If you want to dig in deeper, point your browser to www.bea.gov/national/index.htm#gdp.