25.4 What Shifts Consumption?
So far our analysis of the link between income and consumption has held other factors constant. It’s time to see what happens when those other factors change. This is where the interdependence principle comes to the fore, highlighting how consumption depends on other factors, including the real interest rate, expectations, taxes, and wealth.
First, let’s focus on the distinction between a shift in the consumption function and a movement along the curve. The consumption function shows how consumption depends on income. So a change in income doesn’t shift the consumption function; instead, it leads to a movement along the consumption function, as shown in Panel A of Figure 10. But other factors—including the real interest rate, expectations, taxes, and wealth—will change consumption at any given level of income. As a result, they shift the consumption function. Panel B of Figure 10 shows that an increase in consumption at any level of income shifts the consumption function up, while a decrease in consumption shifts it down. Our next task is to analyze the four factors that shift the consumption function.
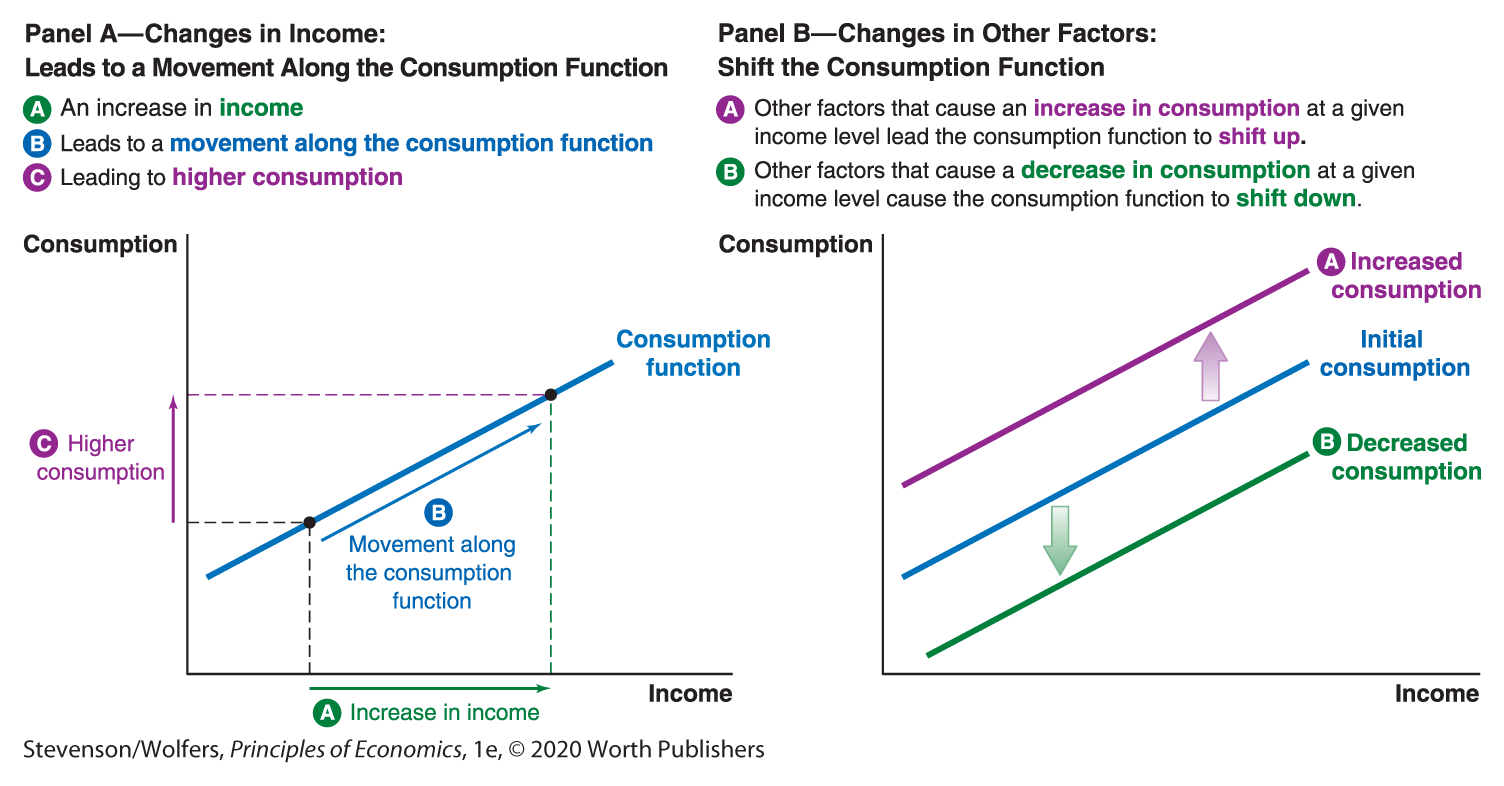
Figure 10 | Movement Along the Consumption Function versus Shifts in the Consumption Function
Consumption Shifter One: Real Interest Rates
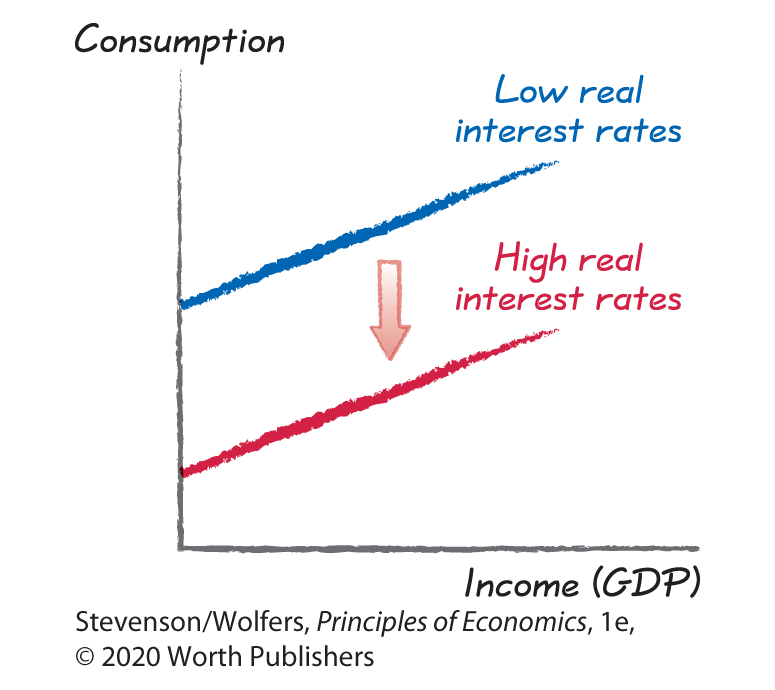
It’s time to add the real interest rate back into our analysis. We’ll analyze its effects on saving and consumption separately.
Let’s start with saving because it’s most straightforward. The benefit of saving is that you’ll earn interest. Consequently, a higher real interest rate raises the benefit of saving, and the cost-benefit principle tells you that people will respond by doing more of it. That is, a higher real interest rate leads to an increase in saving.

The effects of a higher interest rate on current consumption are a bit more complicated because there are two forces that sometimes work in opposition to each other. First, a higher real interest rate is an incentive to substitute toward more consumption tomorrow and less today. This substitution effect arises because the opportunity cost of spending a dollar on consumption today is saving that dollar and spending it plus the interest earned on it in the future. The higher the real interest rate, the higher this opportunity cost, leading consumers to reduce their current consumption.
Second, a higher real interest rate boosts your income if you’re a lender and decreases it if you’re a borrower. That’s because lenders get paid interest, and borrowers have to pay it. So if you’re a lender, higher interest rates boost your income, and this income effect leads to higher consumption. But if you’re a borrower, higher interest rates effectively reduce the income you have left after making interest payments, and this income effect reduces your consumption.
The net effect of these two sometimes-conflicting forces could go either way. But most evidence suggests that an increase in the real interest rate leads to a decrease in consumption.
Consumption Shifter Two: Expectations
Consumers’ expectations about the future state of the economy can play a big role in driving consumption. Optimism about future economic growth means that people expect their future incomes will be higher. And to the extent that consumption is driven by permanent income—what consumers expect to earn in the future—optimistic expectations translate into higher consumption.
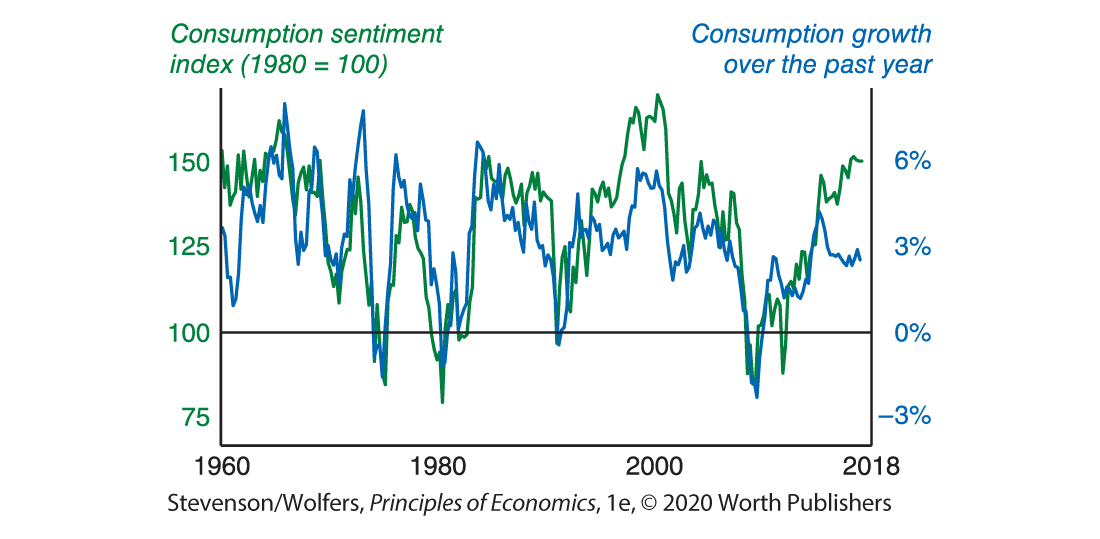
Figure 11 | Consumer Sentiment Predicts Consumption Growth
Data from: Bureau of Economic Analysis; University of Michigan.
You can track consumer optimism by following the University of Michigan’s consumer sentiment index shown in Figure 11. This index summarizes the results of hundreds of monthly interviews asking consumers a battery of questions about their confidence in the economy. As Figure 11 illustrates, high levels of consumer sentiment tend to predict rapid growth in total consumption.
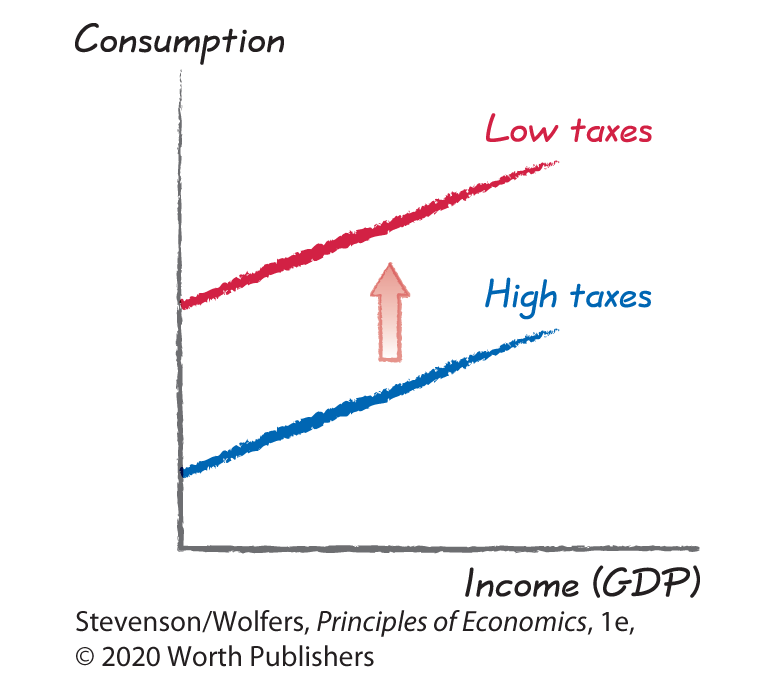
Consumption Shifter Three: Taxes
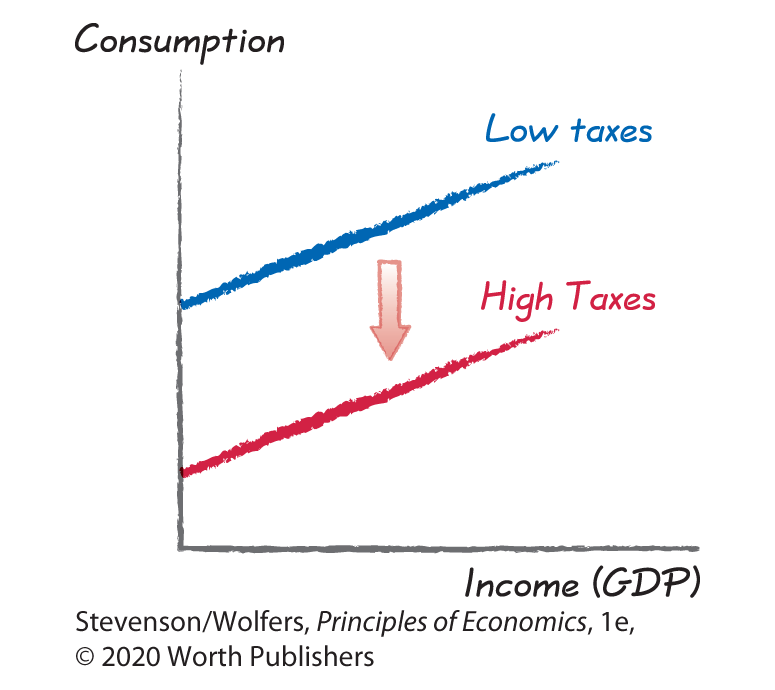
Uncle Sam taxes a chunk of your income before you even get a chance to think about whether to spend or save it. Because you can’t spend that money, taxes are an important factor shaping consumption. Higher taxes reduce your disposable income—that is, your after-tax income—which leads to lower consumption at any given level of pre-tax income. Total pre-tax income is the same thing as GDP, so that means that high taxes lead to lower consumption for any level of GDP. That is, a tax increase will shift the consumption function downward.
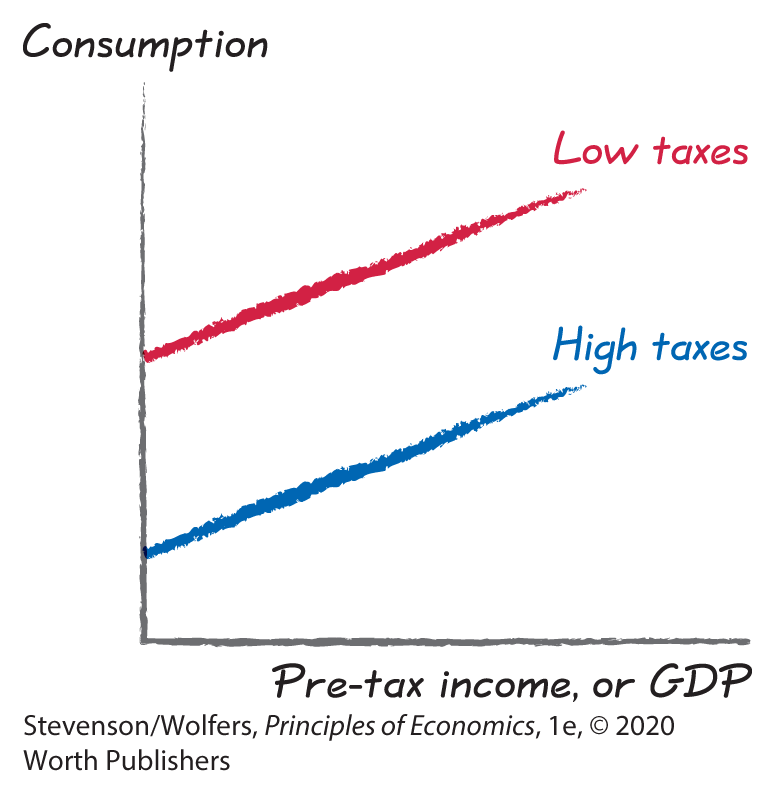
On the flip side, tax cuts increase disposable income, shifting the consumption function upward, leading to higher consumption at any level of GDP. This is why governments sometimes use tax cuts to help stimulate more spending when the economy slows. Economists debate how effective tax cuts are as a stimulus. If consumers spend most of their tax cut—as hand-to-mouth consumers will—then it’ll be an effective stimulus. But consumption smoothers will recognize that a temporary tax cut doesn’t boost their permanent income by much, and so they’ll save rather than spend most of their tax cuts. When this happens, the tax cut doesn’t yield much of an effective stimulus and the government might be better off spending the money itself. We’ll assess some of the evidence on this in Chapter 35 on fiscal policy.
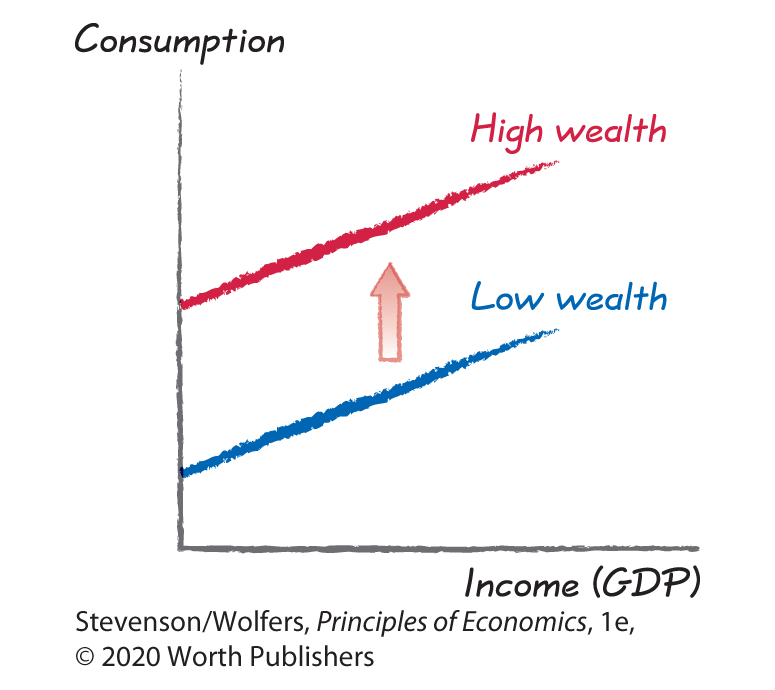
Consumption Shifter Four: Wealth
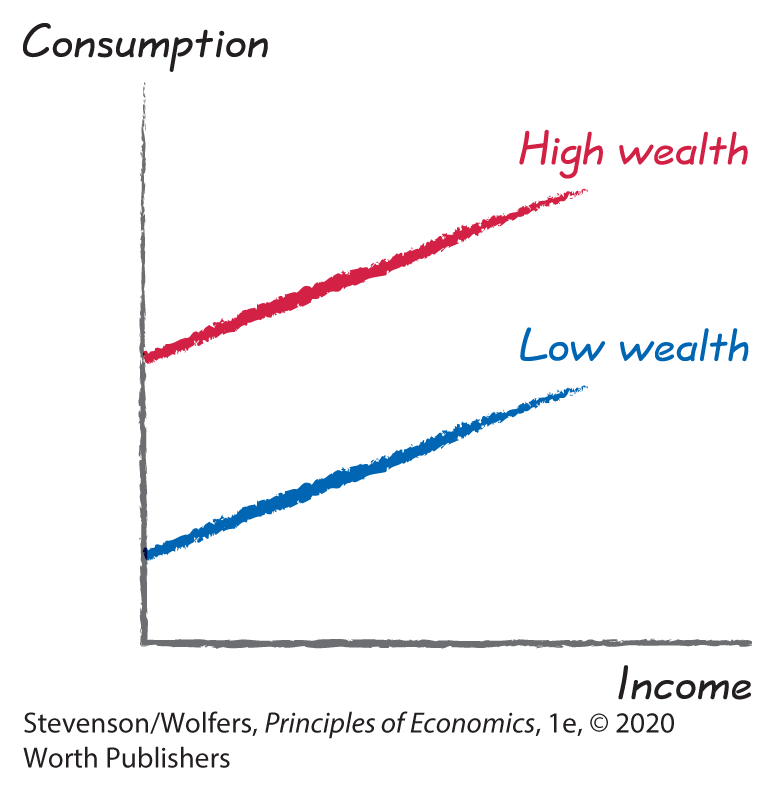
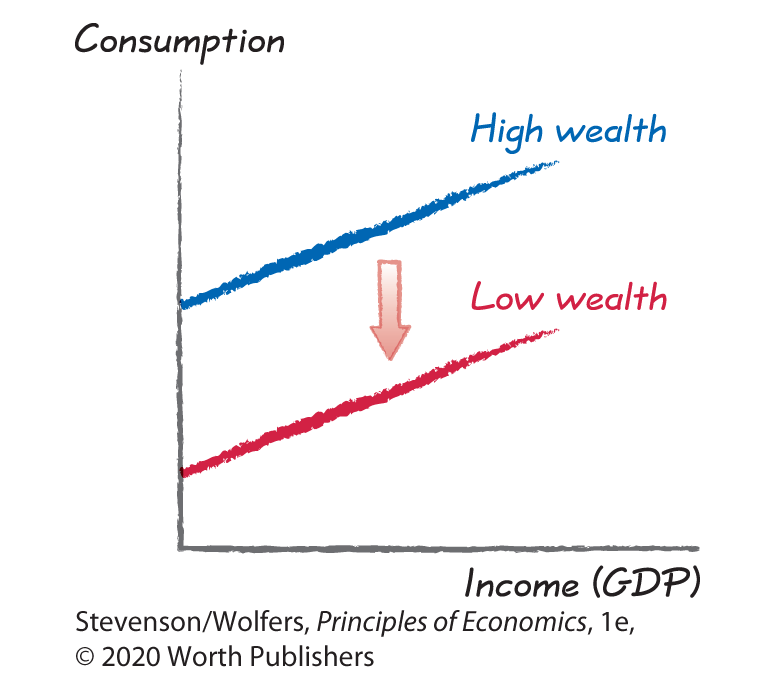
Your total resources include not just your income, but also your accumulated stock of wealth (which can be negative, if you’re in debt). Greater wealth leads to an increase in consumption at any given level of income, shifting the consumption function upward.
This gives financial markets an important role shifting consumption. For instance, rising stock prices lead the wealth of shareholders to rise, and they may choose to spend some of this extra wealth on consumption, shifting the consumption function up.
Likewise, many Americans hold most of their wealth in housing, and so an increase in house prices can also make people feel wealthier, leading them to consume more. Before spending your newfound housing wealth, realize that a broad-based rise in house prices is a two-edged sword. Higher house prices are good news because they boost your wealth. But they’re also bad news because if you sell your house to realize that gain in wealth, you’ll have to find somewhere else to live, and the increase in house prices will make buying another house more expensive.
Okay, that’s it. At this point we’ve worked out how changing macroeconomic conditions shift consumption. Figure 12 summarizes what we’ve learned.
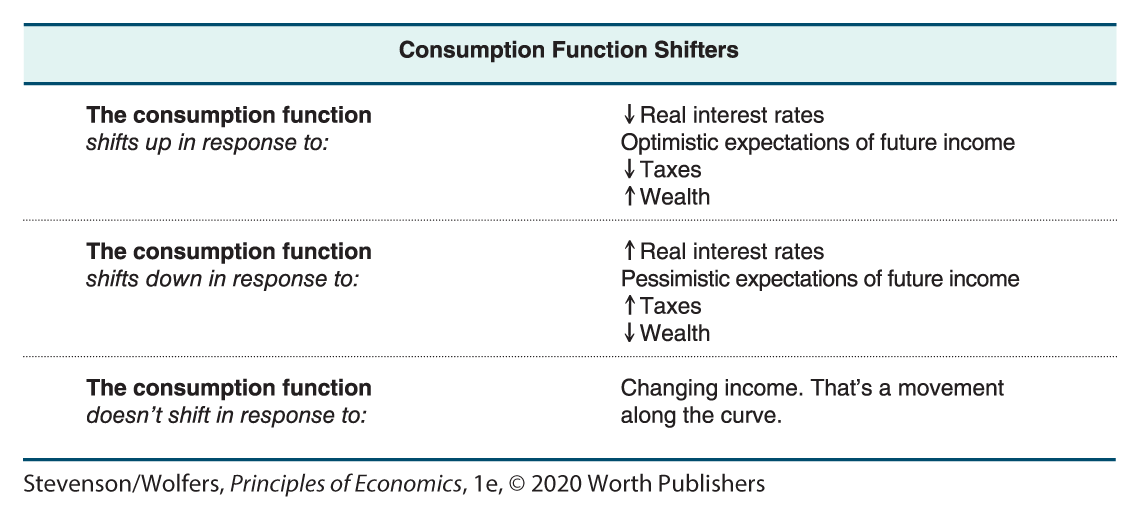
Figure 12 | The Macroeconomics of Consumption
Do the Economics
For each of the following examples, figure out how the consumption function responds to changing macroeconomic conditions:
- The Federal Reserve raises interest rates.
- Increase in real interest rates
- → Consumption function shifts down
- The stock market rises to a record high.
- Increase in wealth
- → Consumption function shifts up
- The government gives a one-time tax rebate.
- Lower taxes
- → Consumption function shifts up
- People start to feel better about their financial prospects.
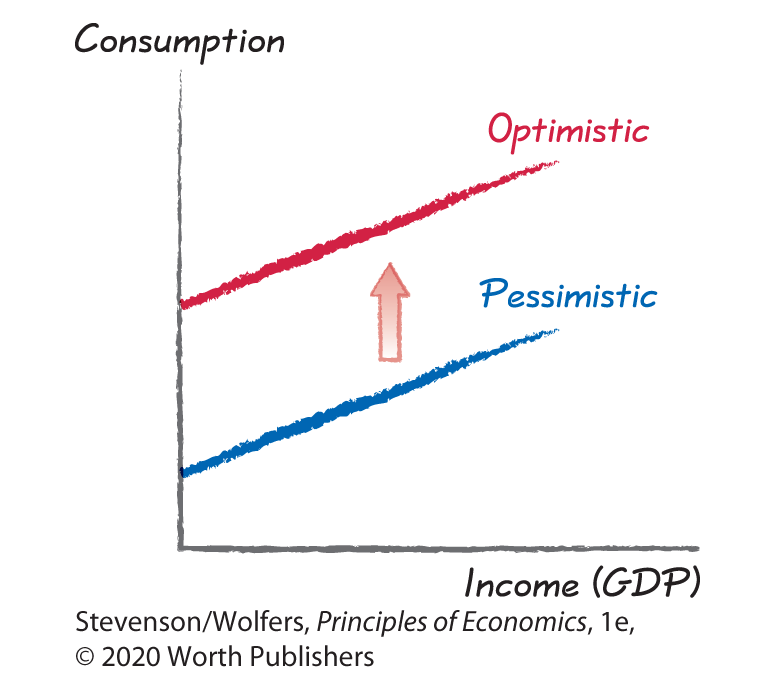
- Optimistic expectations
- → Consumption function shifts up
- The government raises taxes to pay off some of its debt.
- Increase in taxes
- → Consumption function shifts down
- House prices plunge.
- Decline in wealth
- → Consumption function shifts down