17
Sulfur Dioxide
17.1 Introduction and terminology
Sulfur dioxide (SO2) has been used for centuries [1] by winemakers as a preservative due to its antimicrobial and antioxidant properties. In wine, the terms “sulfites,” “SO2,” and “sulfur dioxide” are often used interchangeably. From a strict chemical perspective, SO2 refers only to the neutral, volatile species. However, SO2 behaves as a weak, diprotic acid in aqueous environments and the major species at wine pH is generally bisulfite (HSO3−). The major roles of SO2 in wine are summarized below:
- Nucleophile. HSO3− can form covalent adducts with aldehydes and other electrophilic wine components.
- Reducing agent/antioxidant. SO2 is one of the most strongly reducing compounds found in wine. SO2 does not react directly with O2, but instead reacts in the form of HSO3− with byproducts of oxidation. The specific chemistry of HSO3− in this role is discussed in Chapter 24.
- Enzymatic deactivation. SO2, in the form of HSO3−, can inhibit the activity of many enzymes. For example, SO2 inhibits polyphenoloxidase (PPO) activity, slowing the reaction responsible for oxidative browning of musts (Chapter 24).
- Antimicrobial. Molecular SO2 inhibits growth of a wide range of microorganisms, including yeasts and bacteria. The mechanism is likely multitarget and may include reduction of co‐factors and vitamins (NAD+, FAD, thiamin), reduction of disulfide bridges in proteins, and reaction with nucleic acids [2].
SO2 can exist as several species in wine, summarized in Table 17.1. The definitions of these different species are described in more detail later in the chapter.
Table 17.1 Properties of different species of SO2 in wine
| SO2 fraction | Importance | Typical target or constraint (as SO2 equivalents) |
| Molecular | Antimicrobial | Microbial stability: typical targets are in range of 0.6–0.8 mg/L for wines [2] Sensory threshold for irritation: 2 mg/L [3] |
| Free bisulfite (HSO3−) |
Antioxidant Regulatory (less common) |
Preventing wine oxidation: typical target for free SO2 (mostly bisulfite) is 20–40 mg/L Free SO2 is regulated in a few wine regions, e.g., <70 mg/L in Canada |
| Sulfite (SO32−) | Of negligible importance, represents <1% of SO2 species at wine pH | |
| Bound bisulfite adducts | Contributes to total SO2; may have minor antimicrobial activity [4]. Weakly bound adducts can contribute to free SO2 pool following loss of free bisulfite |
|
| Total (free + bound SO2) |
Regulatory | Regulated in most countries: In US, < 350 mg/L for all wines, <10 mg/L for “no sulfites added.” In Australia, <300 mg/L total SO2 for low sugar wines (<35 g/L sugar), and <250 mg/L for sweet wines |
17.2 Acid–base chemistry of SO2
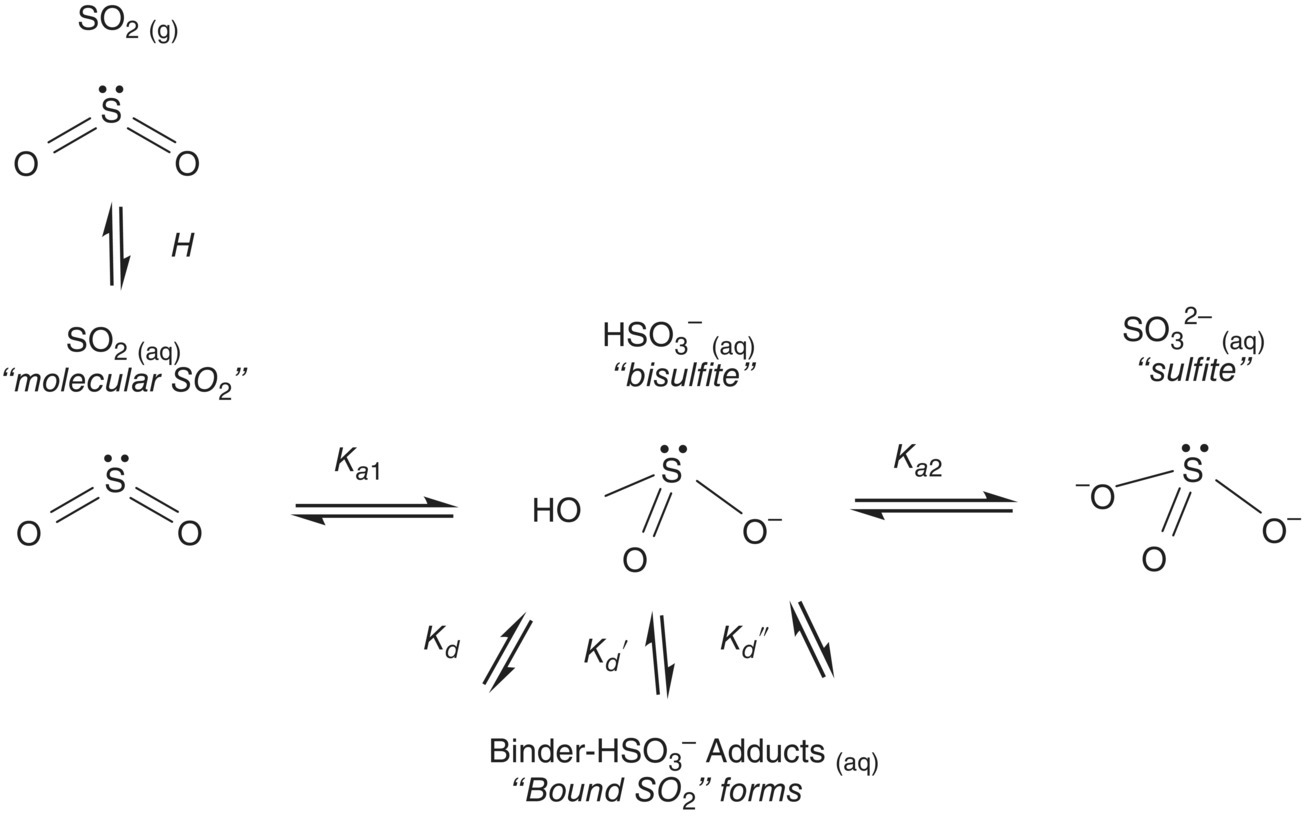
Following hydration under aqueous conditions, SO2 acts as a weak acid and will form conjugate bases (bisulfite, sulfite), as shown in Figure 17.1.

Figure 17.1 Equilibria of sulfur dioxide species. At 20 °C in H2O, pKa1 = 1.8 and pKa2 = 7.0 [5], and Henry’s Law coefficient (H) is 0.38 atm/M [6]
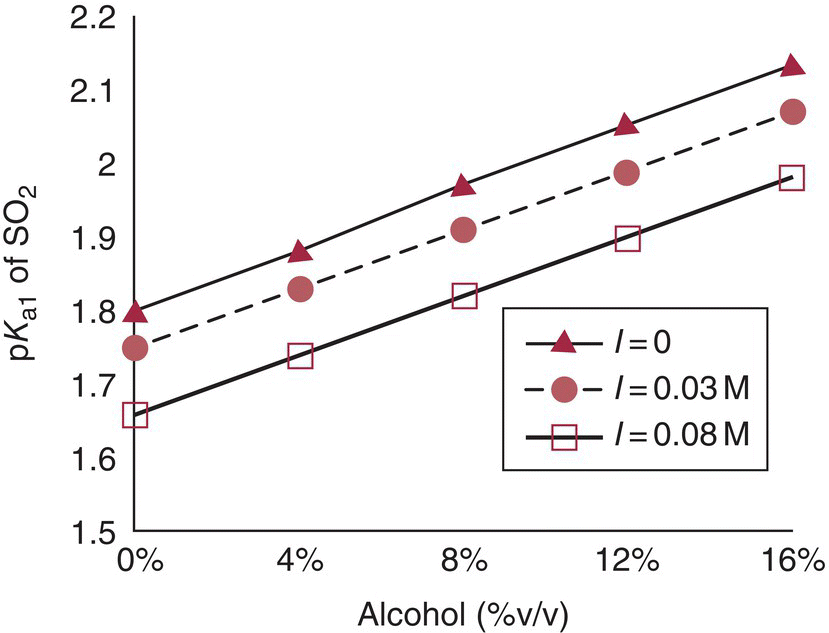
From pKa1 it is possible to calculate the relative concentrations of the different species using the Henderson–Hasselbalch equation (Chapter 3). The pKa1 and pKa2 of SO2 in practical wine texts (~1.8 and 7.0, respectively) are often based on their values at 20 °C in H2O [7]. However, as mentioned in Chapter 3, pKa values for weak acids (including SO2) increase with increasing ethanol and temperature and decrease with increasing ionic strength. Empirically derived correction factors and tables exist for pKa values of SO2 in wine‐like media over a range of temperatures [8]. At 20 °C, for a typical wine alcohol (10–14% v/v) and ionic strength (0.03–0.08 M), pKa1 will be in the range of 1.85–2.00, or 0.05–0.2 units higher than typically used values (Figure 17.2). While this may seem like a trivial difference, an error of 0.1 pH units will lead to a 30% error in molecular SO2, as calculated from Equation (17.1).

Figure 17.2 Effect of alcohol content on pKa1 of SO2 for three different ionic strengths (I), using data shown in Reference [8]. I = 0 corresponds to pure hydroalcoholic solutions, I = 0.03M a typical value from Reference [8], and I = 0.08M a typical value from Reference [9]
At normal wine pH (3–4), the predominant free SO2 species (>90%) will be bisulfite, with minor contributions from the neutral “molecular SO2” form. Concentrations of the sulfite ion (SO32−) are negligible at wine pH and are generally ignored. In winery settings, it is most common to measure so‐called “free SO2” – that is, the sum of molecular SO2 and bisulfite. The relationship between molecular and free SO2 can be derived from the Henderson–Hasselbalch expression:
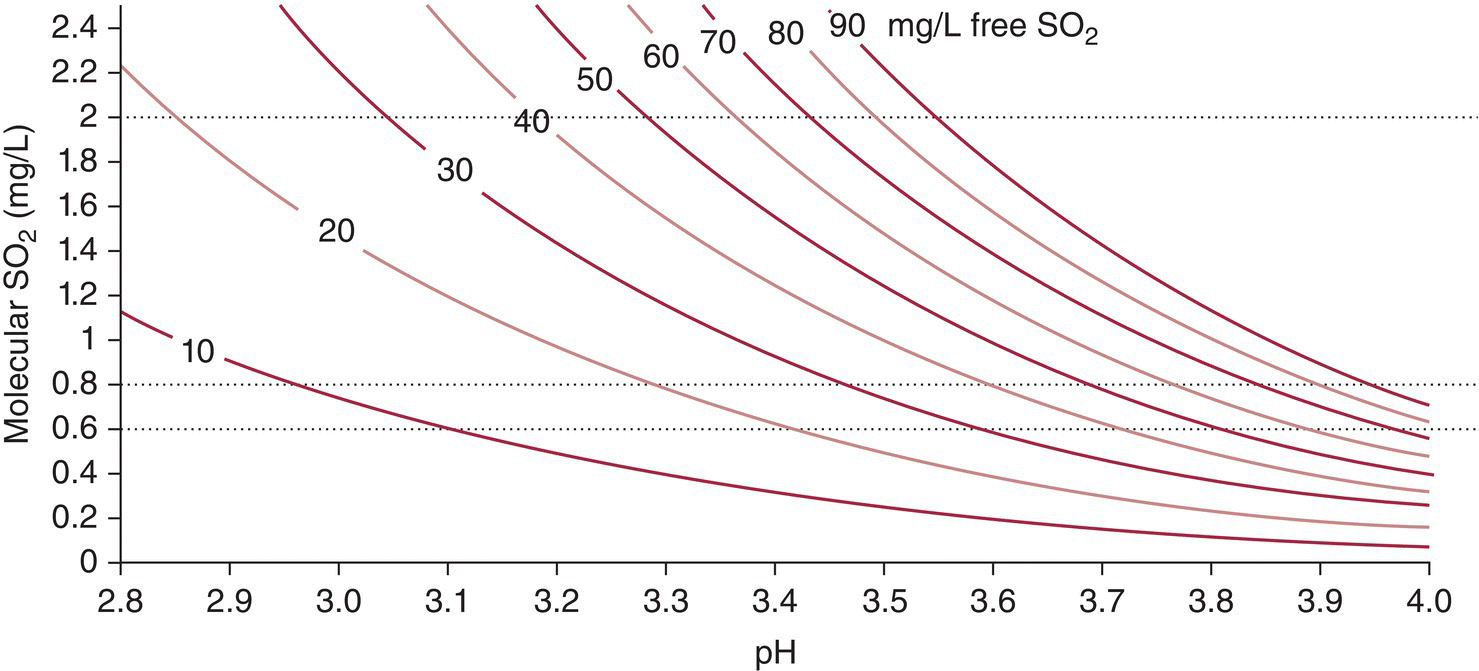
Equation (17.1) can be used to determine the amount of free SO2 necessary to achieve different molecular SO2 concentrations as a function of pH (Figure 17.3). A higher percentage of SO2 will exist in the molecular form at a lower pH than at a higher pH. For example, using, pKa = 1.9 (12% alcohol, 20 °C, I = 0.08 M), the % free SO2 existing as molecular SO2 decreases when going from pH 3 (7.7%) to pH 3.3 (3.8%) to pH 3.6 (1.9%).

Figure 17.3 Iso‐concentration curves for molecular SO2 as a function of pH for different free SO2 concentrations, determined in pure water (pKa =1.8) from the Henderson–Hasselbalch equation. Dotted lines indicate the typical target range for molecular SO2 (0.6–0.8 mg/L) and the sensory threshold (2 mg/L)
As summarized in Table 17.1, free SO2 and molecular SO2 have different roles in wine. Typical targets are 20–40 mg/L free SO2 to avoid oxidation, at least 0.6 mg/L molecular SO2 to prevent microbial spoilage of dry wines, and at least 0.8 mg/L molecular SO2 to prevent spoilage of sweet wines. The sensory threshold of molecular SO2 is 2 mg/L, so winemakers usually aim to have molecular SO2 below this level. These constraints are particularly challenging to achieve simultaneously in wines with low pH values. As shown in Figure 17.3, a pH 2.9 wine would need to have a free SO2 level < 20 mg/L (risking oxidation) to achieve a molecular SO2 < 2 mg/L (below the sensory threshold).
17.3 Sulfonate adducts, “bound SO2,” and antioxidant effects
HSO3− is a “soft” nucleophile that will readily form covalent adducts with soft electrophiles to yield sulfonates. The formation of the adduct results in a decrease in the activity of both the SO2 fraction and the electrophile. The equilibrium between electrophiles and their bisulfite adducts is often represented as a dissociation rather than a formation (Figure 17.4). Kd values in aqueous systems have been determined for the major SO2 binding species in wine, as well as for lower concentration odorants capable of binding (Table 17.2).

Figure 17.4 Equilibrium of bisulfite with electrophilic binders
Table 17.2 Dissociation constants (Kd) for important SO2 binding electrophiles (E) from References [10] to [12]
| Major SO2 binders | Other odor‐active SO2 binders | ||
| E | Kd (M−1) | E | Kd (M−1) |
| Glucose | 2.2 × 10⁻¹ | ||
| Fructose | 1.5 | ||
| Acetoin | 8.0 × 10⁻² | Diacetyl | 1.4 × 10⁻⁴ |
| Galacturonic acid | 1.6 × 10⁻² | β‐Damascenone | Unknown |
| α‐Ketoglutarate | 4.9 × 10⁻⁴ | β‐Ionone | 2.1 × 10⁻⁴ |
| Pyruvate | 1.4 × 10⁻⁴ | Hexanal (E)‐2‐Pentenal |
3.5 × 10⁻⁶ 8.3 × 10⁻³ |
| Acetaldehyde | 1.5 × 10⁻⁶ | (E)‐2‐Nonenal | Unknown |
| Anthocyanina | 1 × 10⁻⁵ | ||
a For flavylium form of cyanidin‐3‐glucoside [5].
Kd values can vary considerably in the literature – sometimes by as much as a factor of 10 – potentially due to approaches used to quantify free SO2. Furthermore, these values will vary with temperature, ethanol content, and other factors. However, some general conclusions can be drawn. With the exception of anthocyanins, whose reactions with SO2 were discussed in Chapter 16, the most important SO2 binders in wine (those with the smallest Kd values) are carbonyl compounds, and particularly saturated aldehydes like acetaldehyde. The presence of electron‐donating groups or conjugation adjacent to the carbonyl will increase Kd. Bisulfite addition to carbonyls may occur at one of two sites, shown in Figure 17.5:
- Direct nucleophilic addition to the carbonyl group (1,2‐addition) – observed for saturated carbonyls like acetaldehyde.
- Michael addition, observed for unsaturated conjugated carbonyls (1,4‐addition), for example, (E)‐2‐alkenals and β‐damascenone.

Figure 17.5 Examples of bisulfite adduct formation to the carbonyl group of a saturated aldehyde (acetaldehyde) and via a 1,4‐Michael addition to an unsaturated aldehyde ((E)‐2‐nonenal)
SO2 binders can be classified as “weak” or “strong” based on the dissociation constant. The distinction is somewhat arbitrary, but generally SO2 binders with Kd < 1 × 10‐5 are referred to as strong binders, which equates to greater than 95% in the bound form for typical free SO2 concentrations in bottled wine (20–40 mg/L, or about 0.5 mM). In white wines, the only strong SO2 binder is acetaldehyde, while other species (pyruvic acid, ketoglutarate) will be weak binders. In red wines, some anthocyanins likely act as strong binders, but this evaluation is complicated by the large number of compounds and pH dependence of anthocyanin species (Chapter 16). Using Kd it is possible to calculate the relative distributions of bound and free forms for a given binder in a wine and to predict the amount of binding that will occur following addition or removal of a binder or SO2 to solution (Table 17.3). The major SO2 binder in most wines is acetaldehyde, due to its strong binding properties and relatively high concentrations [13]. One exception may be in some sweet wines (or musts), where glucose concentrations can exceed 50 g/L. At these concentrations, about 50% of the total SO2 will be bound to glucose.
Table 17.3 Concentrations of major SO2 binders in white wine, from data on 127 white wines from Reference [13]
| SO2 binder | Mean concentration (mg/L) | % of binder in bound form, calculateda | % of bound SO2 accounted for, calculateda |
| Acetaldehyde | 40 ± 3 | 99.6 | 71.5 ± 4.3 |
| Pyruvic acid | 25 ± 2 | 77 | 16.7 ± 1.6 |
| α‐Ketoglutaric acid | 31 ± 3 | 49 | 7.6 ± 0.9 |
| Galacturonic acid | 267 ± 13 | 2.8 | 2.7 ± 0.2 |
| Glucose | 4750 ± 648 | 0.22 | 1.5 ± 0.3 |
| Total = 100% Mean = 81.2 mg/L of bound SO2 |
a Calculations on SO2 binding are based on a wine containing the mean values of the binders listed in this table, 30 mg/L free SO2. Kd values are from Table 17.2.
As described in subsequent chapters (Chapter 24), free bisulfite can be lost following wine oxidation, either by reaction with H2O2 or by forming adducts with acetaldehyde or other electrophiles. SO2 adduct formation is reversible and thus formation and dissociation reactions are happening continuously. Figure 17.6 illustrates how SO2 species in a wine will redistribute following an oxidative event (e.g., addition of H2O2 to a wine) which will decrease both the bisulfite and molecular SO2 pools. Eventually, the weakly bound SO2 adducts will hydrolyze, resulting in a partial replenishment of the free SO2 forms. Thus, weakly bound SO2 can be thought of as a reservoir of free SO2, which can provide some antioxidant protection beyond the “true” free SO2 concentration, albeit at very low concentrations of free SO2.

Figure 17.6 Schematic of different SO2 pools in a hypothetical white wine before and after oxidation
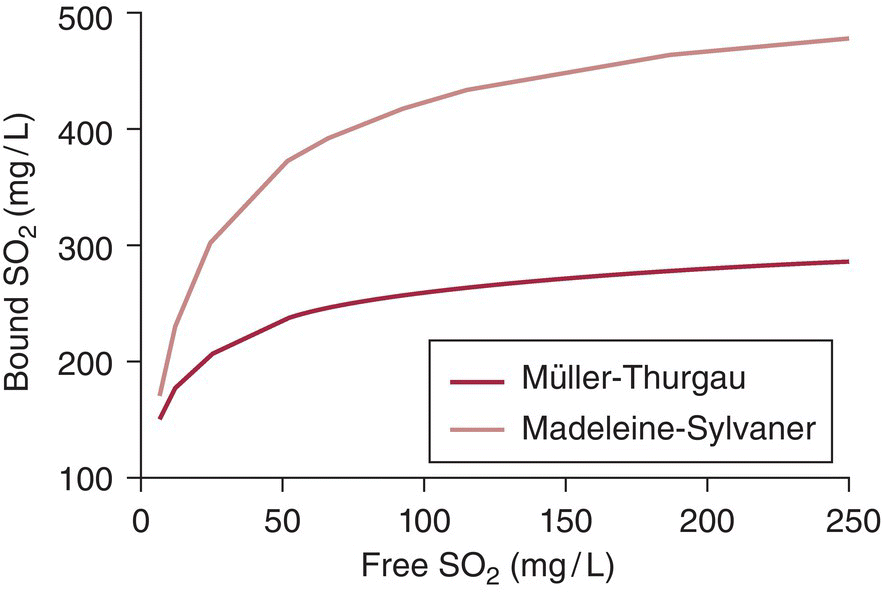
Because there are SO2 binding compounds in wine of varying strength, addition of SO2 to a wine will result in a non‐quantitative and somewhat unpredictable increase in free SO2 (see Figure 17.7). Initial additions of SO2 to a newly fermented wine are typically on the order of 50 mg/L, and it is not uncommon for more than half of this addition to become bound, especially if high concentrations of free acetaldehyde are present. Further addition of SO2 will result in increasing proportions of free versus bound SO2 as pools of SO2 binders become saturated.

Figure 17.7 Changes in bound SO2 concentration following additions of free SO2 for two representative wines (Muller‐Thurgau and Madeleine‐Sylvaner).
Data from Reference [11]
17.4 Typical sources and concentrations of SO2 in wine
Even in wines without SO2 additions, low amounts of total SO2 (typically 10–20 mg/L) are present at the end of alcoholic fermentation as a result of SO2 formation during amino acid biosynthesis [14] (Chapter 22.3). Concentrations of free SO2 at the end of fermentation are often below detection limits, since most SO2 added or released as a result of yeast biosynthesis will be bound to acetaldehyde and other fermentation metabolites. Typically, for every 10 mg/L addition of SO2, a 5 mg/L increase in total SO2 will be observed at the end of fermentation due to binding to acetaldehyde [15]. Pre‐fermentation SO2 additions will thus also result in higher concentrations of aldehydes post‐fermentation.
However, in most wines, the majority of SO2 is added exogenously either before or after fermentation, often in the form of potassium metabisulfite (KMBS) or as SO2 gas (Chapter 27). Average total concentrations of SO2 in commercial wines are about 80 mg/L and 60 mg/L for white and red wines, respectively [16]. Despite some anecdotes to the contrary, white wines on average have higher total concentrations of SO2 than red wines. White wines are on average bottled with higher SO2 either because they are more likely to contain residual sugar or because oxidation has more deleterious effects on the aroma and color of white wines than on red wines. Furthermore, acetaldehyde, the most important binder, is on average at higher concentrations in white wines than in red wines (40 versus 25 mg/L) [15].
17.5 Measurement of molecular, free, and total SO2
In winery settings, the free and molecular SO2 concentrations are likely to be determined routinely (on a weekly or monthly basis) as a quality control measure. There are three general approaches to measure free and molecular SO2 summarized below. More detailed explanations of these techniques can be found in wine analysis textbooks, for example, References [17] and [18].
- Perform titrimetric or colorimetric analysis in which oxidizing reagents are added directly to the wine. The best known of these methods is iodometric titration with the endpoint determined by a starch indicator (“Ripper method”) or potentiometer.
- Acidify a sample to convert to molecular SO2, and then isolate and quantify molecular SO2. The best known of these methods is aeration‐oxidation (A‐O), in which SO2 in an acidified sample is distilled into a receiver flask containing hydrogen peroxide to generate sulfuric acid, which can then be titrated.
- Separate and quantify a free SO2 form (molecular or bisulfite) without pH adjustment or dilution. These methods are not widely practiced in the wine industry, and include capillary electrophoresis of HSO3− or quantification of headspace SO2 using GC‐MS or colorimetric methods [6].
Methods that involve dilution, pH changes, and/or rely on the destruction of free SO2 (approaches A or B) likely overestimate free SO2, since weakly bound SO2 adducts will dissociate and be measured as free. The dissociation of bound acetaldehyde reportedly has a half‐life about an order of magnitude longer than weak adducts, particularly anthocyanin‐bisulfite adducts (1.5 h versus ~10 min) [5, 19]. As a result, the major methods used in the wine industry appear to overestimate free SO2 in real wines – by an average of 15% in white wines and by a factor of 2 in red wines [6]. The reason for the severe measurement error in red wines is likely due to dissolution of anthocyanin‐bisulfite adducts. For typical SO2 concentration and pH values (3.0–3.8) approximately 70–85% of monomeric anthocyanins are reported to be bound [20] and, as mentioned above, these adducts can dissociate relatively quickly during analysis.
The ramifications of these incorrect measurements are still unknown. A‐O (Approach B) and related methods are possibly better suited than non‐disrupting methods for predicting the antioxidant capacity of SO2 in a wine because weakly bound forms will partially replenish free SO2 pools. However, the anthocyanin‐bisulfite fraction measured by A‐O and other classic methods has negligible antimicrobial activity, and thus these methods appear to be poorly suited for predicting red wine microbial stability [21]. In spite of these problems, A‐O and related methods (e.g., flow‐injection analysis) are reproducible across labs [22]. Analysis of aldehydes and ketones can have complementary problems when SO2 is present, as described previously (Chapter 9).
Total SO2 can be determined by disrupting bound SO2 forms prior to or during analysis with any of the aforementioned methods. This can be accomplished by treatment of the sample with base to favor SO32‐ and hydrolyze adducts prior to sample acidification (used with iodometric titrations) or heating the sample to disrupt adducts (used in A‐O).
17.6 Sensory effects
The aqueous form of molecular SO2 is in equilibrium with its volatilized form, with a Henry’s Law coefficient of H = 0.38 atm M−1 or Kg,l = 0.016 at 21 °C in H2O [6]. Volatilized SO2 can cause an “irritating, burning” sensation in the nose, and the sensory threshold for molecular SO2 in wine is reportedly 2 mg/L [3]. HSO3− and bound SO2 forms are reported to have minimal direct sensory effects. However, there is an important indirect effect of SO2 binding – many odor active compounds are carbonyl compounds, and their bound sulfonate forms will be non‐volatile. This binding may be desirable, as is often the case for acetaldehyde and other aldehydes with oxidative aromas, but it may also mean loss of aroma activity for more pleasant smelling compounds, for example, the fruity smelling β‐damascenone (Chapter 8) [23].
References
- 1. McGovern, P.E. (2003) Ancient wine: the search for the origins of viniculture, Princeton University Press, Princeton, NJ.
- 2. Fugelsang, K.C. and Edwards, C.G. (2007) Wine microbiology practical applications and procedures, Springer, New York.
- 3. Ribereau‐Gayon, P., Glories, Y., Maujean, A., Dubourdieu, D. (2006) Handbook of enology, Vol. 2, The chemistry of wine stabilization and treatments, 2nd edn, John Wiley & Sons, Chichester, UK.
- 4. Wells, A. and Osborne, J.P. (2012) Impact of acetaldehyde‐ and pyruvic acid‐bound sulphur dioxide on wine lactic acid bacteria. Letters in Applied Microbiology, 54 (3), 187–194.
- 5. Brouillard, R. and El Hage Chahine, J.M. (1980) Chemistry of anthocyanin pigments. 6. Kinetic and thermodynamic study of hydrogen sulfite addition to cyanin – formation of a highly stable Meisenheimer‐type adduct derived from a 2‐phenylbenzopyrylium salt. Journal of the American Chemical Society, 102 (16), 5375–5378.
- 6. Coelho, J.M., Howe, P.A., Sacks, G.L. (2015) A headspace gas detection tube method for measurement of SO2 in wine without disruption of sulfur dioxide equilibria. American Journal of Enology and Viticulture, 66 (3), 257–265.
- 7. Zoecklein, B.W., Fugelsang, K.C., Gump, B.H., Nury, F.S. (1999) Wine analysis and production, Kluwer Academic/Plenum Publishers, New York.
- 8. Usseglio‐Tomasset, L. and Bosia, P. (1984) La prima costante di dissociazione dellʼacido solforoso [nei vini]. Vini dʼItalia, 26 (5), 7–14.
- 9. Abguéguen, O. and Boulton, R.B. (1993) The crystallization kinetics of calcium tartrate from model solutions and wines. American Journal of Enology and Viticulture, 44 (1), 65–75.
- 10. Blouin, J. (1966) Contribution to study of binding of sulphur dioxide in musts and wines. Annales de Technologie Agricole, 15 (3), 223–287.
- 11. Burroughs, L.F. and Sparks, A.H. (1973) Sulphite‐binding power of wines and ciders. I. Equilibrium constants for the dissociation of carbonyl bisulphite compounds. Journal of the Science of Food and Agriculture, 24 (2), 187–198.
- 12. de Azevedo, L.C., Reis, M.M., Motta, L.F., et al. (2007) Evaluation of the formation and stability of hydroxyalkylsulfonic acids in wines. Journal of Agricultural and Food Chemistry, 55 (21), 8670–8680.
- 13. Jackowetz, J.N. and Mira de Orduña, R. (2013) Survey of SO2 binding carbonyls in 237 red and white table wines. Food Control, 32 (2), 687–692.
- 14. Fleet, G.H. (1993) Wine microbiology and biotechnology, Harwood Academic Publishers, Chur, Philadelphia, PA.
- 15. Jackowetz, J.N., Dierschke, S., de Orduna, R.M. (2011) Multifactorial analysis of acetaldehyde kinetics during alcoholic fermentation by Saccharomyces cerevisiae. Food Research International, 44 (1), 310–316.
- 16. Peterson, G.F., Kirrane, M., Hill, N., Agapito, A. (2000) A comprehensive survey of the total sulfur dioxide concentrations of American wines. American Journal of Enology and Viticulture, 51 (2), 189–191.
- 17. Zoecklein, B.W., Fugelsang, K.C., Gump, B.H., Nury, F.S. (1995) Wine analysis and production, Chapman & Hall, New York.
- 18. Iland, P. (2004) Chemical analysis of grapes and wine: techniques and concepts. Patrick Iland Wine Promotions Pty Ltd, Campbelltown, SA, Australia.
- 19. Boulton, R.B., Singleton, V.L., Bisson, L.F., Kunkee, R.E. (1999) Principles and practices of winemaking, Kluwer Academic/Plenum Publishers, New York.
- 20. Usseglio‐Tomasset, L., Ciolfi, G., di Stefano, R. (1982) The influence of the presence of anthocyanins on the antiseptic activity of sulfur dioxide towards yeasts. Vini dʼItalia, 24 (137), 86–94.
- 21. Howe, P.A. (2015) Re‐thinking free and molecular sulfur dioxide measurements in wine. PhD Thesis, Department of Food Science, Cornell University, Ithaca, NY.
- 22. Sullivan, J.J., Hollingworth, T.A., Wekell, M.M., et al. (1990) Determination of free (pH 2.2) sulfite in wines by flow injection analysis: collaborative study. Journal of the Association of Official Analytical Chemists, 73 (2), 223–226.
- 23. Daniel, M.A., Elsey, G.M., Capone, D.L., et al. (2004) Fate of damascenone in wine: the role of SO2. Journal of Agricultural and Food Chemistry, 52 (26), 8127–8131.
