When you need as much debugging muscle as Flash can provide, click Debug→Debug Movie→in Flash Professional. You may think you've fired up a different program, but actually, Flash has merely closed some panels, opened others, and rearranged your view of your animation (Figure 19-17). It also automatically compiles and runs your animation. Your first visit to the debugger can be a little intimidating, but don't worry. Look around for familiar landmarks, and you'll soon figure out the purposes of the multiple panels and the messages within:
The Debug Console in the upper-left corner shows buttons (Figure 19-16). You use these to move through your code and to end the debug session. You can also open the Debug Console using menus: Window→Debug Panels→Debug Console.
The Variables panel below the Debug Console is where you really learn what's going on in your program. As you work in the debugger, you'll see variable and object names here, along with their related values. There are probably a lot of unfamiliar words in there, because this panel keeps track of every property for every object in your animation. You don't need to worry about many of these, because Flash takes care of them perfectly well. But when something goes wrong, look up the name of the offending text box, variable name, or object in this list, and you'll be on your way to a solution. You can also open the Variables panel using menus: Window→Debug Panels→Variables.
In the upper-right corner, the Scene/Symbol panel is pretty straightforward. It tracks your animation's current position in the main timeline, scene, or symbol timeline. You see the name of the scene or symbol, the layer that contains code, and the frame number.
The middle panel shows the ActionScript code you wrote, similar to the Actions panel. You can force your program to stop at certain places in your code to give you a chance to inspect the inner workings of the objects. More on that in the next section.
At the bottom is the Output panel, covered earlier in this chapter (Using the Output Panel and trace() Statement). If you've used the trace() statement while you were writing code and experimenting with ActionScript, you know how helpful the Output panel can be.

One of the most important debugging tools in any well-stocked ActionScript programmer's arsenal is the breakpoint. A breakpoint is an artificial stopping point—sort of a roadblock—that you can insert into your ActionScript code to stop Flash Player in its tracks. Setting breakpoints lets you examine your animation at different points during playback so that you can pinpoint where a bug first happens.
Flash lets you set breakpoints at specific lines in your ActionScript code. Setting a breakpoint lets you play the animation only up until Flash encounters that breakpoint. The instant Flash encounters a line with a breakpoint, it immediately stops the animation so that you can either examine object property values (as described in the previous section) or step through the remaining code in your action slowly, line by line, watching what happens as you go.
Setting breakpoints is a great way to track down logic errors in your ActionScript code. For example, say you've created a chunk of code containing a lot of if and switch conditionals or while and for looping statements. Stopping playback just before you enter that long stretch of code lets you follow Flash as it works through the statements one at a time. By stepping through statements in the order Flash actually executes them (as opposed to the order you thought Flash was supposed to execute them), you may find, for example, that the cause of your problem is that Flash never reaches the else section of your if…else statement, or never performs any of the statements inside your while block because the while condition is never met.
Note
For more information on using if…else, do…while, and other logical statements in ActionScript, check out Colin Moock's Essential ActionScript 3.0, and ActionScript 3.0 Cookbook, by Joey Lott, et al. Both books have detailed coverage of more advanced ActionScript topics that are beyond the scope of this book.
So far, this chapter has shown how to clean up the buggy code in the file 19-1_Debug_Code.fla. In this section, you can make further improvements to the animation while learning how to stop your animation and code in its tracks and examine individual properties using the debugger.
Note
This example continues debugging the file 19-1_Debug_Code.fla. The entire process began on Checking with the Syntax Checker.
To get started, follow these steps:
With 19-1_Debug_Code.fla open in Flash, click Debug→Debug Movie.
A Flash Player window opens and begins playing your animation. The panels in Flash change to show the Debug Console, the Variables panel, the Scene/Symbol panel, your code, and the Output panel. There's no information showing in either the Debug Console or the Variables panel at this point. If you followed the steps in the previous example, some information appears in the Output panel.
In the Flash Player window, select the Play toggle, Ctrl+Enter (⌘-Return on a Mac).
The animation stops playing.
In the panel with the ActionScript code, click to the left of the line numbers 11 and 12.
A red dot appears next to the line number, indicating a breakpoint. These dots appear next to the lines:
var ptStart:Point = new Point(Math.random() * 550,Math.random() * 400);
var ptEnd:Point = new Point(Math.random() * 550,Math.random() * 400);
In the Flash Player window, press Ctrl+Enter (⌘-Return on a Mac).
The Flash Player may be hidden by the debugger. If necessary, use Alt+Tab (or ⌘-Tab on a Mac) to bring it to the front. When you press Ctrl+Enter (⌘-Return), the animation runs for a moment, and then stops. A small arrow appears in the breakpoint next to line 11, indicating that the animation is at this point in the ActionScript code. You see more details in both the Debug Console (Figure 19-17) and the Variables panel.
Figure 19-17. Here, the Debug Console shows two items: the main timeline and the drawRandomLine() method. Using the buttons at the top of the console you can start and stop your animation and the processing of ActionScript code.
There are two items displayed in the Debug Console. You may need to drag the right edge of the panel to read the entire lines. The line at the top references the drawRandomLine() method in your code. The bottom line references the main timeline in the animation. When you click different items in the Debug Console, the items listed below in the Variables panel change. Click the top line before examining the Variables panel in the next step.
In the Variables panel, click the expand button next to the word "this", and then scroll the panel to view all the variables.
Initially, there are three items in the variables panel: this, ptStart, and ptEnd. This refers to the main timeline; ptStart and ptEnd are variables inside the drawRandomLine() function. At this point, the value for both variables is undefined. When you click the + button next to this, a list expands beneath, showing all the properties and variables related to the main timeline. Some of the items are familiar, like alpha, height, and width. Others may be a bit mysterious, especially if they're properties you haven't yet used in ActionScript. In Flash, there are a lot of preset values, which you may never need to worry about. If you look carefully in the list, you find the names of the text fields in your animation: txtStartX, txtStartY, txtEndX, and txtEndY.
Click a second time to close the list.
The lists closes, leaving just the three items showing: this, ptStart, and ptEnd.
Click the green Continue button in the Debug Console.
Flash moves ahead just one step in the code because there's a breakpoint at line 12. In the Variables panel, you see that the ptStart item has changed. The value is no longer undefined; there's some weird-looking text and numbers there. And there's an expand button next to the name.
When you place a breakpoint in your code, the debugger stops before that line is executed. That's why, with a breakpoint at line 12, ptStart has newly assigned values, but ptEnd is still undefined.
Click the expand button next to ptStart and examine its properties.
As explained on What's the Point?, the Point class has three properties: length, x, and y. Now that ptStart is defined, the variables panel shows values for each. More of those are really long decimal numbers.
Double-click the x value for ptStart and type 300. Then, double-click the y value and type 200.
One of the extremely handy features of the Debugger is that you can change values of properties when the animation is stopped at a breakpoint.
Click the green Continue button.
The animation movies through its two frames, and then it runs the drawRandomLine() method again. It stops again at line 11 in the code.
Examine the animation in the Flash Player window.
The two text fields at the top of the animation show the values you entered in the Variables panel: 300 and 200, as shown in Figure 19-18. This small test proves that if you round the numbers to whole numbers, they'll fit in the text fields.
In the Debug Console, click the red X, also known as the End Debug Session button.
Flash restores your project to its appearance before you entered the debugger.
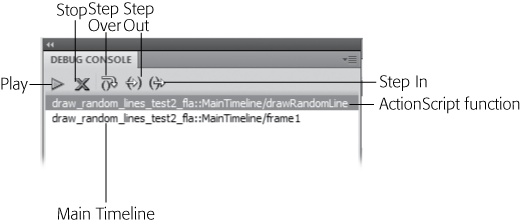
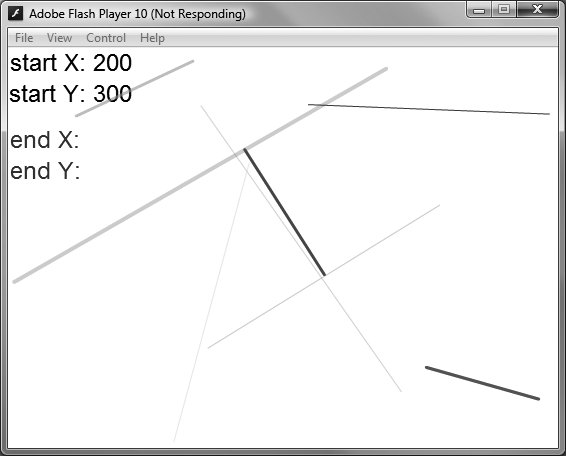
Figure 19-18. When you change values in the Debugger, you can see the results in your animation. Here, the values for two of the text fields have been changed. Before the change, the numbers were too long to be displayed by the text fields.
So, one solution to making the numbers fit in the text fields is to round them off to whole numbers. You can do that with another method that's part of the Math class. Here's what the finished code looks like. The two bold lines show the changes using the Math.round() method.
var sprtLines:Sprite = new Sprite(); drawRandomLine(); addChild(sprtLines); function drawRandomLine():void {var ptStart:Point = new Point(Math.round(Math.random() * 550),Math.round(Math.random() * 400));var ptEnd:Point = new Point(Math.round(Math.random() * 550),Math.round(Math.random() * 400));sprtLines.graphics.lineStyle(Math.random()*5,Math.random()*0xFFFFFF, Math.random()); sprtLines.graphics.moveTo(ptStart.x,ptStart.y); sprtLines.graphics.lineTo(ptEnd.x,ptEnd.y); txtStartX.text = "start X: " + ptStart.x; trace("start X: " + ptStart.x); txtStartY.text = "start Y: " + ptStart.y; txtEndX.text = "end X: " + ptEnd.x; txtEndY.text = "end Y: " + ptEnd.y; }
Now the animation runs as it was intended. It draws lines that are random in position, color, thickness, and transparency. The x/y coordinates for the start and end points of the lines are shown in upper-left corner of the animation. Not only do the whole numbers fit in the text fields, but they're also a little easier to discern than the monster decimals. The debugged version of the animation is in the Missing CD (www.missingmanuals.com/cds), named 19-2_Debug_Code_done.fla.