SCIENCE
SCIENCE
GLOSSARY
anthropogenic Event or phenomenon that is caused by humans, for example climate change.
blind analysis Conducted where researchers cannot see the correct measurements or answers; aims to minimize bias.
causal relationship If a change in one variable directly causes a change in another variable, a causal relationship exists between them.
correlation Two variables are correlated if a change in one is associated with a change in the other. A positive correlation exists if one variable increases as the other increases, or if one variable decreases as the other decreases. A negative correlation exists if one variable increases as the other decreases.
data set A set of information stored in a structured and standardized format; might contain numbers, text, images or videos.
debugging Finding and correcting errors in computer code.
diagnostics Identification of problems, typically human diseases or health conditions; also refers to the identification of computer bugs.
DNA The genetic code that governs the development, characteristics and functioning of every living organism. DNA is usually found in the nucleus of a cell, and consists of two long chains of building blocks called ‘nucleotides’, arranged in a double helix shape. In most humans, an individual’s genome, or genetic code, is unique. Recent advances in genetic engineering have enabled the insertion, deletion and modification of genetic material in DNA.
epidemiological evidence Correlation between exposure to a risk factor, such as smoking, and incidence of a disease, such as lung cancer.
experimental design The process of designing robust studies and experiments, to ensure that any conclusions drawn from the results are reliable and statistically significant. This includes careful selection of experimental subjects to avoid sampling bias, deciding on a sample size, and choosing suitable methods for analysing results.
gene editing Process of editing the genome of a living organism by inserting, removing or modifying its DNA.
genome Genetic material, or chromosomes, present in a particular organism. The human genome consists of 23 pairs of chromosomes.
greenhouse gas A gas in the atmosphere which absorbs and radiates energy, contributing to the warming of Earth’s surface. This causes the so-called ‘greenhouse effect’, which is necessary for supporting life on Earth. Human activity has led to an increase in greenhouse gases in the atmosphere, which have amplified the greenhouse effect and contributed to global warming. Greenhouse gases include water vapour, carbon dioxide and methane.
independent replication Validation of a study or experiment by independent researchers. This is done by repeating the procedure followed by the original researchers, to ensure the results can be replicated.
randomized trials Experimental design where participants or subjects are randomly allocated to treatment groups. For example, participants in a randomized drug trial could be randomly allocated to a group where they would either receive a placebo or a drug.
trendlines A way of visualizing the overall direction, or trend, of a variable over time. There are different methods for calculating trendlines, including a moving average, or a line of best fit calculated through linear regression.
CERN & THE HIGGS BOSON
the 30-second data
In 1964, Peter Higgs, Francois Englert, Gerald Guralnik, C.R. Hagen and Tom Kibble proposed the Higgs Mechanism to explain how mass was created in the universe. But evidence of the mechanism lay in the (elusive) discovery of an essential particle, dubbed ‘Higgs boson’, from which other fundamental particles derived their mass. By blasting particles into each other at incredibly high energies and then gathering data on the number of emergent particles as a function of particle energy, scientists hoped to identify spikes (in collisions at particular energy levels), which in turn would point to the creation of a particle, such as the Higgs boson, with that energy. Enter CERN, the world-famous European laboratory. Here, scientists built the Large Hadron Collider (LHC). Even in its infancy (2008), LHC’s enormous capability was stunning: it was able to accelerate particles to about 14 billion times their energy at rest. By 2011, CERN had collected enough data – over 500 trillion collision events – for analysis. Not long after, several independent groups caught an energy spike in the very field where the Higgs was predicted to lie. This discovery was soon acknowledged by the scientific community, and both Higgs and Englert won acclaim as joint recipients of the 2013 Nobel Prize for Physics.
3-SECOND SAMPLE
CERN, a laboratory in Switzerland, is synergy of multinational proportions: here, top scientists convene to inspect and decode the constituents of matter via particle colliders, i.e. how the universe works.
3-MINUTE ANALYSIS
The LHC in CERN is connected to four separate detectors into which highly accelerated particles can be slammed. For the Higgs boson experiments, two detectors, ATLAS and CMS, were used. The fact that the same results were observed on both detectors lent significant credibility to the Higgs discovery, once again emphasizing the importance of independent replication in data analysis.
RELATED TOPIC
See also
3-SECOND BIOGRAPHIES
PETER HIGGS
1929–
First proposed the Higgs Mechanism.
FRANCOIS ENGLERT
1932–
Also proposed the Higgs mechanism, independently of Higgs.
30-SECOND TEXT
Aditya Ranganathan
The reach of data science knows no bounds, being applied to explain the very workings of the universe.

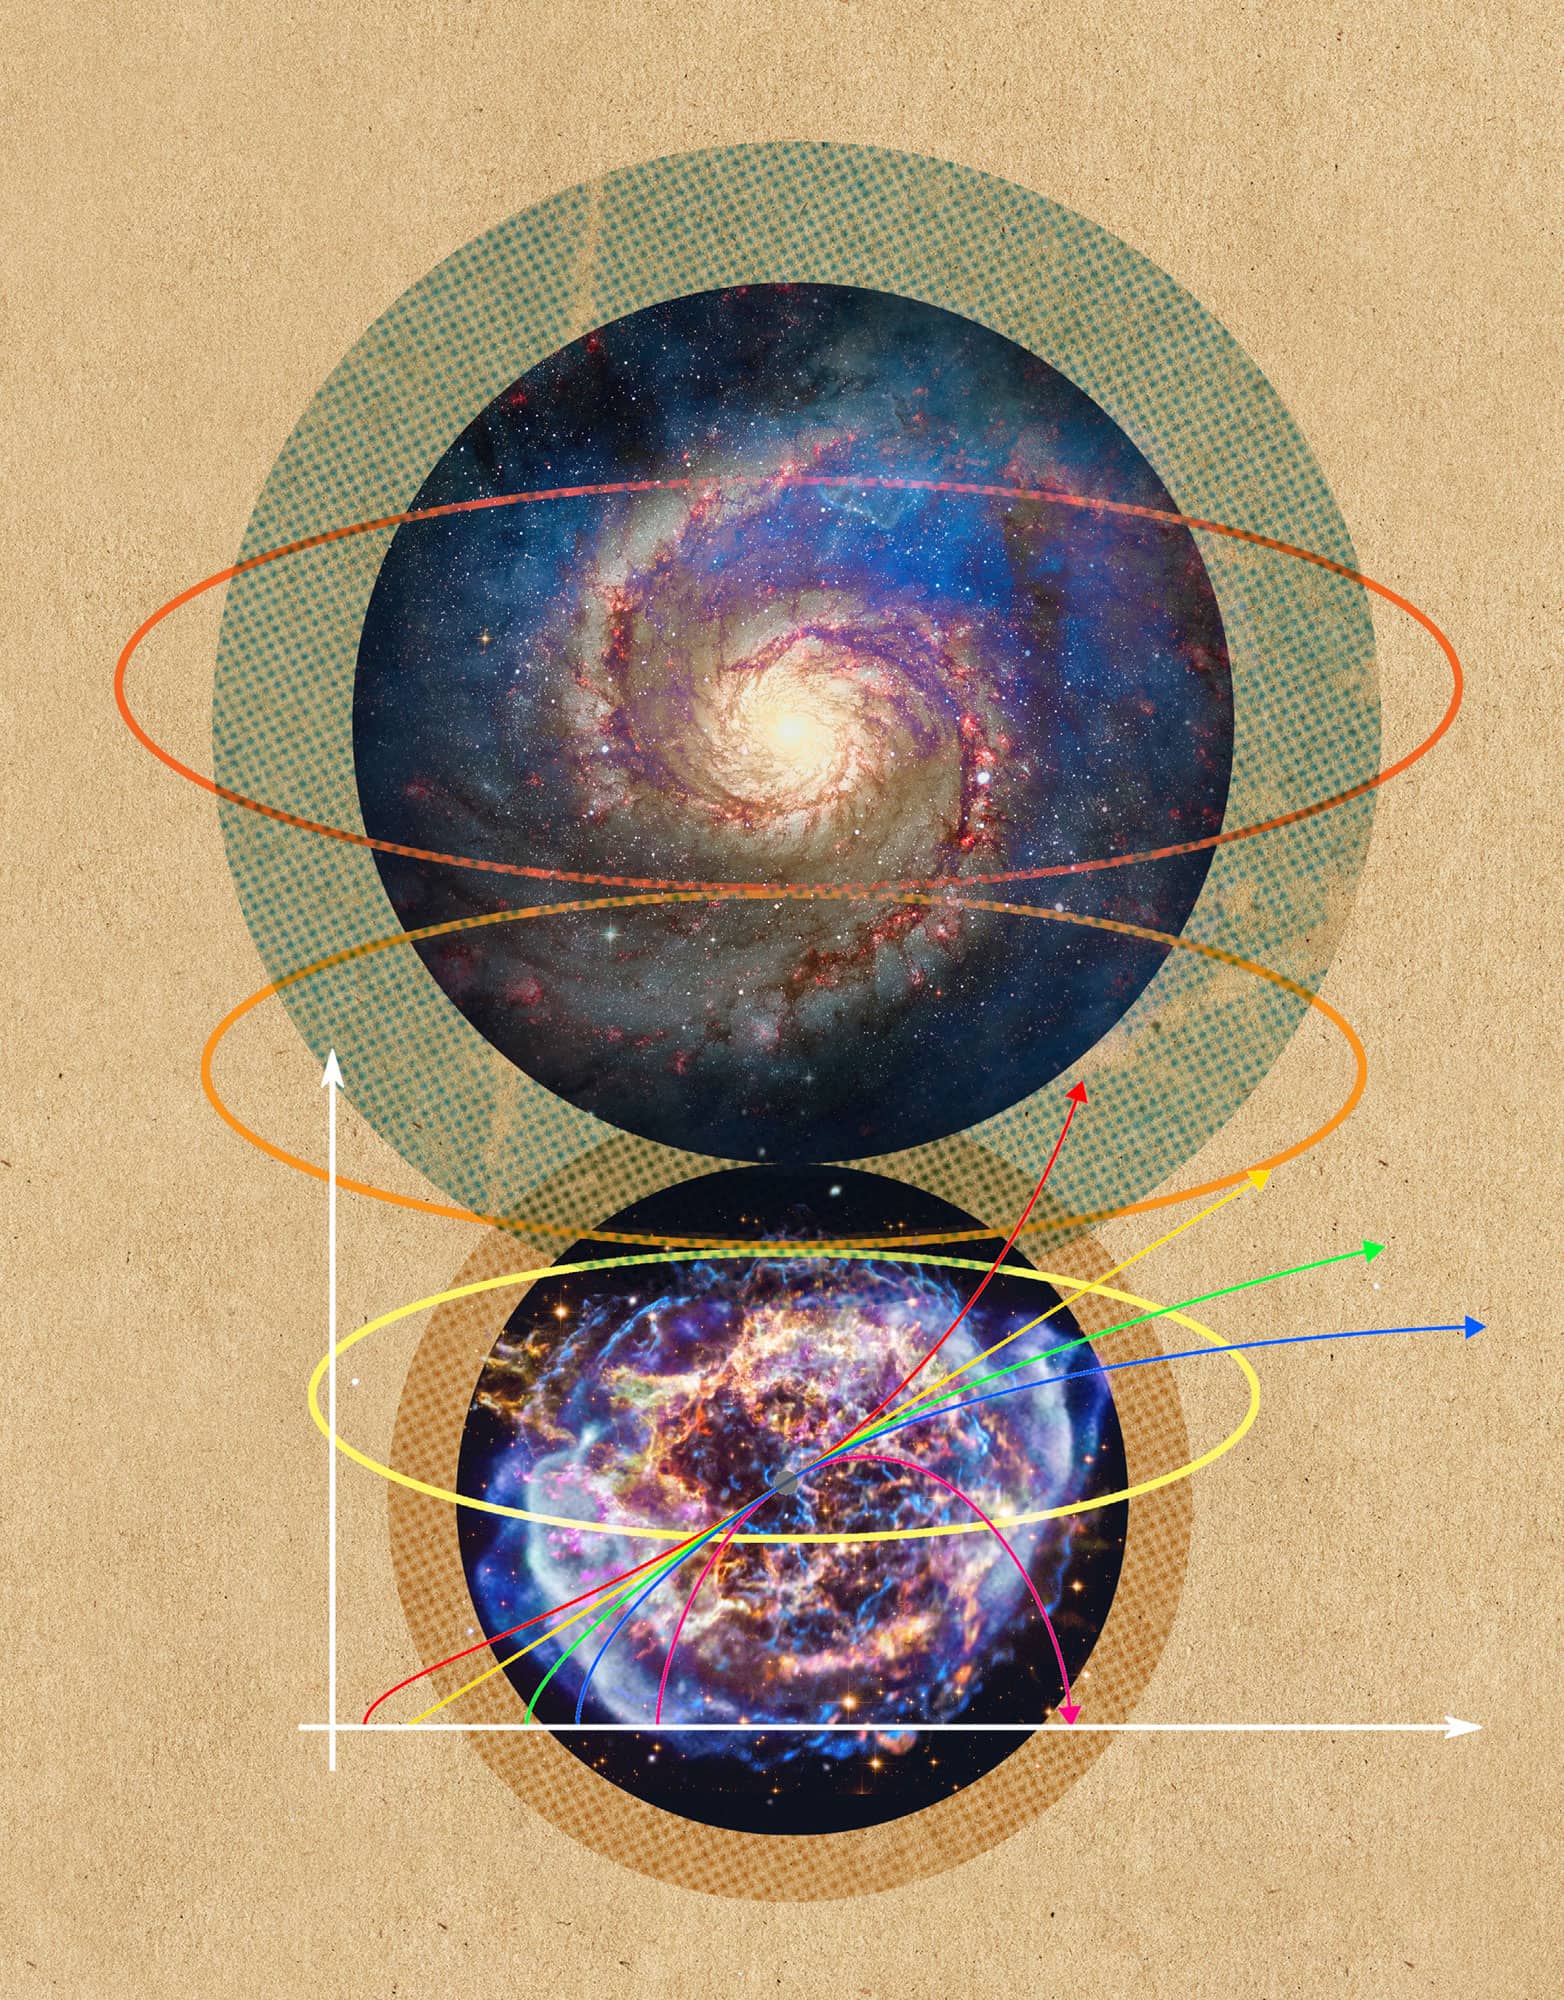
ASTROPHYSICS
the 30-second data
Astrophysics has become a big user and supplier of data science expertise. Most cosmology experiments involve scanning large amounts of data to make measurements that can only be statistically derived. The data is also searched for rare events. These statistical insights, in turn, elucidate the past – and future – of our universe. One example of a rare cosmological event is the production of a supernova – a star that explodes during its demise. Supernovae were used in the discovery of the accelerating expansion of the universe, for which Saul Perlmutter, Brian Schmidt and Adam Reiss won the 2011 Nobel Prize. The discovery hinged on automatically searching the sky for supernovae and collecting enough measurements of supernova brightness and redshift (a measure of how much photons have been stretched) in order to make statistically acceptable conclusions about trendlines. Supernovae have homogenous brightness, and it is this brightness that indicates how far a supernova is from a telescope, and how long light takes to reach us from that supernova; if light from older supernovae stretched less than from new supernovae, the universe must be stretching more now than before, implying that over time, the universe will continue to stretch ever more rapidly.
3-SECOND SAMPLE
Photons from stars billions of light years away strike Earth, furnishing telescopes with eons-old galactic images – masses of data awaiting analysis.
3-MINUTE ANALYSIS
A major problem in data analysis is the tendency to interpret results as confirmations of pre-existing beliefs, which leads to furious debugging when outcomes clash with expectations and to slackening of error-detection when the two correspond. To decontaminate the debugging, physicists developed blind analysis, wherein all analysis happens before the final experimental results are revealed to the researcher. Blind analysis has gained popularity in areas of physics and may be making a foray into other fields such as psychology.
RELATED TOPIC
See also
3-SECOND BIOGRAPHIES
EDWIN HUBBLE
1889–1953
American astronomer who discovered the original expansion of the universe.
SAUL PERLMUTTER
1959–
American astrophysicist and Director of the Berkeley Institute for Data Science who won the 2011 Nobel Prize in Physics for the Accelerating Expansion of the Universe.
30-SECOND TEXT
Aditya Ranganathan
Data-driven measurements and experiments highlight the importance of data science to cosmology, and vice versa.
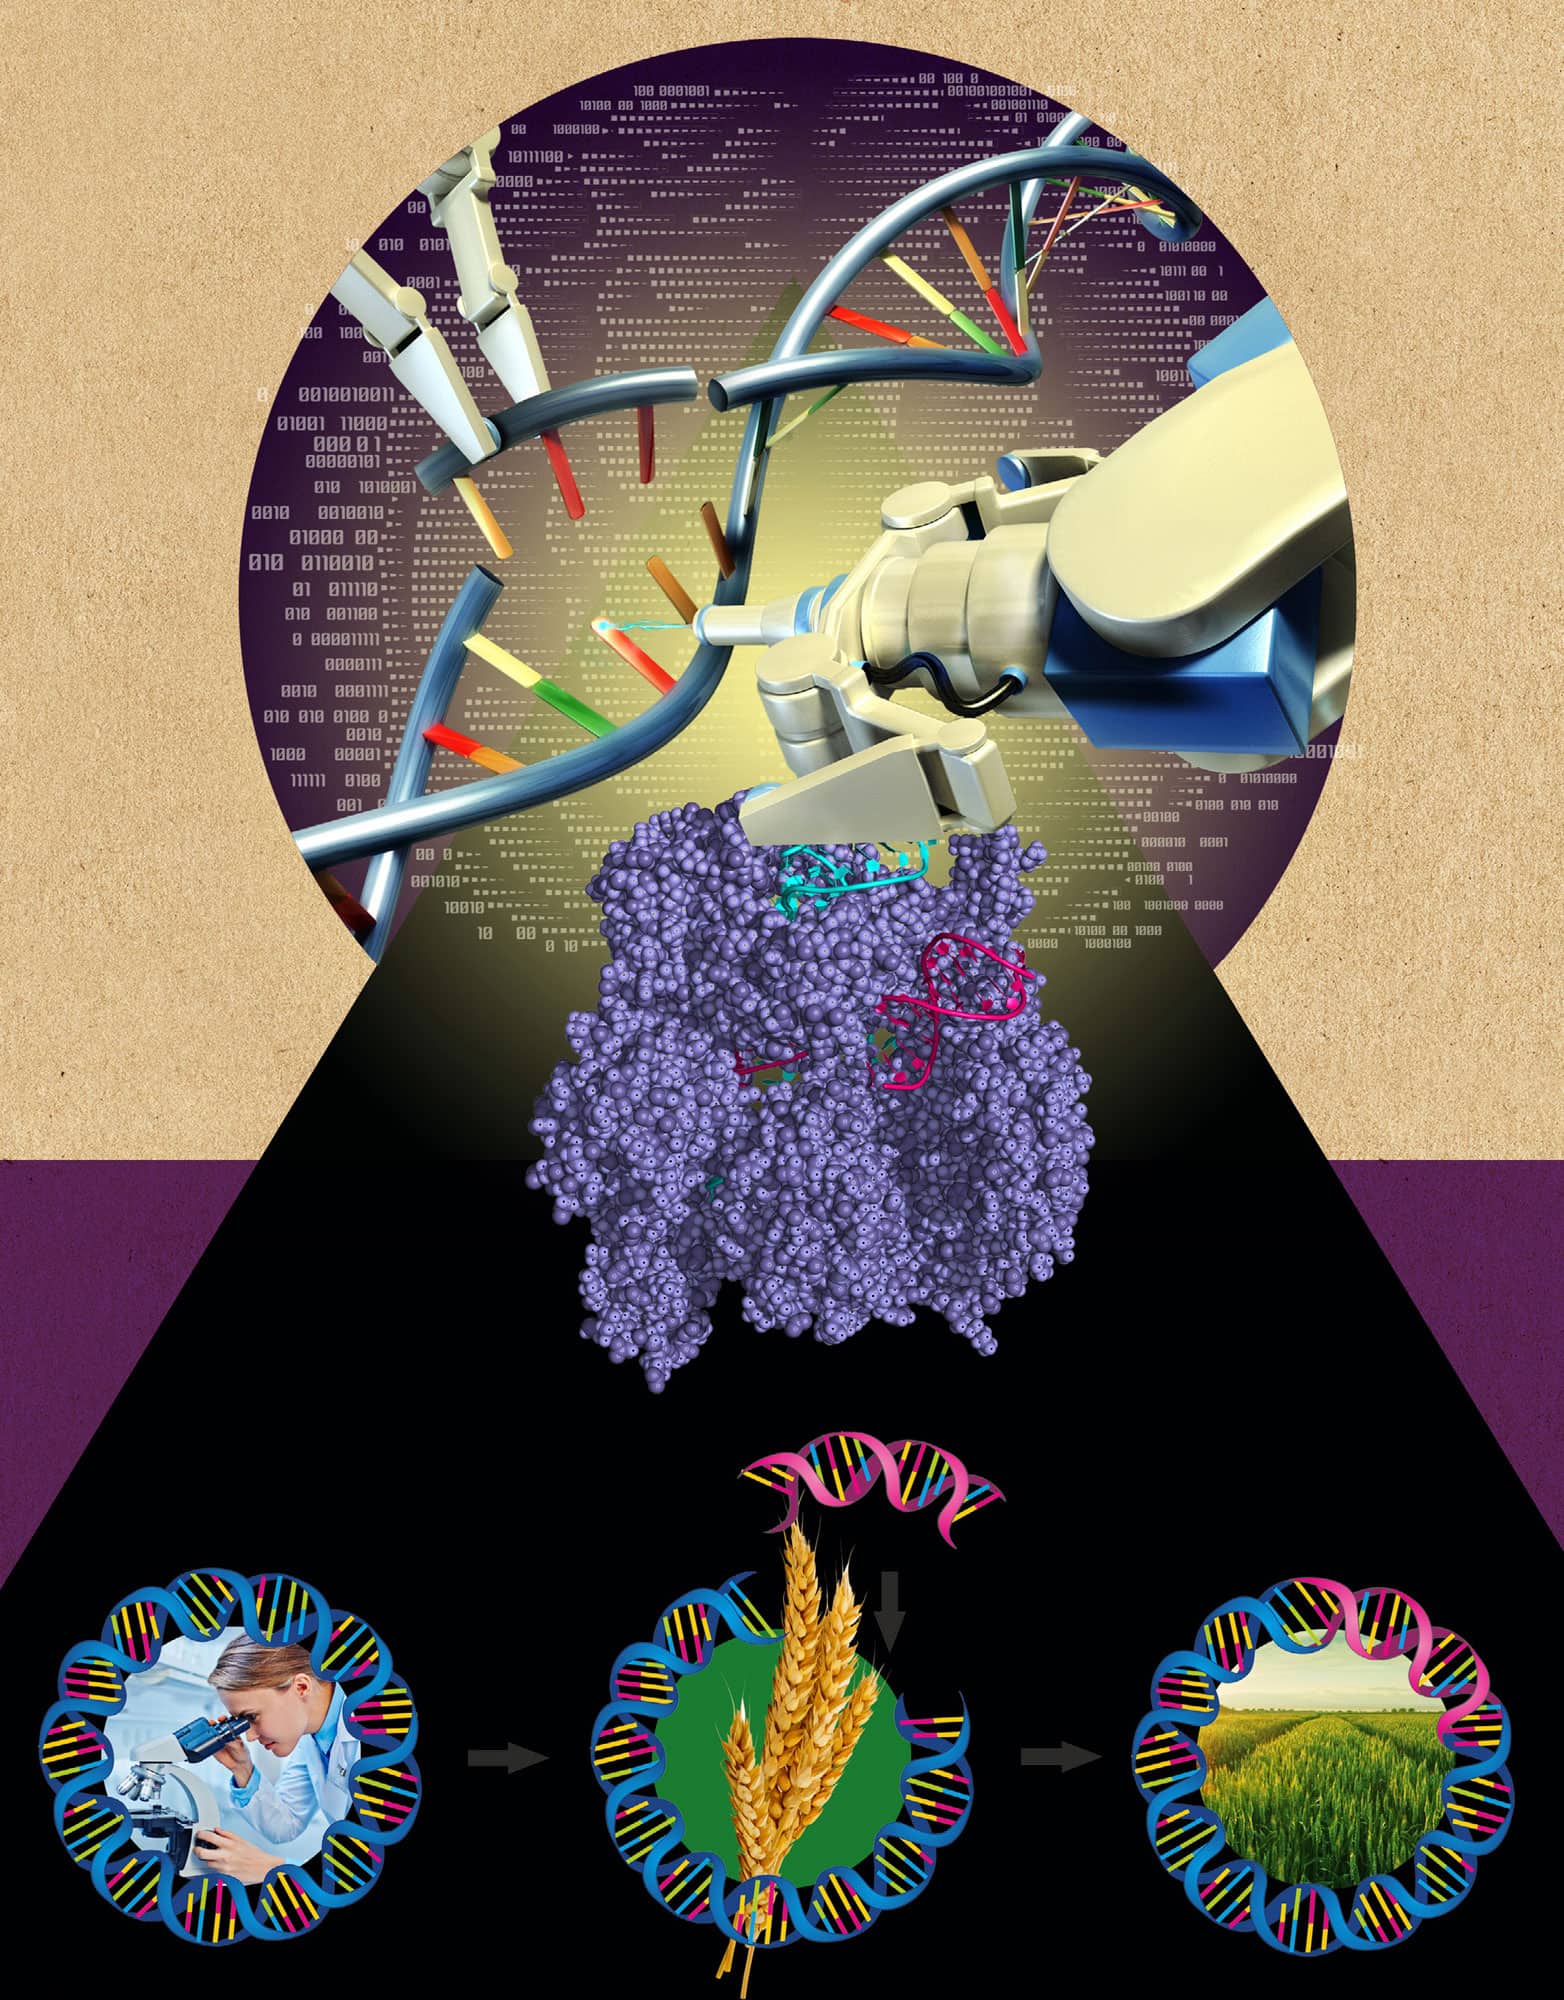
CRISPR & DATA
the 30-second data
Scientists are harnessing the power of a gene-editing tool called CRISPR that has revolutionized labs around the world. The precision engineering tool allows scientists to chop and change DNA in a cell’s genetic code and could one day correct mutations behind devastating diseases such as Huntington’s, cystic fibrosis and some cancers. CRISPR works like a pair of molecular scissors and cuts DNA at target genes to allow scientists to make changes to the genome. This technique has been used by scientists in the lab to make embryos resistant to HIV and remove genes that cause sickle-cell disease. But these molecular scissors are not perfect. One misplaced cut could cause irreparable damage that is passed on through generations. To make CRISPR more accurate, scientists are leveraging huge data sets generated from mapping the human genome. Researchers have used CRISPR to edit tens of thousands of different pieces of DNA and analysed the resulting sequences. From the data, scientists are developing machine learning algorithms that predict the exact mutations CRISPR can introduce to a cell, helping scientists to reduce any miscuts to the code of life.
3-SECOND SAMPLE
Editing the human genome conjures images of science fiction, but it could be closer to reality thanks to the data science that is helping researchers to correct nature’s mistakes.
3-MINUTE ANALYSIS
There is trepidation about where CRISPR technology will take science, and gene-editing of human embryos has raised ethical concerns – specifically around the possibility of introducing heritable alterations to the human genome. Some genome damage could go unnoticed and lead to unforeseen health issues, such as premature death or other genetic diseases. It is no surprise that CRISPR has sparked international debate on how it should be regulated.
RELATED TOPICS
See also
3-SECOND BIOGRAPHIES
FRANCISCO J.M. MOJICA
1963–
One of the first researchers to characterize CRISPR and coin the acronym.
JENNIFER ANNE DOUDNA
1964–
Along with Emmanuelle Charpentier, proposed CRISPR as a gene-editing tool.
FRANK STEPHENS
1982–
Advocate for Down syndrome; Special Olympics athlete.
30-SECOND TEXT
Stephanie McClellan
Big data sets are helping to refine CRISPR’s accuracy, which is essential work, given the ethical concerns.
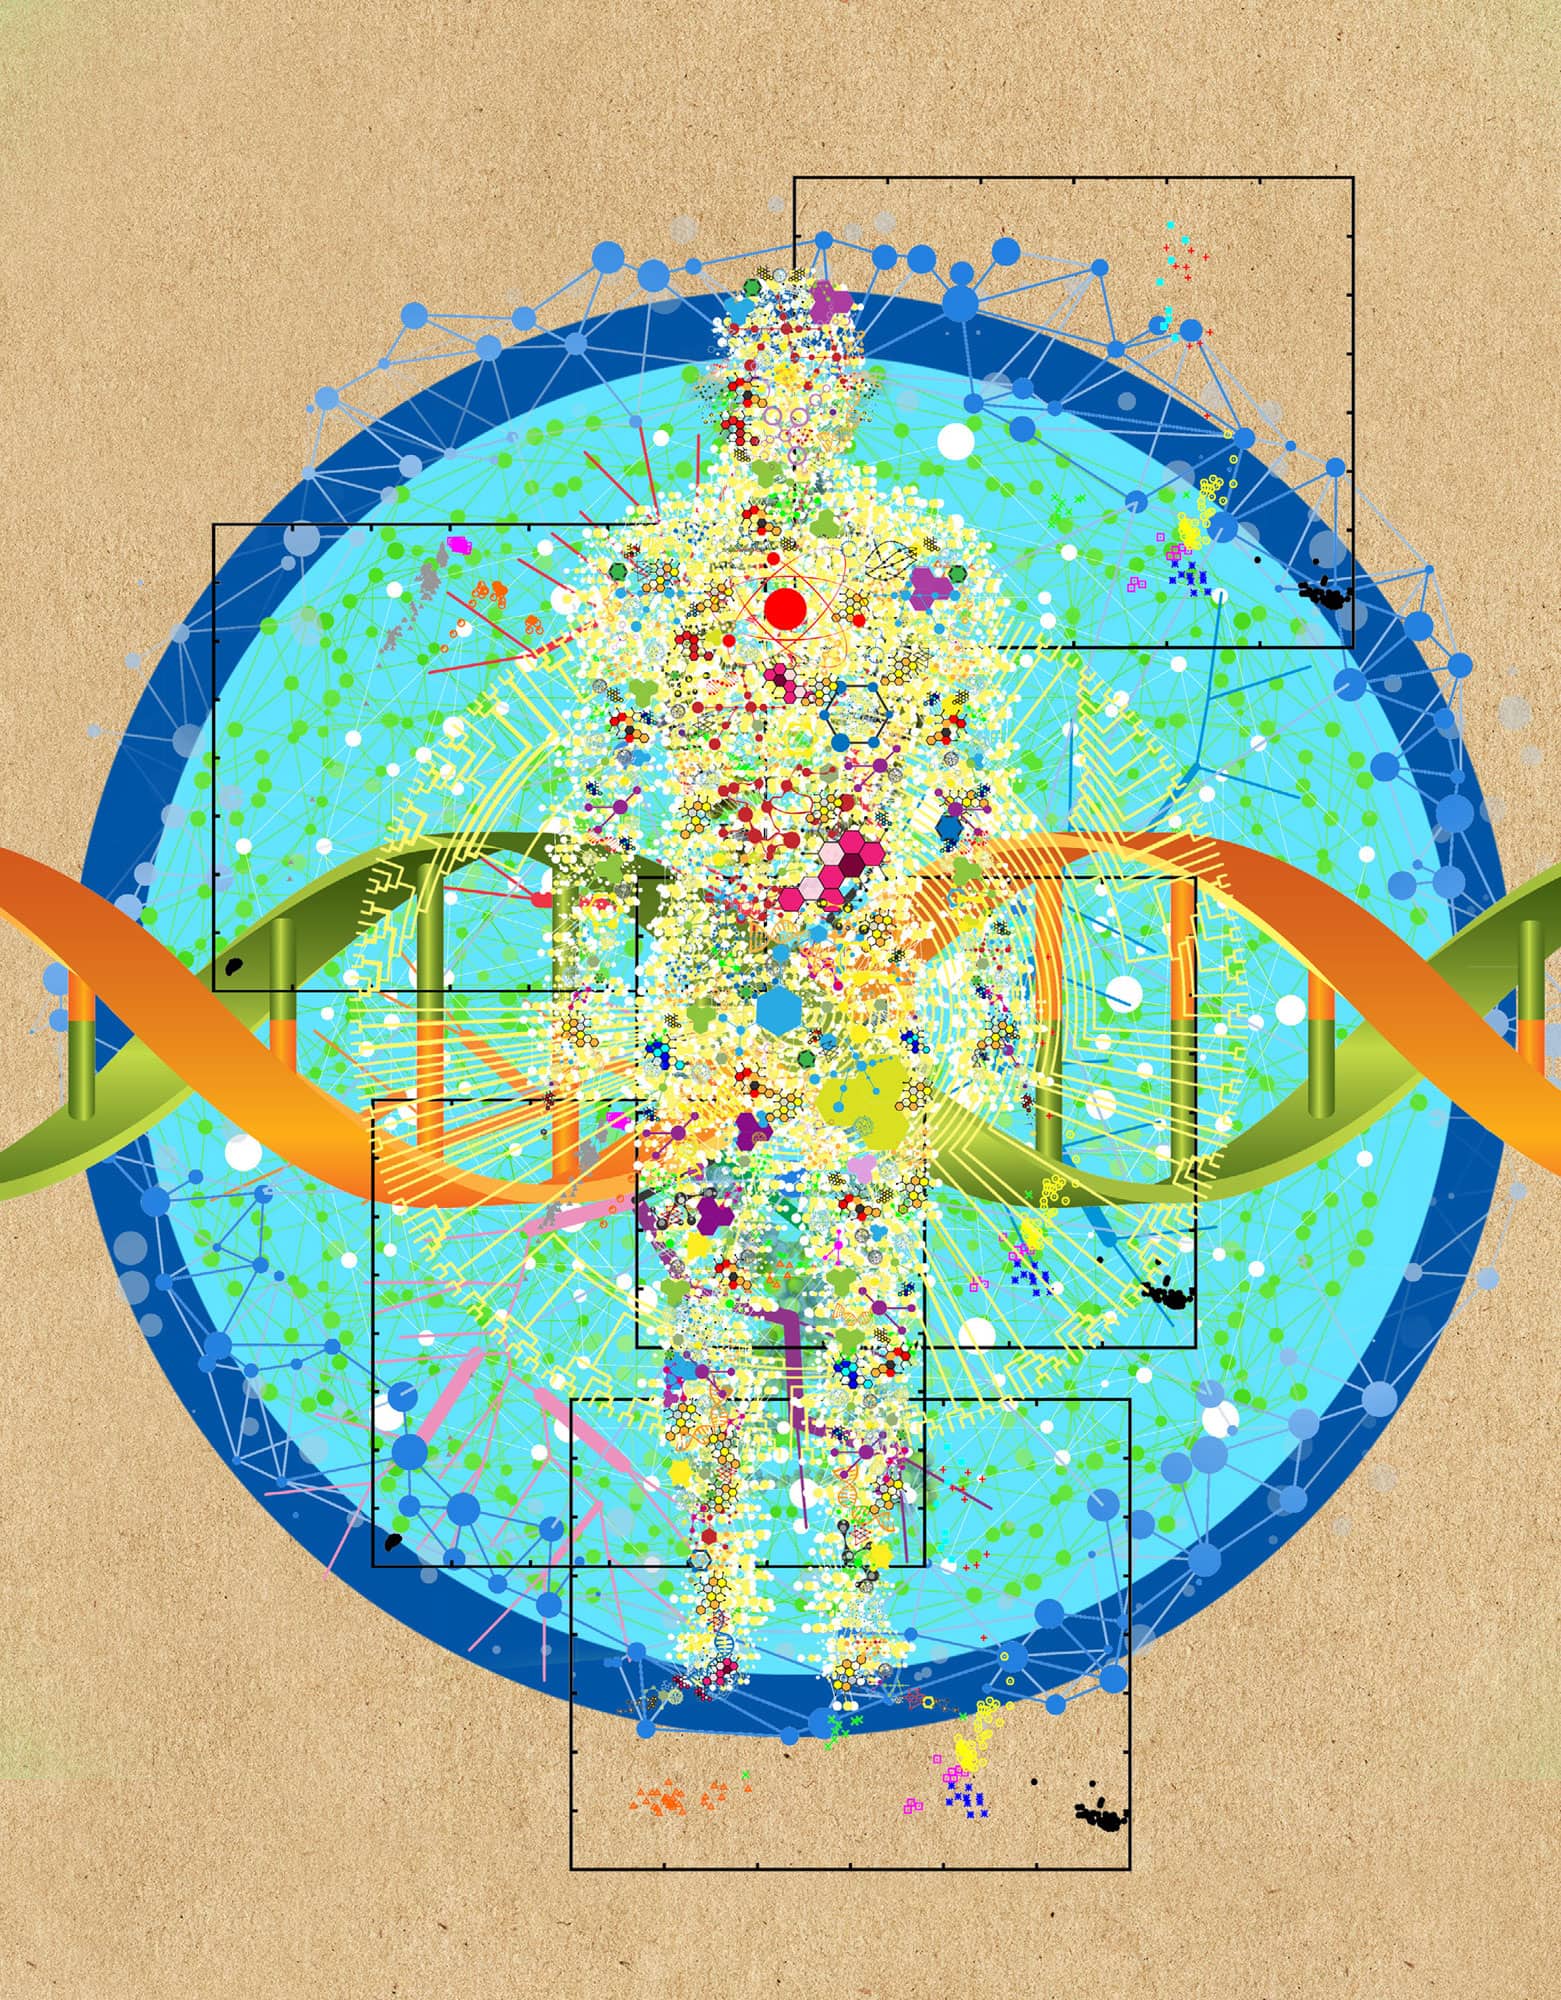
THE MILLION GENOME PROJECT
the 30-second data
The Million Genome Project (MGP), or All of Us, is the US National Institutes of Health initiative to unlock the genomes of 1 million Americans. The human genome has over 20,000 genes and is the DNA hereditary information that parents pass on to their child. MGP builds off the Human Genome Project (1990–2003), which created the world’s first human DNA reference library, now used in medicine. Each person has a unique genome. Genes play a part in how we look (eye and hair colour) and act, as well as determine if we are predisposed to cancer or have genetic diseases. However, lifestyle and environment affect our health. MGP focuses on observing people’s differences in health, lifestyle, environment and DNA. All of Us, uniquely, captures diversity – of people’s backgrounds, environment from all regions across the country, and the broad spectrum of healthiness and sickness. Survey, electronic health record, physical measurement and biosample data will be collected to make one of the largest health databases for worldwide use. MGP will help develop more precise tools to identify, treat and prevent a person’s disease by factoring how their health is affected by age, race, ethnicity, diet and environment – a concept known as precision medicine.
3-SECOND SAMPLE
The Million Genome Project will unlock the genome of 1 million Americans so that the data can be used to ‘personalize’ medicine.
3-MINUTE ANALYSIS
The Million Genome Project is a part of the US Government’s Precision Medicine Initiative. Precision medicine, by using a person’s genetic information, better tailors treatments, especially for diseases with a genetic component, such as Parkinson’s disease. This healthcare approach enters into a new era of medicine where disease risk and treatment success can be more accurately predicted for each individual. Healthcare prevention can be better prioritized and cost-effective in this dawn of precision medicine.
RELATED TOPIC
See also
3-SECOND BIOGRAPHIES
FRANCIS CRICK & JAMES WATSON
1916–2004 & 1928–
Co-discovered the structure of DNA in 1953 and won the Nobel Prize (1962).
FRANCIS COLLINS
1950–
Led the Human Genome Project (1990–2003) and has discovered genes associated with many different diseases.
30-SECOND TEXT
Rupa R. Patel
Advances in technology and data science have made the gathering and analysis of such large data sets possible.
CLIMATE CHANGE
the 30-second data
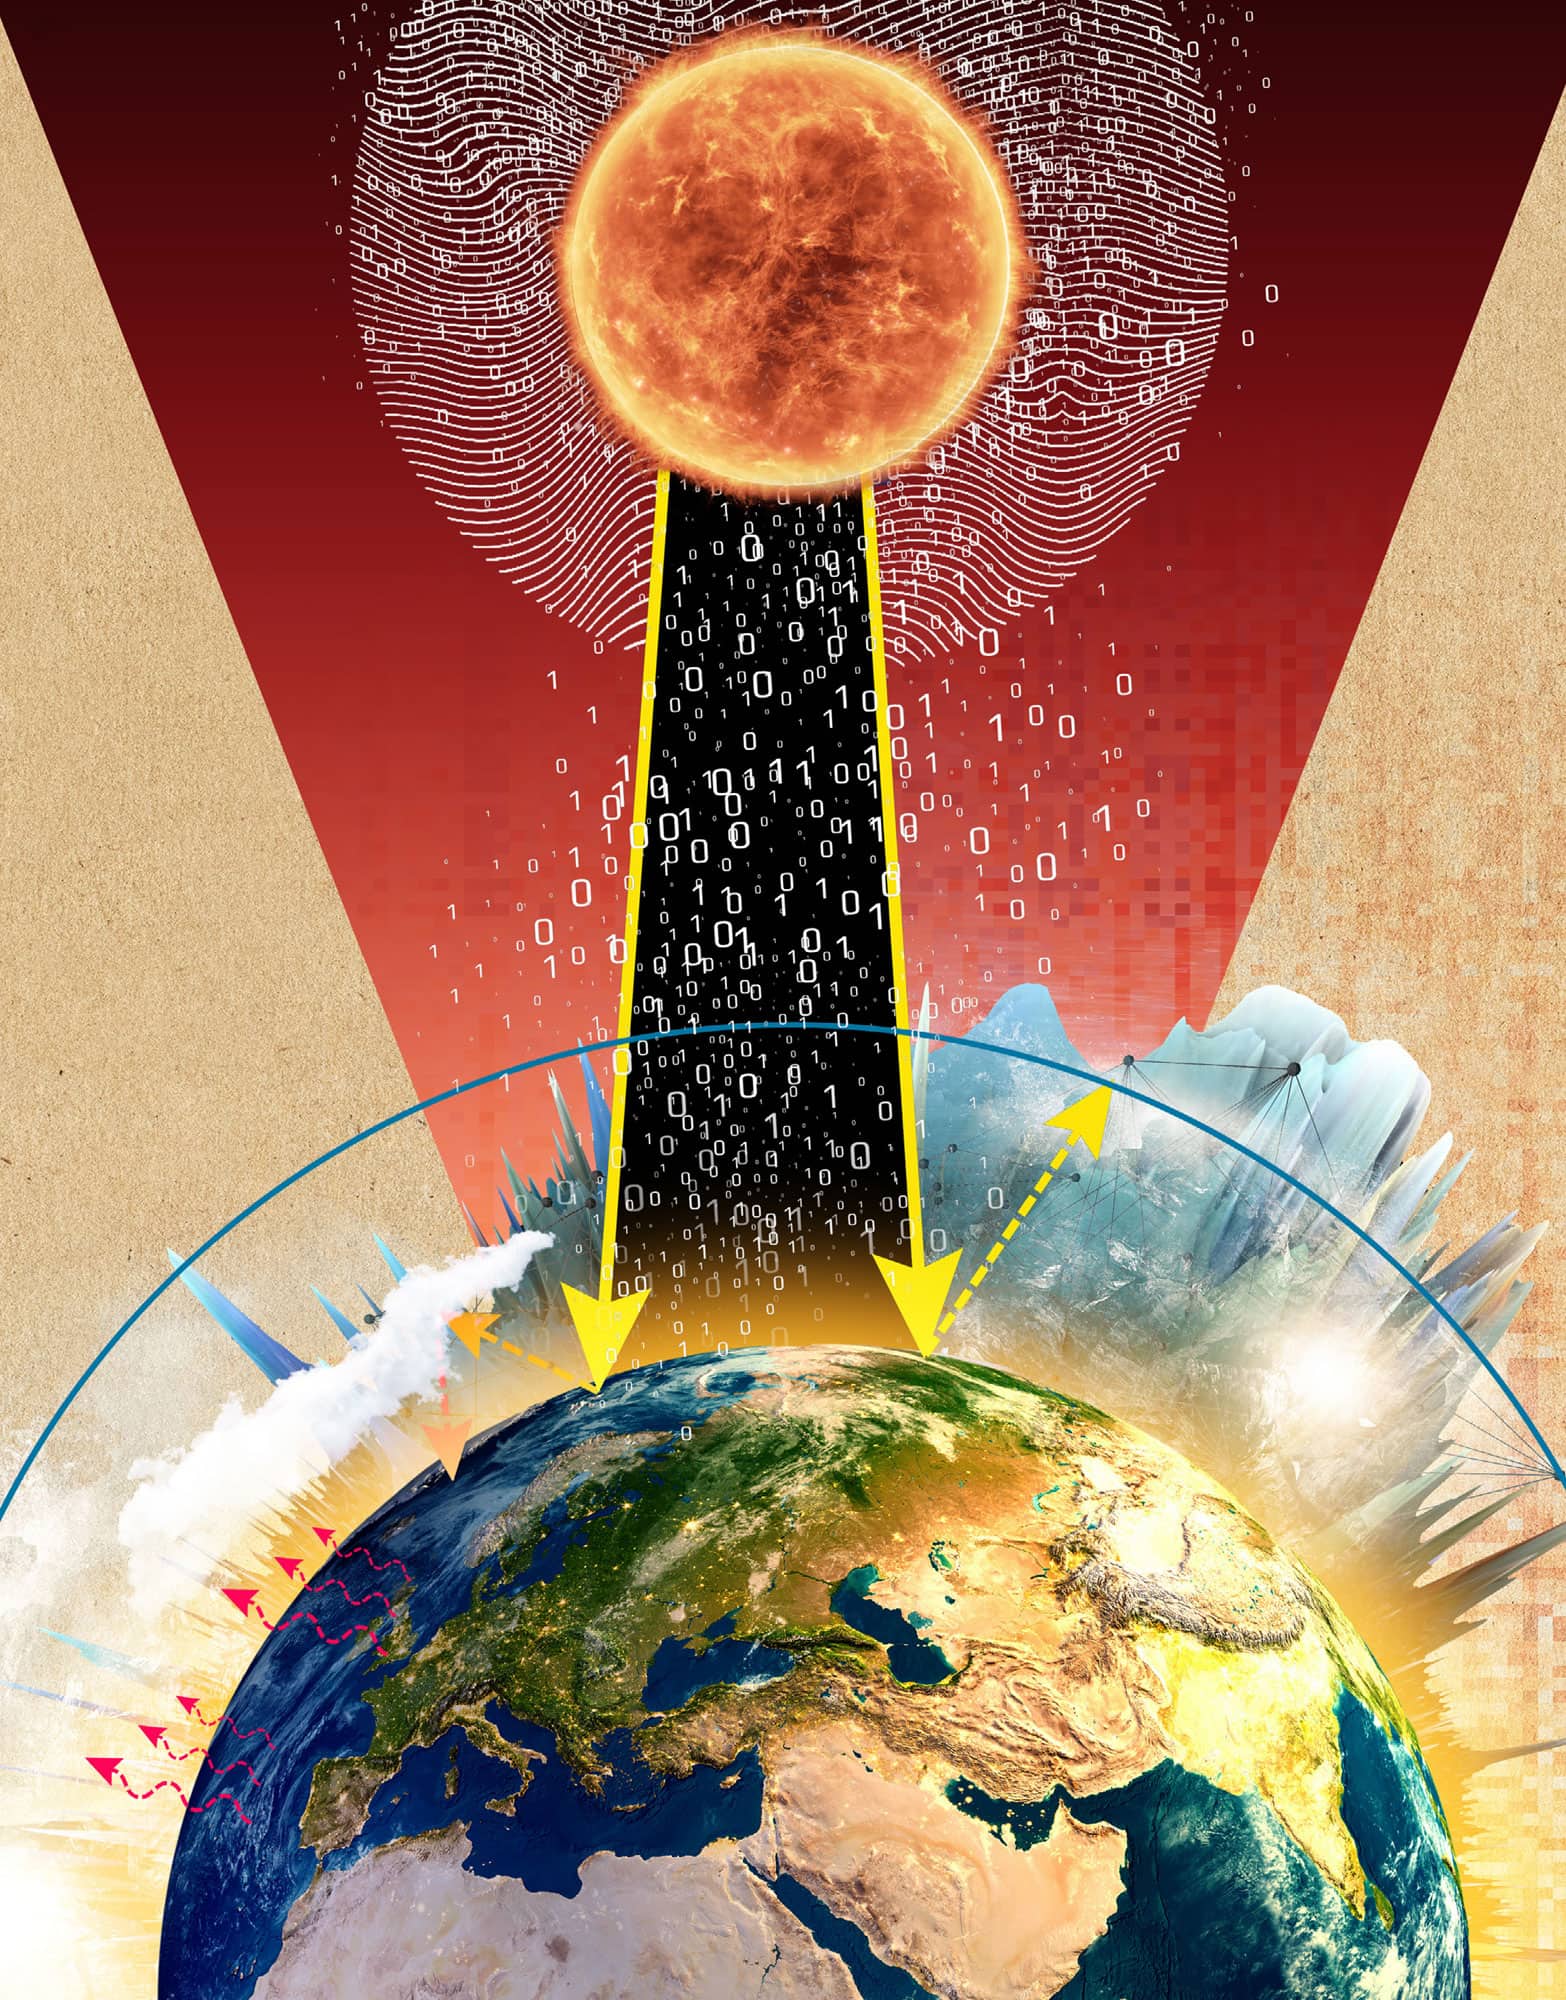
Climate trend predictions ensue after compiling and processing volumes of data: average global temperatures over the years, for example. Average global temperature is a nuanced function of variables. Above-average build-ups of greenhouse gases in the atmosphere trap above-average amounts of heat, creating a barrier to prompt disposal. Other factors that slow down rates of heat emission include rising ocean levels, asphalt levels and decreasing ice. The result of this retardation is an upset of equilibrium – the desired state in which the rate of heat absorption equals the rate of heat emission, and average global temperature stays constant. Even though the disequilibrium is temporary, it is a period when heat lingers. And, when equilibrium returns, rather than catching up to the earlier temperature, we find ourselves in the midst of a new normal. There is a range of new ‘normals’ we could potentially reach: some mildly uncomfortable, some deadly. In order to understand which of these scenarios we might be heading towards, we must gather data vast enough to average out small fluctuations that might lead to incorrect predictions. The data that researchers are amassing includes global temperatures, sea-ice levels and so on – the conglomerate definitively indicating dangerous levels of greenhouse gas production.
3-SECOND SAMPLE
A firm prediction of the future of our planet rests upon the collection and analysis of massive amounts of data on global temperatures and greenhouse gas concentrations.
3-MINUTE ANALYSIS
Anthropogenic contributions, including expanding agricultural and industrial practices, correlate with an increase in global greenhouse gas concentrations and rising global temperatures, also known as global warming or climate change. The more data that is collected on anthropogenic contributions, the more conclusive the claim that it is human factors driving Earth’s temperature change.
RELATED TOPIC
See also
3-SECOND BIOGRAPHIES
JAMES HANSEN
1941–
NASA scientist and climate change advocate.
RICHARD A. MULLER
1944–
Climate sceptic converted to climate change advocate.
AL GORE
1948–
Published what was at the time a controversial documentary on the impacts of climate change called An Inconvenient Truth.
30-SECOND TEXT
Aditya Ranganathan
So far, the data collected has led 98 per cent of scientists to conclude that anthropogenic factors are to blame for climate change.
CURING CANCER
the 30-second data
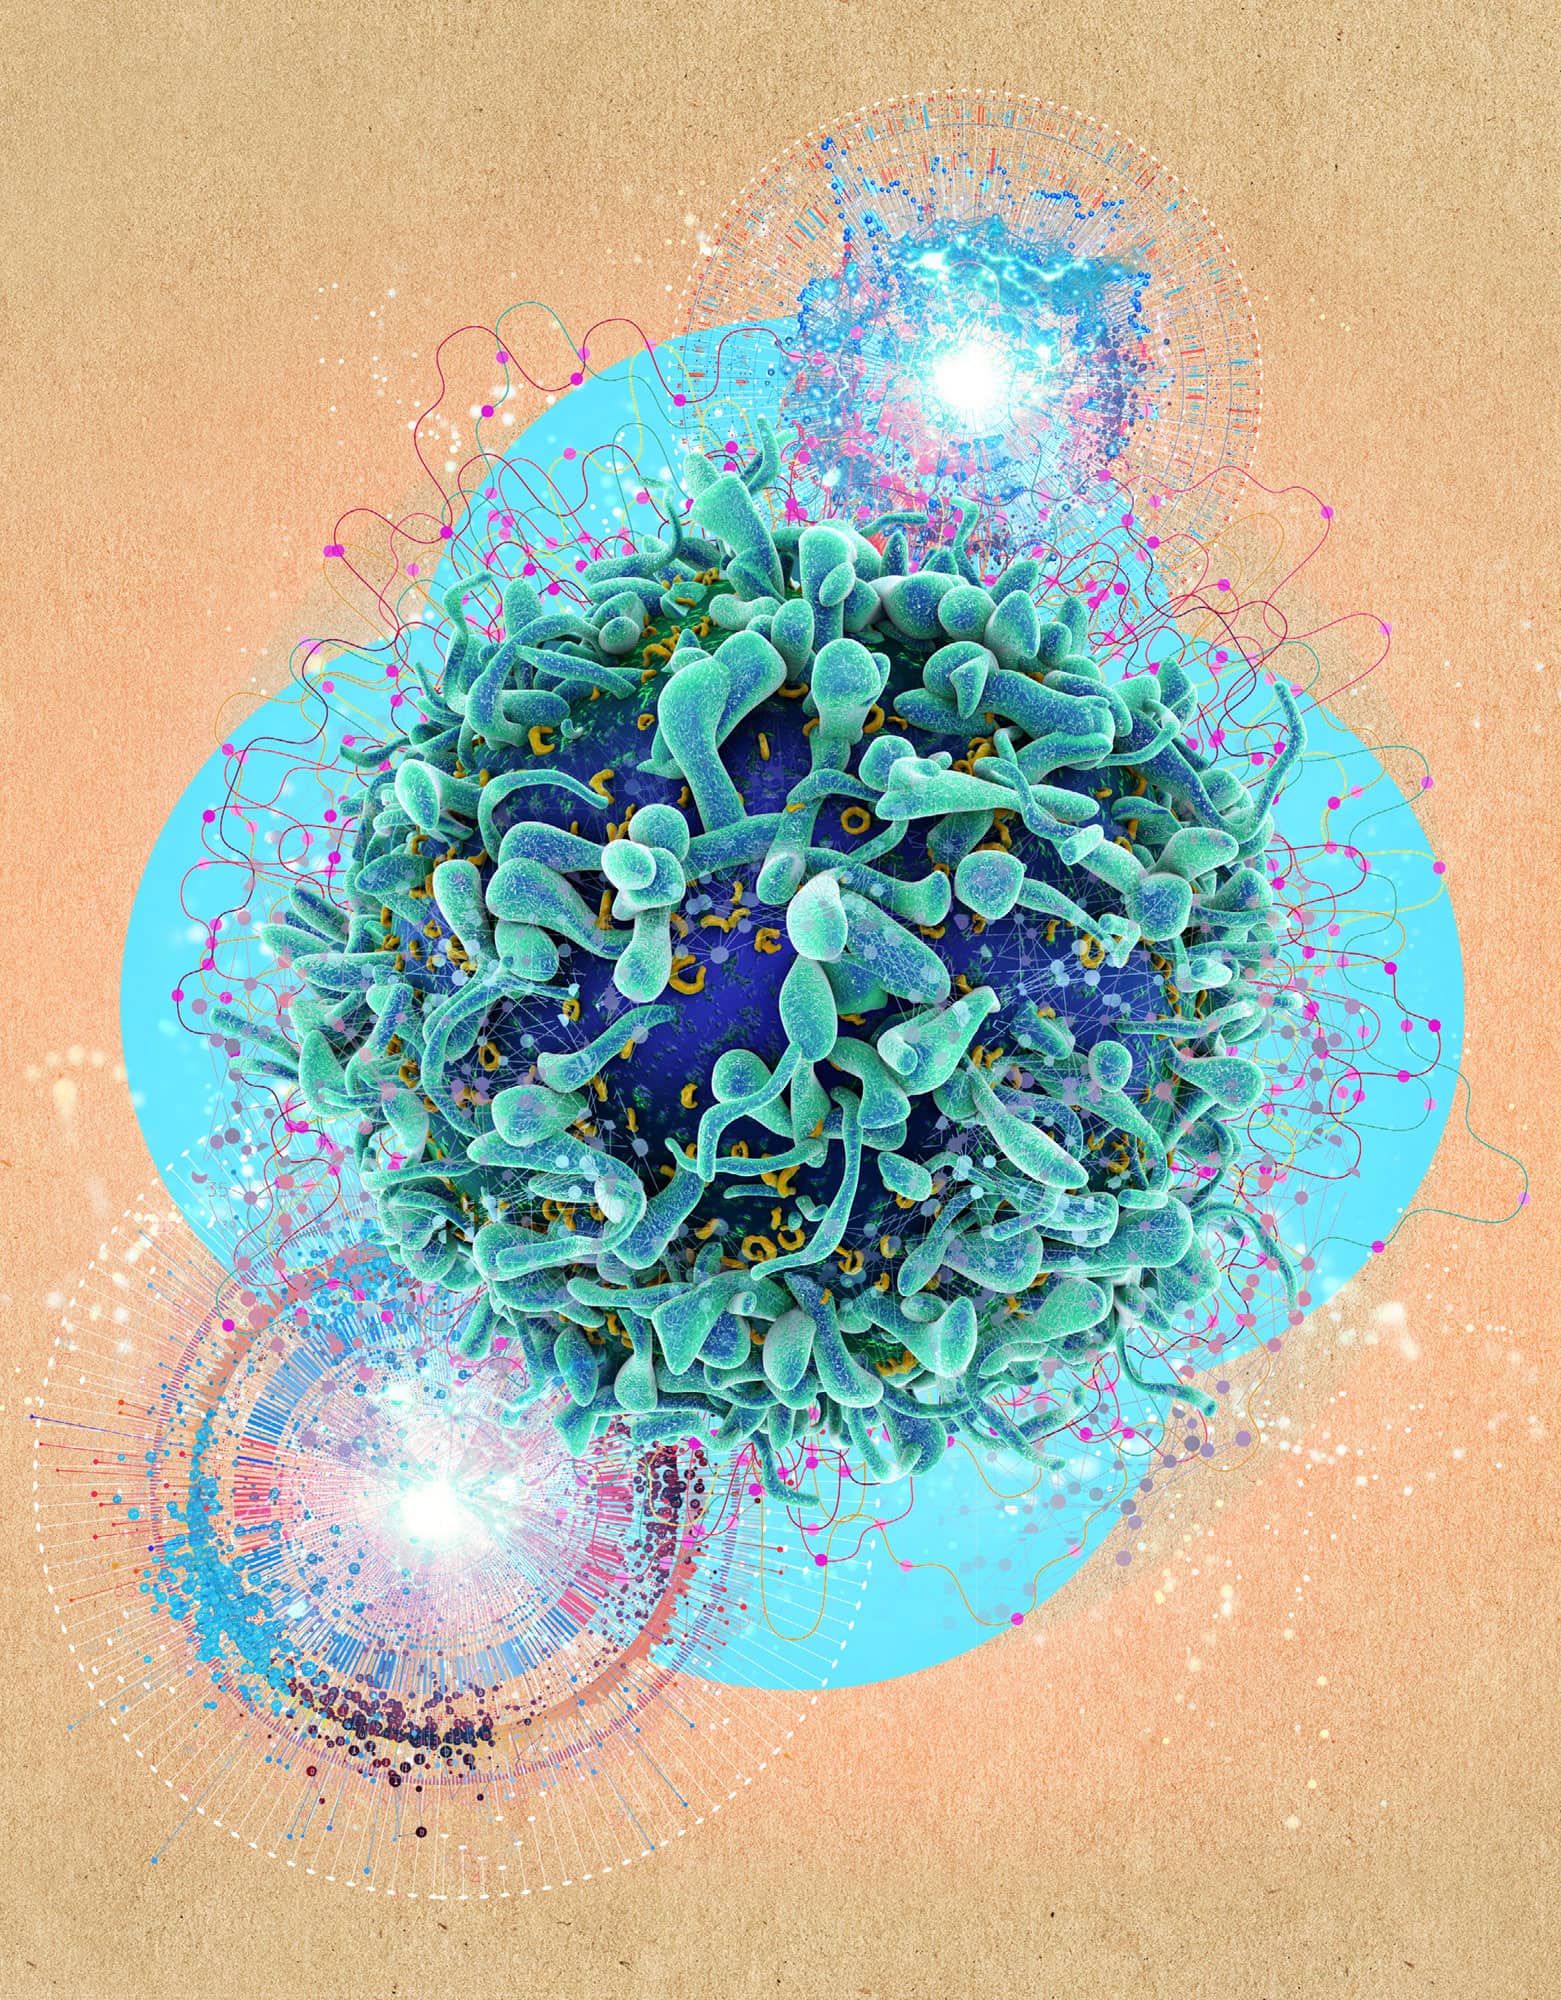
While discoveries in basic science help explain the mechanisms of cancer, it is how these discoveries lead to targeted therapies and studies on patient outcomes that provide a deeper understanding of successful therapies and gets us closer to a cure. Data science allows us to test the value of intervention. Specifically, statistical thinking played a fundamental role in randomized trials, used for the first time by the US National Cancer Institute in 1954 to test treatments of patients with acute leukaemia. As long as 40 years ago, cancer research depended on many of the tasks that today define data science: study design, data analysis and database management. Today, molecular biology technologies produce thousands of measurements per patient, which permit the detection of mutations, structural chromosomal changes, aberrant gene expression, epigenetic changes and immune response in cancer cells. A primary aim is finding ways of using this information to improve diagnosis and develop tailored treatments. These new technologies produce large and complex data sets that require sophisticated statistical knowledge as well as computing skills to effectively work with the data and avoid being fooled by patterns arising by chance.
3-SECOND SAMPLE
Advances in data science will be instrumental to curing cancer: they help us to understand if and why cancer interventions are working.
3-MINUTE ANALYSIS
Many challenges need to be overcome to cure cancer, and data will play a role in all of these. For example, it can take 10–15 years for a new drug to go through clinical trials and cost in excess of £1 billion. Using data science to optimize these processes for both money and time, while keeping them safe, is not usually how data and curing cancer are synthesized, but has become an important aspect of this work.
RELATED TOPIC
See also
3-SECOND BIOGRAPHY
MARVIN ZELEN
1927–2014
Founding chair of what today is the Department of Data Sciences in the Dana-Farber Cancer Institute who developed many of the statistical methods and data management approaches used in modern clinical cancer trials.
30-SECOND TEXT
Rafael Irizarry
Data science has become crucial in cancer research and will play a key role in future advances.
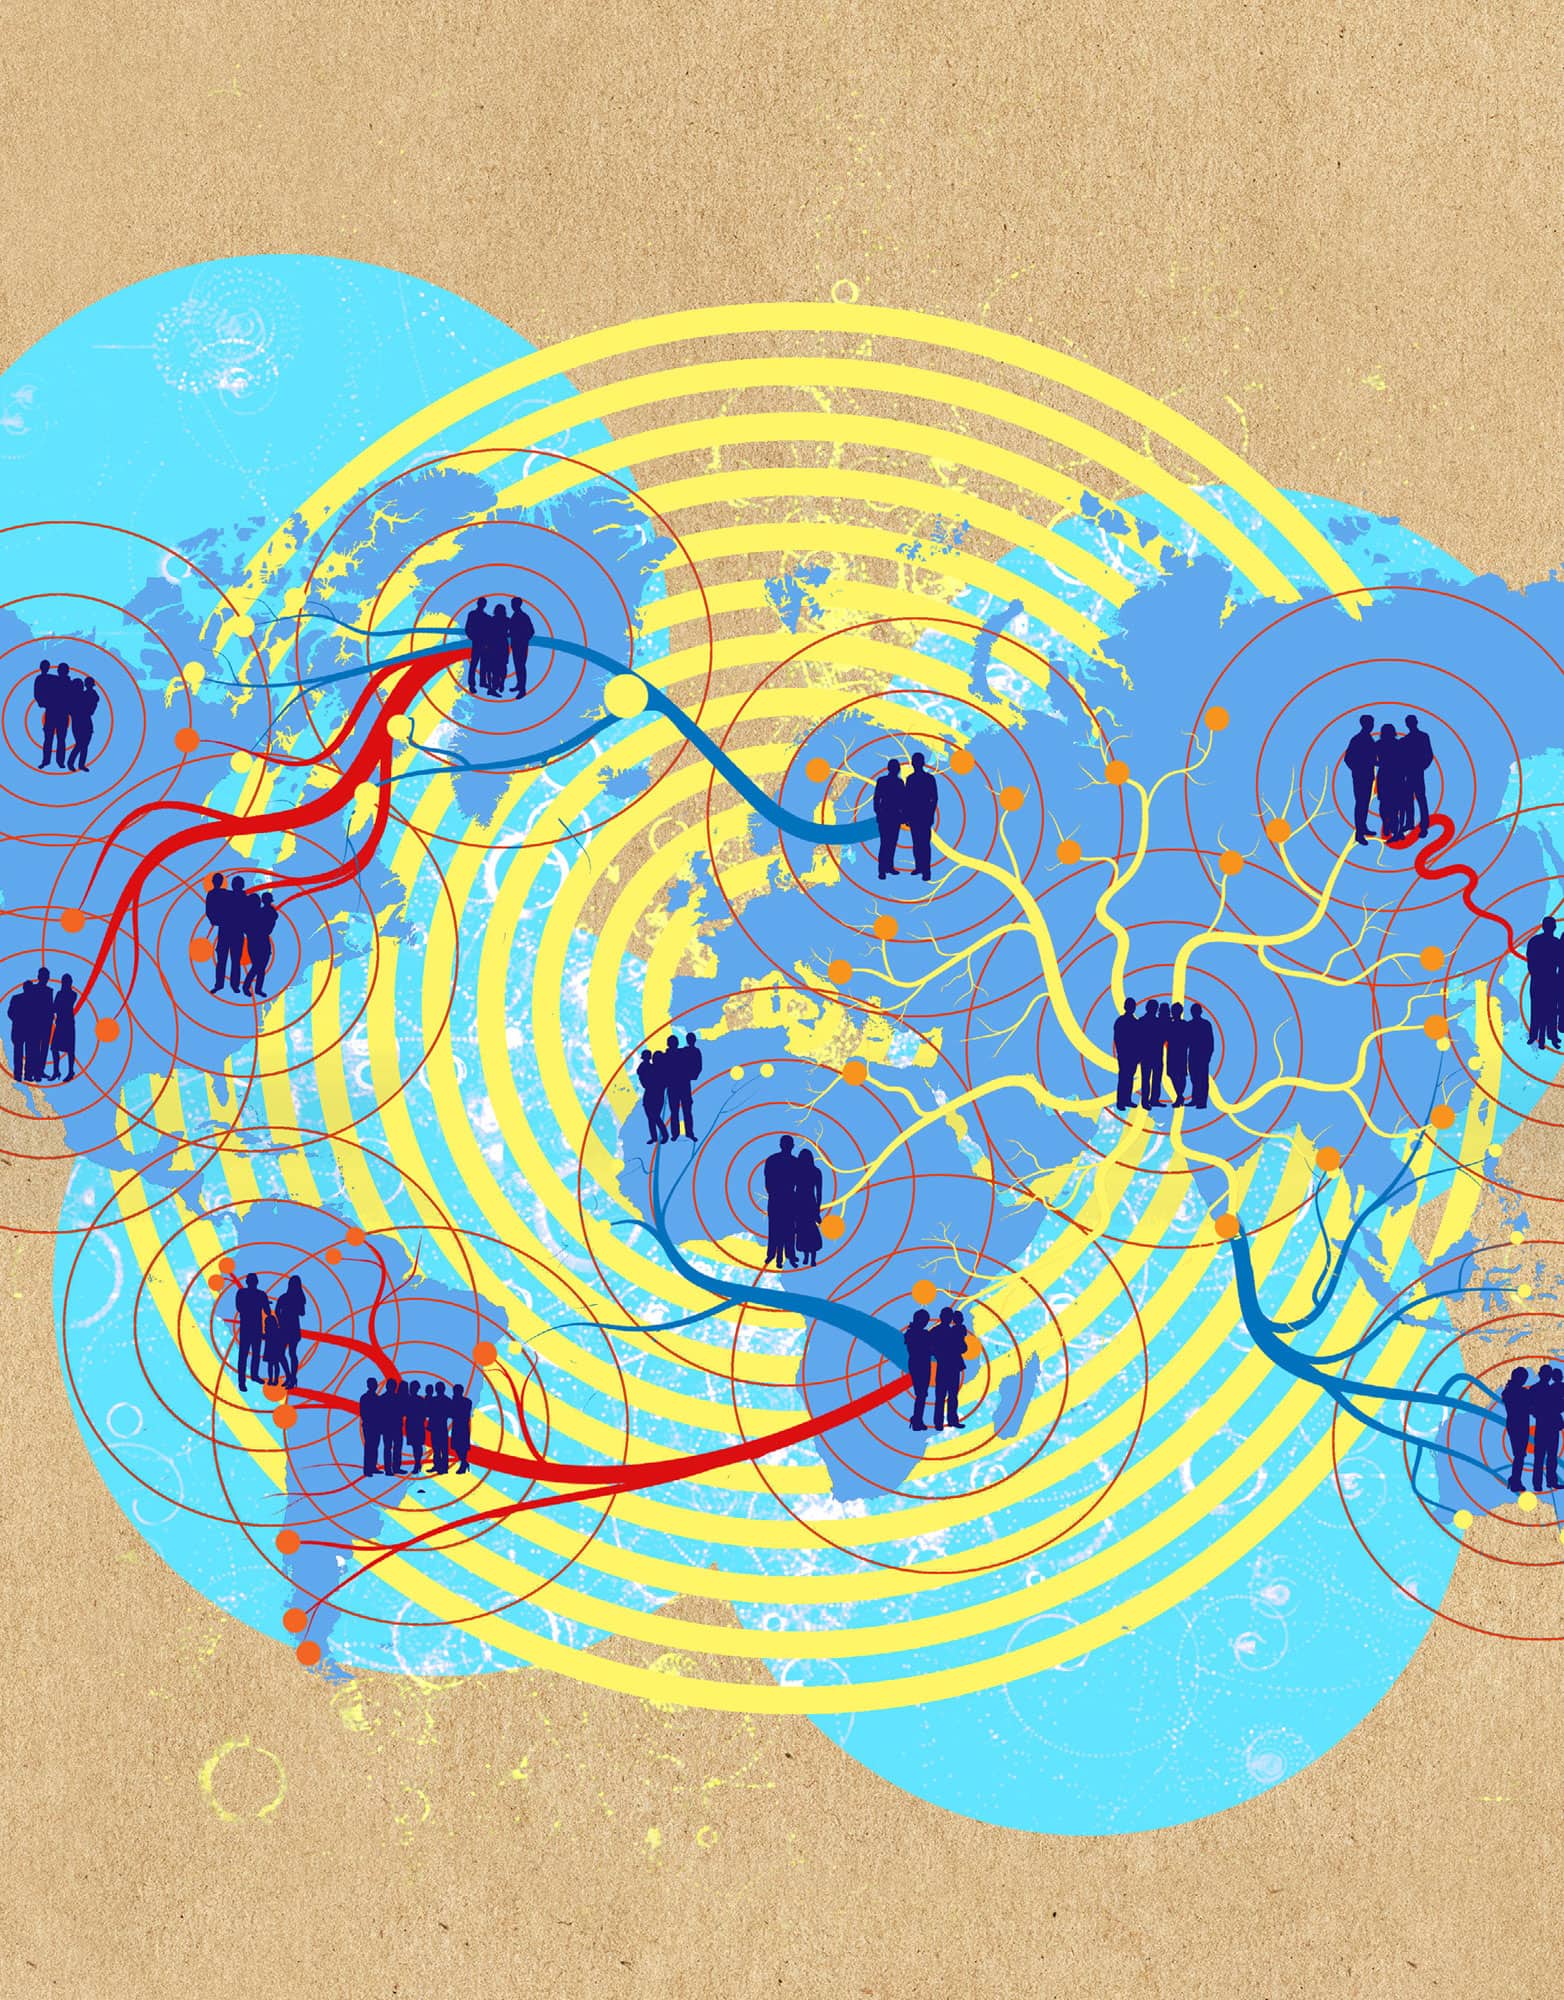
EPIDEMIOLOGY
the 30-second data
Epidemiology is the science of collecting data and calculating how diseases are distributed, have patterns and are caused among people. The science blends multiple disciplines (i.e. statistics, social sciences, biology and engineering) together to create these calculations. The calculations are used to prevent and control both contagious and non-contagious diseases within populations. Epidemiology impacts public health and generates the evidence for the preventive (e.g. vaccines) and non-preventive procedures (e.g. diabetes screening) used today and will adopt tomorrow, such as microbiome-based diagnostics. Epidemiological evidence drives the health policies and guidelines that governments put in place, such as child vaccinations, to protect its citizens’ health. The field is known for solving epidemics, or outbreaks of infectious diseases. Dr John Snow first defined epidemiologic concepts when he traced a contaminated water source to a cluster of cholera cases in London in 1854. Similarly, a group of deaths in Western Africa in 2013 led to an investigation to determine how and why the Ebola virus was spreading so quickly. The investigation informed health prevention programmes in the region to contain the virus’s spread.
3-SECOND SAMPLE
There is an Ebola outbreak in Africa; what happens next? Epidemiology is used to collect data and study the who, what, where, when and why of the disease.
3-MINUTE ANALYSIS
Epidemiologic research is used to improve health by examining the causal relationship between risk factors (e.g. age, smoking) and disease (e.g. cancer, diabetes). Methods use observations or experiments, combined with statistics, to identify bias and false cause–effect associations. Milestones in health prevention occurred in the 1950s, when large epidemiologic studies provided conclusive evidence that tobacco smoking increased the risk of death from lung cancer and heart attacks.
RELATED TOPICS
See also
3-SECOND BIOGRAPHIES
HIPPOCRATES
C. 460–370 BCE
First person to use the term ‘epidemic’ and observe how disease spread.
JOHN SNOW
1813–58
Successfully traced the source of the cholera outbreak in London in 1854, which went on to change urban water and sewage systems and public health worldwide; considered the father of epidemiology.
30-SECOND TEXT
Rupa R. Patel
Epidemiology enables calculations that are essential to our individual and collective well-being.