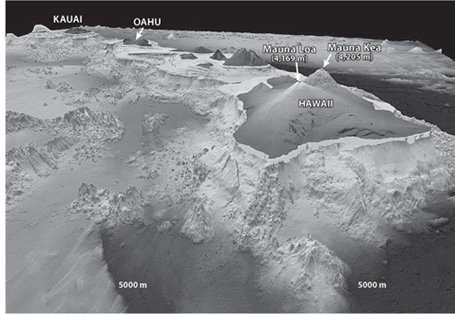
Fig. 11-0: Image of Mauna Loa volcano, the largest volcano on Earth. It reaches almost 14,000 feet above sea level and has a base that is more than 150 km in diameter. Much of the volume of the volcano is below sea level. With a total volume of about 70,000 cubic kilometers, this volcano is more than one hundred times the size of most convergent margin volcanoes and is, most likely, the surface manifestation of deep convective mantle plumes that quite probably rise from the core/mantle boundary. See color plate 13. (University of Hawaii School of Ocean and Earth Science and Technology and U.S. Geological Survey; http://oregonstate.edu/dept/ncs/photos/mauna.jpg)
Plate tectonics describes the movement of plates around Earth’s surface but not how this movement relates to deeper layers. Subducting plates must displace the mantle as they descend, and ocean ridge melting requires solid mantle to ascend in order to depressurize and melt. Both observations require the mantle to flow in the solid state. Study of how Earth’s topography responds to the loading and unloading of ice sheets shows that continents move up and down as mass is added and removed according to Archimedes’ principle, called isostatic adjustment. Isostatic adjustment can only occur if the mantle flows.
What is the pattern of mantle flow, and how does it relate to surface observations? Flow in response to density differences is called convection. Whether or not convection occurs depends on how large the density differences are, the viscosity of the material, and other parameters that all combine to give the Rayleigh number, which is a kind of convection index. High Rayleigh numbers mean convection occurs, and the Rayleigh number of the mantle is so high that mantle convection is inevitable. Early concepts related spreading centers to convective upwelling and subduction zones to downwelling of simple, large-scale convection cells within the mantle, but such a simple view clashes with observations from Earth’s surface. The ocean ridges move rapidly over Earth’s surface, and occasionally are subducted at trenches, indicating they are superficial phenomena not associated with deep convection. Downward flow at subduction zones, on the other hand, can be traced to greater depths. These aspects of mantle convection are passive, driven by the plates themselves.
At high Rayleigh numbers, convection cells break down and there can be multiple rising jets of hot material. Evidence for active convection by rising plumes within the mantle comes from mantle hot spots that create ocean island chains such as the Hawaiian Islands and that can occur in the middle of plates. Plumes are probably produced by heating from below at the core/mantle boundary.
The various forms of convection lead to significant temperature contrasts in the upper mantle. Because the ridges migrate freely over Earth’s surface, they provide an instantaneous sample of mantle temperature variations. Where the mantle is hotter, it melts more beneath the ridge, creating a thicker crust that floats higher owing to isostatic adjustment, creating shallow seafloor, such as at Iceland. Low temperatures occur distant from hot spots, or where the ridge crosses a former subduction zone. Narrow hot rising jets producing island chains and plateaus, long down-welling zones associated with subduction, and ocean ridges skating over the surface are the diverse connections between plate movement and mantle flow. These movements produce chemical fluxes between surface and interior that are an essential aspect of planetary habitability.
Plate tectonics revolutionized our understanding of all geological processes and provided a framework that united the Earth sciences. The limitation of plate tectonics, however, is that it is primarily descriptive, documenting the facts of the movements of the surface—what are called plate kinematics—without providing an understanding of the underlying causes of plate motion. Why do the plates move? Why does Earth have plate tectonics and Venus and Mars do not? Why are there volcanoes at spreading centers and convergent margins? What are Earth’s inner movements and how do these relate to the exterior movements of the plates? For our comprehension of Earth as a total system, the plate tectonic revolution provided only the skeleton. What we begin to probe in this chapter are the connections among Earth’s diverse layers and, in particular, how the movement of plates at the surface is connected to circulation of the mantle beneath the plates.
At first glance this question may seem far removed from planetary habitability. As we shall see in subsequent chapters, however, the fluxes of materials to and from Earth’s solid interior are central to a stable climate, to the existence and chemical compositions of ocean and atmosphere, and to the origin and evolution of life.
Simple consideration of plate tectonics leads to the conclusion that movement of plates at Earth’s surface must have a corresponding movement of the mantle beneath. At both spreading centers and subduction zones, mantle flow is required. Material injected into the mantle at subduction zones must displace the mantle below. At ocean ridges, mantle melting requires the upward flow of solid mantle for melting to occur (see Chapter 7).
Flow of rocks is not an intuitive concept for us. Near the surface, within the lithosphere, rocks do not flow—they crack and displace along faults. Fault movements create the earthquakes that are familiar to us. Earthquakes, however, only occur in the outermost portions of Earth—the top 10–15 km at spreading centers, and down to a few hundred kilometers at Benioff zones. Apart from the seismic zones, movement must also be occurring to compensate for spreading and subduction. The boundary between brittle movement along faults and ductile flow without faults divides the mantle into the brittle lithosphere and the ductile asthenosphere. Seismic waves tell us that the mantle is solid; therefore, flow in the asthenosphere must be solid flow.
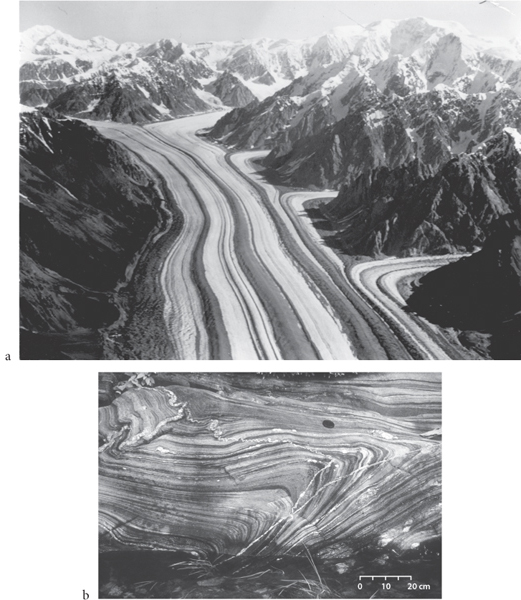
Although flow of solids has a ring to it that is not familiar to us, deformation of solids is within our experience. For example, each time we bend a paper clip, or when iron or copper are heated and forged into new shapes in the solid state, solids are deforming. In glaciers there is flow of solid ice that is visible and observed on human timescales, and the folds observed in rocks that are uplifted to the surface also clearly show deformation and flow (Fig. 11-1a). Solids can flow when they are at temperatures that are close to their melting temperatures. Therefore ice flows on the surface, but rocks do not. At depth in the mantle, and at some locations in the deep continental crust, temperatures are high enough that flow in the solid state must be possible.
Fig. 11-1: Illustration of flow in the solid state. (a) Aerial photograph of the Barnard Glacier that shows glacial flow (courtesy of Robert Sharp, California Institute of Technology and the University of Oregon Press, Eugene, Oregon); (b) Photograph of a folded rock, Gneiss, Cabonga Réservoir, Québec (courtesy of J. P. Burg, ETH Zurich).
Proof of mantle flow in the solid state also comes from studies of the origins of Earth’s topography: why are mountains high? Why are the oceans deep? Why are the continents rising today in northern Canada and Scandinavia?
Our common sense perception of topography is that it simply reflects the thickness of material that is added to or removed from a certain spot. If we dig a big hole in the ground, the elevation is lower at the bottom of the hole and higher where the excavated dirt is piled up. Such conclusions apply, however, only when the underlying material is rigid and does not respond to the change in weight. If the underlying material can flow, it adjusts to the weight of the object placed upon it.
For example, we can’t dig a hole in a liquid because liquid flows to accommodate forces. Wood placed in water sinks to a certain level, pushing the water underneath aside. The depth that the wood sinks follows a simple principle—the water flows from high pressures to low pressures until the pressure is equalized everywhere at the same depth. Therefore the pressure at the interface of the bottom of the wood with the water beneath it must be identical to the pressure of a column of water next to the wood at the same depth. If it weren’t, the water would flow and adjust until the pressures equalized. This depth where the pressures are the same is referred to as the depth of compensation; when material floats so that pressures are all the same at depth, the material is said to be compensated. This principle was discovered originally by Archimedes, who recognized that floating objects must displace a mass of liquid equal to their weight. For Earth, this concept is referred to as isostasy—iso (equal) stasis (standstill). Isostatic adjustment means that Earth’s surface rises or falls in response to a change in load.
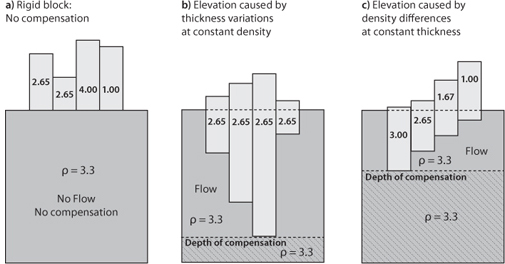
To visualize how this works in practice, consider two examples, one where the mass is compensated and one where it is not. What happens if we place a sheet of plywood 1 cm thick and a beam 20 cm thick with the same density in a tub of water? The beam sinks deeper than the plywood and also sticks out of the water a few cm higher than the thin sheet, but not the full difference in thickness. Looking underwater, we would see the beam protruding deeper than the plywood. At the depth of compensation, below both pieces of wood, the pressure is the same everywhere and the masses are compensated. If instead we place the beam and plywood on a rigid table, the top of the beam rises fully 19 cm higher than the plywood, the bottoms are at the same level, and there is no spot below them where the pressures are equal. The pressure beneath the beam is much greater than beneath the plywood. The water flows; the table does not.
Which of these possibilities reflects how Earth works? If the inner Earth were rigid, a mountain range 2 km high could simply reflect two extra kilometers of rock (Fig. 11-2a). Or, if the supporting material beneath the mountains can flow over long periods of time, then the mountains must have a deep root to compensate for the higher elevation (Fig. 11-2b).
If we could measure the pressures at depth beneath the mountain range and beneath flatter regions, it would be straightforward to tell these models apart, but that would require impossible measurements deep in Earth’s interior, some 100 km or so below the surface. Geophysicists found a clever way to answer this question, however, by making use of the slight variations in Earth’s gravity field. The gravity field reflects the total mass of a column extending down from Earth’s surface to the core. If the mountains are extra mass piled on top of the crust, then their additional mass should cause the gravitational field to be greater. If the topography is compensated, then the total mass of any column is the same, and the gravity field should be similar over mountainous regions and low elevation plains. Even the first crude measurements made in the nineteenth century showed that mountains do not add substantially to the gravity field, and therefore vertical columns through the Earth all have about the same mass. Conclusion: the mantle must flow in response to the weight of the crust that is above it (Fig. 11-2).
One additional complexity comes from density differences. As we learned in Chapter 4, different materials can have different densities, and varying density can also lead to topographic differences. Imagine a block of styrofoam and a block of the same thickness of dense hardwood floating in the tub of water. The styrofoam sticks up much higher, because its light weight is compensated by a very small volume of water. Both thickness and density contribute to topographic differences (Figs. 11-2b and 11-2c, respectively). So an alternative compensation model could be that mountains are high because they are made up of light rocks. But are they? Inspection of the rocks on continents—generally granites and metamorphosed sediments—shows that their densities are similar in all continental regions, suggesting mountain ranges are regions of thick crust rather than light rocks. Seismic results have confirmed these inferences from the gravity field; mountain ranges have deep roots and continental topography largely reflects crustal thickness (Fig. 11-2b).
Fig. 11-2: Three different models of variation in elevation. (a) differences in elevation result from accumulation of material without compensation, leading to pressure differences at depth. The rigid block underneath the material does not allow flow; (b) differences in elevation result from differences in thickness of the lighter material because the underlying material can flow; (c) differences in elevation results from differences in density. Model b applies to continents; model c applies to the increase in ocean depth with age discussed in Chapter 9. At any one age on the seafloor, model b can apply where there are differences in crustal thickness. Model a is not how topography on large scales is accommodated on Earth.
Isostasy then gives us the tools to consider the bimodal distribution of elevations on Earth seen in Figure 10-1. Why are the oceans deep? The difference between oceans and continents has to do with both thickness and density. The ocean crust is both thinner (~6k m vs. 35k m) and 10% denser than the continental crust, causing it to exist at much lower elevations.
Isostasy also explains the variations of depth within the ocean basins. The increasing depth of the seafloor with age in the oceans discussed in Chapter 10 is caused by subsidence, as the density of crust and mantle increases as the plate ages and cools. There can also be depth variations at constant age. Iceland, at zero age on the Mid-Atlantic Ridge, is above sea level! Depth variations at constant age depend on the thickness of the ocean crust, as influenced by the temperature of the mantle during melting. Figure 11-2b applies to depth variations of the ocean floor at any one age, while depth variations as a function of age are akin to what is illustrated in Figure 11-2c.
The fact that oceans and continents both reflect isostatic adjustment requires that the mantle can flow, like water but much more slowly. If Earth’s interior were rigid, isostatic compensation would not occur.
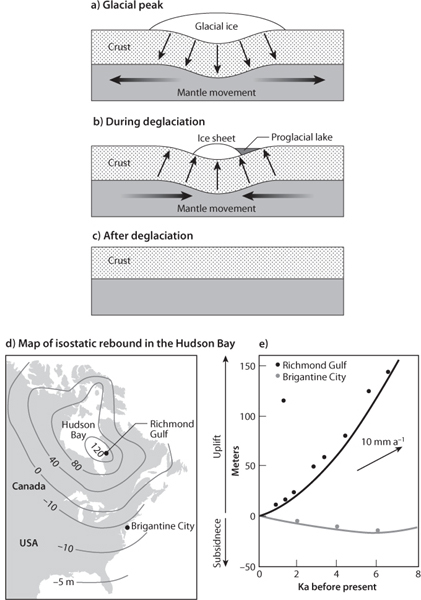
How rapidly can the mantle flow? To provide us with an answer to this question, Earth has provided a natural experiment that allows observation of isostatic compensation in action. During the last glacial period, several kilometers of ice covered Canada and Scandinavia. The weight of the ice was an added load and caused the continents to sink as the mantle flowed away in response to the load. When the ice melted, the load was removed, and the continents were able to rise (Fig. 11-3). Because isostatic adjustment takes many thousands of years, the continents in these regions still rise at measurable rates today (Fig. 11-3b), a phenomenon called postglacial rebound. The stiffness of the mantle recorded by postglacial rebound provides crucial information as we evaluate another larger scale form of mantle flow, mantle convection.
All flow is a response to forces. As we have just seen, isostatic adjustment occurs because of changes in load at the surface. Force can also be exerted within the mantle whenever light material underlies denser material. For example, a hot thermal boundary layer between the outer core and the deep mantle causes the mantle to be heated from below; thousands of km above, cold boundary layers at the top of the mantle cause the mantle to be cooled from the surface. Heating causes expansion and lowered density, while cooling causes contraction and increased density, so these boundary layers create light material underlying denser material. If the mantle is not too stiff, then it will circulate through a process called thermal convection.
Fig. 11-3: (a)–(c) Illustration of isostatic adjustment caused by glacial loading and unloading. Glaciation adds mass to the surface and causes the continent to subside as the mantle flows away. When the ice melts, postglacial rebound occurs. (d) A map of postglacial rebound of the Hudson Bay area and part of North America, a process that continues today. Numbers within the contours are uplift or subsidence in meters. Note the major uplift centered on Hudson Bay. (e) Uplift over time of two cities in (d). Figure from R. Walcott (1973), Ann. Rev. Earth and Plan. Sci., 15.
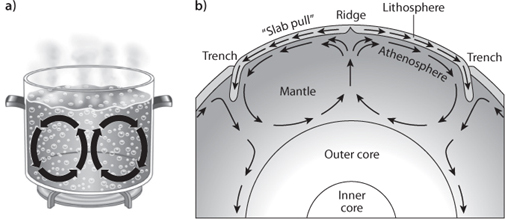
Fig. 11-4: (a) Comparison of the simplest form of convection illustrated with water in a heated stove, leading to a circular convection cell; (b) schematic view of a hypothetical (and partially wrong) relationship between subducting plates being associated with the downwelling limb of a convection cell and ridges being caused by convective upwelling of the cell. (Note that this simple framework does not generally apply to Earth’s plates.)
The simplest kind of convection leads to convection cells, where hot material ascends at one location, flows laterally, cools off, and descends. The zones of ascent and descent define the cell (Fig. 11-4a). We see convection in action when liquid is heated on a stove, when hot air rises above a heater, or when cold air flows downward off a cold drink or ice tray. Solids as well as liquids can convect, provided the solid material can flow. The convection cell concept has a superficially compelling parallel with plate tectonics—plates form above ascending mantle at ocean ridges, cool off as they spread away from the ridge, and descend as cold slabs at subduction zones. Many drawings of plate tectonics (e.g., Fig. 11-4b) show just such a relationship between mantle flow and plate movement. If this were true, it would suggest direct and simple connections between the interior flow of the mantle, the creation and destruction of crust and plates, and the lateral movement of plates across the surface. The plates would be driven by the pattern of mantle convection.
This scenario requires that mantle convection occurs. Not all materials convect—most solids we are familiar with at the surface do not convect, and that includes the large masses of rock that make up mountains. Isostasy requires flow, but not necessarily convection—it all depends on the forces. So we have two fundamental questions:
(1) Does the mantle have the properties that make convection likely at conditions within the Earth?
(2) If so, does the pattern of convection conform to plate boundaries at the surface?
While convection is the response of matter to variations in density, even in the face of density variations convection does not always occur. It depends on the magnitude of the density anomalies, the viscosity of the material, and the distances involved. Large density anomalies, low viscosities, and large distances all enhance convection.
Density differences are often driven by changes in temperature. The critical factor driving convection is when convection would lead to more rapid dissipation of temperature differences than escape of heat through conduction. The mantle has large temperature differences, but the rocks of the mantle are very stiff, inhibiting convection. A battle exists between the forces driving and inhibiting convection. How do we tell what wins? Careful investigation of convection both in theory and in the laboratory has given rise to a parameter that indicates whether or not convection will occur. The parameter is known as the Rayleigh number, developed by Lord Rayleigh in 1915. The Rayleigh number makes use of parameters that are familiar to us, such as distance (h), temperature (T) and viscosity (η) and two other parameters that may be less familiar. One is the coefficient of thermal expansion (α), which is the measure of how much an object expands in response to increasing temperature. The second is the thermal conductivity (κ), which is a measure of how quickly heat diffuses through a material. Metals, for example, have high thermal conductivity, which is why they are used for pots, because the metal transfers the heat rapidly. Rocks have lower thermal conductivity, which is why rocky materials are used on the outside of blast furnaces—they do not let much heat out. Very hot stones are used for tabletop cooking in some restaurants because the stones retain their heat for a long time.
Convection is enhanced by factors that cause large density differences to exist and persist. The product of temperature difference and coefficient of thermal expansion (α) determines the density differences, and the forces they cause are also enhanced by a larger gravitational field (i.e., the same mass of rock on the moon weighs less than on Earth). Greater distances (h) make it more difficult for heat differences to diffuse away, hence the density contrasts that drive convection remain in place, and make convection more likely. Convection is inhibited by increased thermal conductivity (κ), which allows the temperature differences to diffuse away rapidly, and by high viscosity (η) that makes it difficult to flow.
The Rayleigh number puts the terms that enhance convection (temperature differences, coefficient of thermal expansion, distance, gravitational acceleration) in the numerator and those that inhibit it (thermal diffusivity and viscosity) in the denominator. The Rayleigh number has the form:
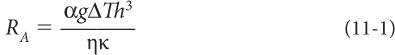
where g is the gravitational constant and T is the temperature contrast between top and bottom. When the Rayleigh number is greater than about 2,000, convection is inevitable. As the Rayleigh number increases, the convection becomes more and more active, and ultimately turbulent and chaotic (Fig. 11-5).
The Rayleigh number for the mantle can be calculated. Distances are known, and the coefficient of thermal expansion and thermal conductivity of mantle peridotite have been measured in the laboratory. Temperature is constrained by the compositions of volcanic rocks (see later in this chapter) and the heat that flows from Earth’s rocks. The most difficult parameter to constrain is viscosity. The best estimate comes from the isostatic response of the continents to glacial loading and unloading, illustrated in Figure 11-3. The rate of rise depends on the viscosity of the mantle. In a bathtub, a cork will pop up very quickly if a weight is removed from it because of the low viscosity of water. The cork would pop up much less quickly in peanut butter because peanut butter has higher viscosity and would flow into the space under the cork more slowly. By measuring how quickly North America and Scandinavia rose after the last glaciation, the mantle viscosity can be calculated to be about 1021 Pascal seconds—which is 1024 (a trillion-trillion) times more viscous than water! (To put that in perspective, peanut butter is about 200,000 times more viscous than water.)
While the mantle viscosity is large, the distances and temperatures are large as well, and diffusive removal of temperature differences is very slow. Once all the numbers are plugged into the Rayleigh number equation, it turns out that despite the very high viscosities, the Rayleigh number for the mantle is a million or more! This number vastly exceeds the value of 2,000 that is the threshold for convection, and mantle convection is inevitable. The high Rayleigh number of the mantle led the great British geologist Arthur Holmes to be the first to suggest a possible link between mantle convection and continental drift in the 1950s.
At very high Rayleigh numbers, however, convection is no longer a simple pattern of symmetrical convection cells (e.g., Fig. 11-5a) and can have multiple ascending hot jets and a much less organized form (e.g., Fig. 11-5b). The uncertainties in the mantle Rayleigh number are sufficient that we cannot know a priori what form of convection the mantle would undertake. And of course, Earth is not a simple box like many convection experiments. Are there simple convection cells corresponding to plate margins? Or is the convection pattern more consistent with upwelling plumes that come and go in a complex pattern? What does Earth have to tell us about convection of its interior? For answers to those questions, we need to turn to the evidence that Earth provides.
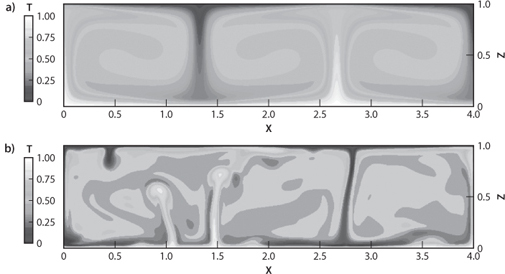
Fig. 11-5: Numerical models of convection illustrating the effect of increased Rayleigh number: (a) at a modest Rayleigh number of 105 (top panel) a simple convection cell forms; (b) as the Rayleigh number increases (Ra = 107), convection becomes much less organized and more turbulent, with vigorous ascending and descending plumes. In the figure you can see some plumes extending from the base to the surface, and some that are just beginning to rise. See color plate 12. (Figure provided by Thorsten Becker)
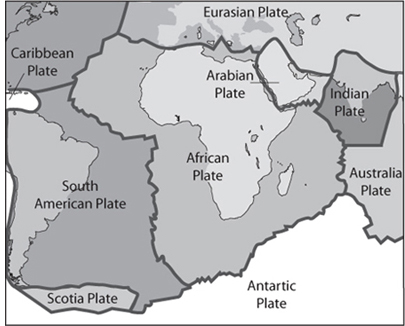
A more careful consideration of the details of plate boundaries shows there cannot be a simple relationship between plate margins and convection cells. While cartoons of plate movement often show nice, regular convection cells, the actual geography on Earth is far more complicated. For example, a reinspection of Figure 10-11 shows that the distance from the East Pacific Rise to the western Pacific subduction zones is some 10,000 km, while off the northwestern United States the Juan de Fuca Ridge is only a few hundred kilometers from the Cascadia subduction zone. How could convection cells be of such different sizes? Even more problematically, the African and Antarctic plates are mostly surrounded by ridges (Fig. 11-6) with no associated subduction zone that could be a downwelling limb of a convection cell. Clearly, the mantle cannot consist of regularly sized convection cells.
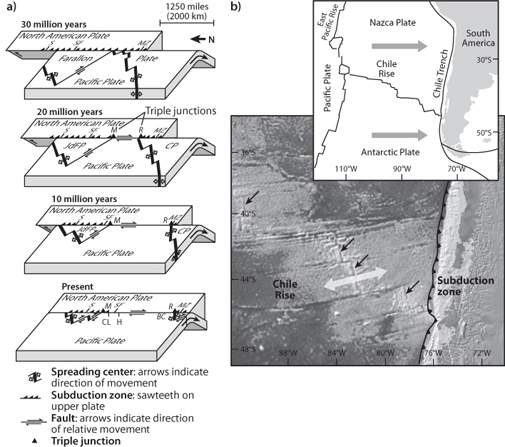
The final nail in the coffin for the simple convection cell concept is the fact that ridges can be subducted. The East Pacific Rise used to be continuous from the South Pacific all the way up to Washington State, and subduction off the coast of California led to the creation of the Sierran volcanoes, now eroded down to their granitic roots. Because of the expansion of the Atlantic Ocean basin, the Pacific is contracting, and this caused the North American subduction zone to swallow up the ridge. Once this ridge was subducted, California became cut by the San Andreas Fault (Fig. 11-7a). Today ridge subduction is occurring at several places, including the subduction of the Chile Rise beneath southern Chile (Fig. 11-7b). Upwelling and downwelling convection limbs cannot be in the same place, so spreading centers cannot correspond with upwelling limbs of major convection cells.
So then, what are ocean ridges and how do they relate to mantle flow? This question is also amenable to evidence from observations. Because Africa has ridges on the east, west, and south, the continent is approximately stationary. As spreading occurs, the ridges are moving away from the continent as they produce more and more ocean crust and the African plate grows in size. The Mid-Atlantic Ridge, for example, began adjacent to the African continent when South America and Africa split apart and has steadily migrated westward as the South Atlantic has opened. Its westward migration is half the speed of the total separation of South America from Africa. At the same time, the Central Indian Ridge on the eastern side of the continent has migrated eastward. The two ridges steadily move across the mantle below and increase their separation. Limbs of convection cells in something as large as the mantle will be quite stable for long periods of time, and if ridges were above upwelling limbs, they should stay put. Instead, ridges glide rapidly over the mantle, at speeds that can be similar to spreading rates! Careful measurements around the globe show that virtually all the ridges are migrating over the surface.
Fig. 11-6: Map of some of Earth’s plates. Note that the African plate is largely surrounded by ridges with no associated subduction zones and therefore is growing to south, east, and west, as the ridges become increasingly distant from the continent through time. There can be no regular pattern of “convection cells” associated with plate margins. Instead, the growth of the Atlantic is compensated by excess subduction in the Pacific as the Pacific Ocean basin shrinks in size. (Image from U.S. Geological Survey’s This Dynamic Earth; http://pubs.usgs.gov/gip/dynamic/dynamic.html)
Fig. 11-7: (a) History of the former Farallon plate that used to exist west of California. The contraction of the Pacific Ocean basin caused the plate and its associated ridge to be progressively swallowed by the subduction zone. At some later time the Juan de Fuca Ridge will also be subducted (courtesy of U.S. Geological Survay). (b) The Chile Rise spreading center is currently being subducted beneath southern Chile (base map is from GeoMapApp; http://www.geomapapp.org). See also color plate 14.
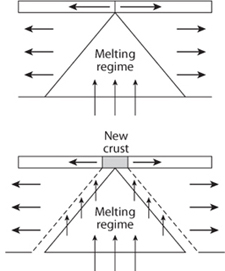
The solution to all these observations is to recognize that most spreading centers (we will see the exceptions in a moment) generate their own mantle flow as they spread, rather than reflecting the active forces associated with deep convective upwelling. This is referred to as passive upwelling in contrast to dynamically driven active upwelling associated with large-scale mantle convection. An illustration of how this works is shown in Figure 11-8. Because plates separate from each other at the ocean ridge and thicken with age, each increment of spreading opens up a vertical gap in the mantle beneath, and the mantle must rise to fill the gap. As the ridge spreads, the shallow mantle rises beneath it. The upwelling is a shallow feature caused by the spreading itself—local flow imposed from the kinematics of spreading, rather than convective flow driven by the Rayleigh number. This flow is localized in the uppermost mantle, rather than reflecting deep-seated mantle convection. In this case ridges can skate across Earth’s surface like water spiders, and when the ridges reach subduction zones they just get carried into the mantle and disappear. When a plate cracks in a new location and spreading begins, the spreading causes local upwelling to begin directly beneath it. Spreading centers cause local upwelling generally not associated with deep-seated mantle convection.
Fig. 11-8: Illustration of mantle upwelling driven by plate movement. The two panels show the sequence of spreading. Top panel shows a steady state of melting regime beneath the ridge. Bottom panel shows one increment of spreading. As the plates move laterally, the movement opens up a “gap” that the mantle rises to fill. The ascent depressurizes the mantle, causing it to melt. The melt rises to create new ocean crust. Of course, the process is not incremental but continuous. Continuous spreading of the plates causes localized upwelling beneath the ridge, independent of whatever else is happening in the mantle beneath. Because the plates extend only to about 100 km depth, the upwelling is primarily in the uppermost mantle.
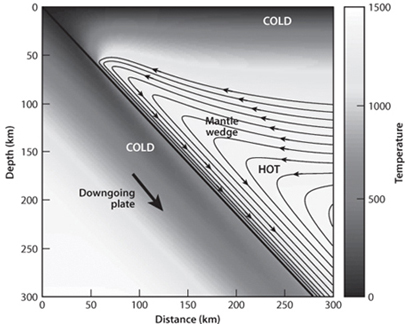
Subduction zones are a different story, because the down-going plate is thick and cold, and we know from the Benioff zones that the plates extend down to 700 km in the mantle. They cannot be associated only with shallow processes. The deep downward movement of the plate also causes the adjacent mantle to move in the same direction, causing a wide region of cold downwelling (Fig. 11-9). Sophisticated seismic imaging techniques of recent years show “slabs” of old subducting plates extending deeper than the seismic zone. In certain regions they extend down 1,500 km or more into the mantle (Fig. 11-10). Subduction zones are therefore associated with deep downwelling convection, although the flow is by no means vertical. They are the cold downwelling half of mantle convection.
Fig. 11-9: Calculation of flow and thermal structure of a subduction zone. The cold slab dips down into the mantle, causing cold temperatures in the overlying mantle wedge, and “corner flow” of the mantle where the mantle on the left moves to the right, makes a sharp turn downward, and is dragged down by the movement of the down-going plate. This leads to widespread mantle downwelling associated with subduction zones. See color plate 15. (Figure courtesy of Richard Katz)
Brad Hager and Rick O’Connell at Harvard expressed this behavior as “mantle convection driven by the plates.” Plate movements cause local upwelling at ridges and major downwelling at subduction zones. The upper mantle flows in part in response to the movements of the over-lying plates. Rather than being driven by mantle convection, it appears that the plates are themselves important drivers!
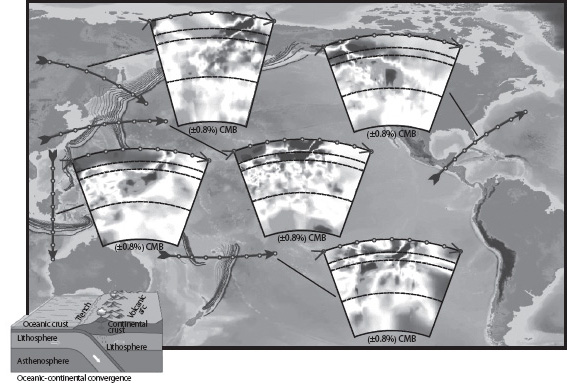
Fig. 11-10: Mantle images created by seismic tomography, showing the diversity of slab subduction. Heavy arrows on the maps show the cross sections. Insets are vertical profiles into the Earth showing seismic velocity variations. Slabs can be seen as darker colors at depth. The top two dashed lines in each inset show the phase transitions of the upper mantle. The third dashed line is at depths of 1600 km. Note that for Central America on the far right and Sudan on the far left the slab (dark colors) appears to extend to great depth. In other cross sections, the slab seems to be detained near the bottom of the upper mantle. See color plate 16. (Modified after Li, C., et al. A new global model for P-wavespeed variations in Earth’s mantle, Geochemistry, Geophysics, Geosystems, vol. 9, Q05018, doi:10.1029/2007GC001806. Figure courtesy of Rob Van der Hilst)
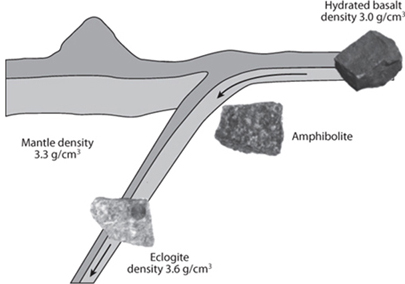
If plates are not riding along on top of mantle convection cells, why do the plates move? One driving force appears to be the change in mineralogy that takes place at subduction zones. As we learned in Chapter 4, the stability of minerals depends on pressure and temperature; at higher pressures mineral assemblages become denser. Such a transformation occurs for the basaltic rocks of the subducting crust. At the surface they have a density of about 3.0gm/cm3, but at depths of about 50 km basalts undergo a transformation to a garnet-bearing rock called eclogite with a density of 3.35 gm/cm3. This high-density material is a large weight on the deep end of the subducting plate and tends to drag it downward (Fig. 11-11). The other end of the plate, at the spreading center, is much higher than the surrounding ocean floor. The elevation of the ridges tends to push the plates away from the ridge. One can think of it as a gravity slide, sliding downhill from the ridges and being pulled by the extra weight at the bottom of the subduction zone. Both “ridge push” and “slab pull” tend to make the plates slide across the surface.
Fig. 11-11: Illustration of the change in mineralogy that occurs as a slab is subducted. At high pressures, the basalt converts to eclogite, which has a higher density than the surrounding mantle, which makes the slab dense and leads to “slab pull,” one of the important driving forces of plate motion.
But wait—what about the high Rayleigh number of the mantle that we saw earlier in the chapter would drive active mantle convection, including active upwelling? If the ridges are shallow and passive, where is this inevitable active upwelling component of mantle convection? And if the subduction zones move deep into the lower mantle, where is the compensating movement that takes material from the lower mantle to make room for them? Because of its high Rayleigh number, the mantle must also have a convective life of its own, with temperature variations and complex circulation. This deeper aspect of mantle convection is revealed from observations from the chains of ocean islands that occur throughout the ocean basins.
While ~90% of Earth’s current volcanism is associated with plate boundaries, there are a significant number of volcanoes that occur in the middle of plates, a phenomenon called intraplate or hot spot volcanism. And in the past there have been vast volcanic outpourings that made continental flood basalts and oceanic plateaus. Many of these also occur on continents or in the middle of oceanic plates. Some of the most famous volcanoes in the world—e.g., on the island of Hawaii (Fig. 11-12a) or at Yellowstone National Park—are intraplate volcanoes, in some cases thousands of kilometers distant from any plate margin. This volcanism must reflect active upwelling because it is even able to penetrate old, thick plates and light continental crust. Here is where we find the evidence for the active upward movement of mantle convective flow and where we can address the questions of whether the flow is diverse hot rising jets or stable upwelling limbs.
Much intraplate oceanic volcanism is associated with island chains, which are prominent features in maps of the seafloor (Fig. 11-12a). The chains might reflect a long rift associated with upwelling, or they could be produced by a point source that was fixed in location as the plate migrated over it. Which is it?
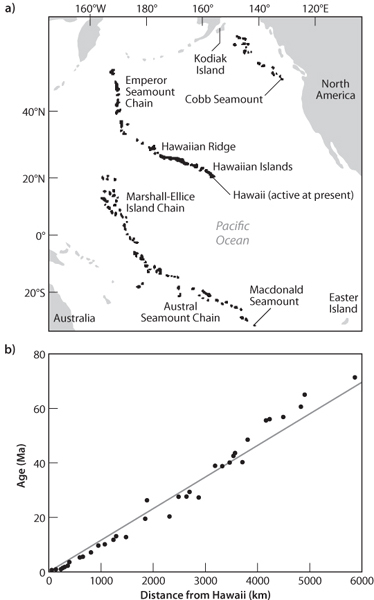
The answer to this question comes from both geochemistry and geophysics. The Hawaiian chain begins with the active volcano of Hawaii at the eastern end and then progresses to lower and lower islands toward the west, followed by a large number of submerged volcanoes, called the Emperor Seamounts (Fig. 11-12a). The active volcanoes are on the youngest island. Volcanoes on other islands and submerged seamounts are extinct. Careful dating of rocks from these young and old volcanoes shows there is a simple age progression all the way along the chain (Fig. 11-12b), and the age corresponds closely with the independently determined spreading rate of the Pacific plate.
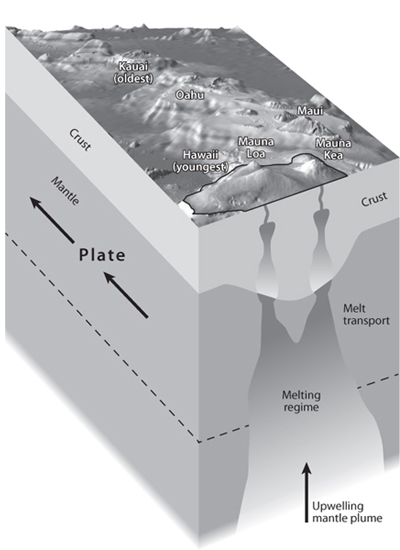
Such chains of volcanism were a mystery until the discovery of plate tectonics suggested a simple origin. Jason Morgan, one of the founders of plate tectonics, noticed that the chains followed the direction of absolute plate motion and could be explained by a fixed “hot spot” in the underlying mantle. This concept is illustrated in Figure 11-13. As the plate moves across a fixed point in the upper mantle, the spot on the plate currently over the fixed hot spot has an active volcano. The next volcano down the line was recently at the hot spot, but has been moved away from it by plate motion. Over time, this creates an island chain of progressively older volcanoes; only the youngest volcano directly above the hot spot is active. The “bend” in the Hawaiian chain possibly indicates a major change in plate motion that occurred at 43 Ma, when a change in the configuration of subduction zones led to an abrupt change in direction of the movement of the plate. The young volcanoes rise above sea level because the excess volcanism creates thick crust. Then they subside as the plate ages. The hot spots are mantle plumes rising beneath the plate at a single point, akin to the pattern of upwelling shown in Figure 11-5b rather than 11-5a. Active mantle convection consists of rising jets of hot material that occur independent of spreading center location and are usually far from downwelling limbs of cold material associated with subduction.
Fig. 11-12: (a) Map of the Pacific Ocean showing the linear chain of islands and seamounts associated with Hawaii. Active volcanoes on the island of Hawaii form the currently active end of the chain, where island growth is taking place today. Older islands were formed in the past above the same spot but have been carried away by motion of the Pacific plate. As they age, the islands are eroded and subside, ultimately leading to completely submerged structures that make up the Emperor Seamount Chain. (b) Graph showing how the ages of Hawaiian islands and seamounts vary regularly with age. The slope corresponds with the spreading rate of the Pacific plate. (Modified after K. C. Condie, Mantle Plumes and Their Record in the Earth History (Cambridge: Cambridge University Press, 2001))
Fig. 11-13: Illustration of the model for the age variation in the Hawaiian islands and seamounts, where there is a fixed hot spot in the upper mantle, likely fed by a stationary mantle plume. As the Pacific plate migrates over the hot spot, islands are formed and then carried away by the movement of the plate. See color plate 17.
The mantle plume hypothesis received additional evidence from high temperatures of plume-derived magmas and the close association of “plume heads and tails” that linked dynamic understanding of plumes to evidence from Earth’s surface. We now explore this in greater detail.
We know that melting must occur by pressure release at hot spots, and this requires upwelling of solid mantle. For plumes the upwelling is not produced by the plate motion. Instead, the plate serves as a cold cap that actually can inhibit melting. The only way to produce plume volcanism in the middle of a plate is through active upwelling, that is, a plume of buoyant material rising through the mantle. Since the physical properties of the mantle do not vary much, the main creator of buoyancy is high temperatures, and hence ocean islands are believed to be created by hot mantle plumes that are fixed in position in the mantle.
If this is true, then mantle temperatures of plumes must be hotter than their surroundings. In this case, the pressures and temperatures of hot spot magmas should be greater than ambient mantle, as reflected, for example, by normal ocean ridges. Both predictions correspond with the detailed compositions observed at hot spot volcanoes and also explain the excess crustal thickness that always occurs where plumes reach the surface.
The fixed positions of hot spots also suggest they are derived from a deep and hot thermal boundary layer. The upper mantle is continually being moved about and stirred by plate motion, and contains an important component of horizontal movement. If plumes were generated from within this convective flow, they should be transported by the convective flow and move across the surface. Instead, the hot plumes at fixed position imply that the plumes come from much deeper levels, where their position is independent of upper mantle convection. This can occur if plumes arise from hot boundary layers, as seen in Figure 11-5b. Just as in a lava lamp, where material is heated from below, it gradually becomes buoyant and rises as a plume to the top of the lamp, mantle heated from below can produce plumes that would rapidly ascend to the surface. The existence of the fixed mantle plumes suggests a hot boundary somewhere deep in Earth’s interior.
Great debate has taken place concerning whether this boundary layer exists at intermediate depths in the mantle or occurs at the core/mantle boundary. Recent high-resolution seismic imaging suggests that at least some of the mantle plumes originate in the deepest portions of the mantle and therefore may result from heating at the core/mantle boundary. Thermal modeling of the temperatures of the core suggests it is much hotter than the lower mantle. With its low viscosity from its liquid state, the outer core must convect vigorously, removing any cooled material that forms at the core/mantle boundary and maintaining a very thin and extreme thermal boundary layer with the mantle above. The hot thermal boundary layer beneath the mantle would be a natural, perhaps inevitable, source of rising convective plumes.
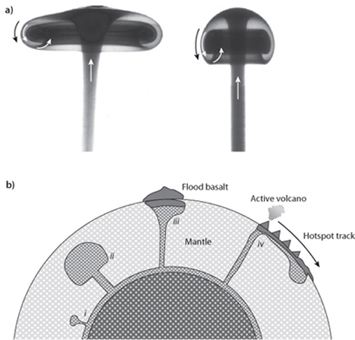
Modeling of plumes from a hot thermal boundary layer shows that they begin with a “plume head,” a massive rising hot ball of material that is followed by a “plume tail,” which is a narrow rising jet following the same track (Fig. 11-14). The plume heads would lead to an initial massive volcanic episode at plume initiation, followed by a long period of smaller amounts of volcanism from the same spot.
These features predicted from the hypothesis of hot plumes from a deep boundary layer correspond with the plume tracks that begin with a massive volcanic outpouring and continue for tens of millions of years of hot material of lesser volume. Examination of many of the age-progressive chains of hot spot volcanism shows that they begin with flood basalt if it occurs on land, or an oceanic plateau if it occurs in the ocean. These are massive outpourings of lava over very short periods of time. Several of these are apparent in the South Atlantic and Indian Oceans (Fig. 11-15). For example, the Deccan flood basalt province in India is the manifestation of a plume head and is contiguous with a long ridge of progressively younger basalts heading to the south (Fig. 11-15). In North America, the Columbia River Basalts appear to be the earlier flood basalts associated with the hot spot that is currently beneath Yellowstone National Park. The age of the flood basalts corresponds with the age progression measured along the track of the hot spot. Many hot spot tracks appear to have a flood basalt initiation, followed by tens of millions of years of intraplate volcanism along a well-defined spatial trajectory. (Hawaii is an exception in having no flood basalt province, possibly because its distal end is being subducted). The topographic expression at the surface is almost like a plume “head and tail” laid on its side on Earth’s surface (Fig. 11-15).
Fig. 11-14: (a) Model of plume head and tail based on work by Ross Griffiths, Ian Campbell and others. The first arrival of the plume at the surface is associated with a large plume head that can give rise to a massive volcanic outpouring. Subsequent volcanism would come from the “tail” of the plume, producing steady volcanism but of lesser volumes. (After Griffiths and Campbell, Earth Planet. Sci. Lett. 99 (1990):79–93; http://www.mantleplumes.org/WebDocuments/Campbell_Elements.pdf) (b) Cartoon of the manifestation of plume head and tail in Earth’s interior: (i) plume forms at the core mantle boundary; (ii) plume head expands because of rapid transport within the conduit; (iii) plume head reaches surface to create a flood basalt province; (iv) after the flood basalt, plume tail creates a hot-spot track of smaller volcanoes as the plate at the surface displaces over the plume. (Modified from Humphreys and Schmandt, Physics Today 64 (2011), no. 8: 34).
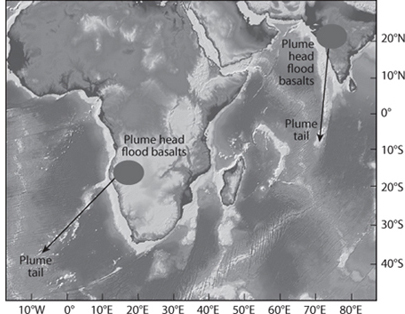
There are many hot spots on Earth. Those associated with intraplate volcanism are concentrated in two large regions approximately one hemisphere apart from each other. One is the central Pacific, where there are many ocean islands such as Tahiti, Samoa, Mauritius, and Hawaii. The second is in the vicinity of Africa. The Pacific is generally surrounded by subduction zones. The African plate is surrounded by ridges, as we have seen in Figure 11-6. Characteristic of both regions where hot spots are concentrated is that they are far from plate boundaries—they occur in the middle of large plates and are probably associated with a general component of plume-driven mantle upwelling in these regions.
Fig. 11-15: Map illustrating the actual manifestation at the surface of a plume head and tail. The plume head would lead to a flood basalt province of massive volcanism. As the plume remained stationery, movement of the plate over the surface would create a long ridge of volcanism with a steady progression of ages. See color plate 18. (Map modified from image created by GeoMapApp; www.geomapapp.org)
These results suggest that mantle convection on a real planet such as Earth is far more complicated and interesting than tank experiments and calculations. Flow in the upper mantle is driven by the movements of the cold boundary layer (the plates) at the surface. The component of hot, active rising flow is manifested by plumes rising from hot thermal boundary layers at depth. Of course, these two aspects of convection interact with one another, creating a complex flow and temperature field for the mantle as a whole that is only beginning to be known.
The ocean ridges provide a potential window into lateral temperature variations in the mantle. As the ocean ridges traverse the surface, they passively sample the mantle underneath. The temperature of the mantle controls the variations in depth and thickness of the ocean crust, creating observable features on the seafloor that relate to conditions in the mantle. Ocean ridges provide a potential “window” into the temperature structure of the mantle, which should correspond with the convective structure of the mantle. To understand how this works, we need to examine more carefully the melting processes that take place to form ocean crust at spreading centers.
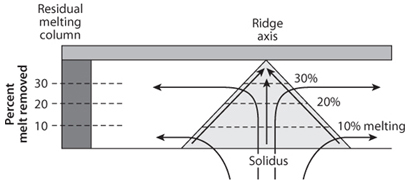
We learned in Chapter 7 how partial melting of the mantle by pressure release (rather than temperature increase) is the fundamental mechanism by which melting occurs at ocean ridges. As we saw in Figure 11-8, the spreading of the plate creates an inevitable upward movement of the mantle underneath. This movement can be related to pressure release melting. Figure 11-16 shows how the path of mantle flow beneath the ridge creates a melting regime that is more or less triangular in shape. The amount of melting increases from 0% at the base of the triangle, where the solidus is crossed, to a maximum extent of melting for the central column of melting that ascends to just beneath the ocean crust. If melting increases linearly with decreasing depth, the mean extent of melting is half the maximum.
Since the ocean crust is formed from the melt extracted from the mantle, we can relate the thickness of crust to the volume of melt extracted from the melting regime. This is most simply visualized by considered the vertical column through the mantle and crust that is the end product of each increment of spreading. Each level in the residual mantle column comes from a different final depth in the melting regime. Experimental data show that the mantle melts about 1% for each 3 km of upwelling. So if the mantle ascends 60 km, it melts to a maximum of 20%. The mean extent of melting is then 10%, and 10% of 60 km is 6 km, which is the average thickness of ocean crust today.
Fig. 11-16: Illustration of ridge melting regime showing the formation of a residual mantle column created by each increment of spreading. The crustal thickness is the total melt removed from the column, which is the mean percentage of melting times the column length. Most ocean crust forms by about 10% melting of a 60 km column, leading to 6 km of ocean crust.
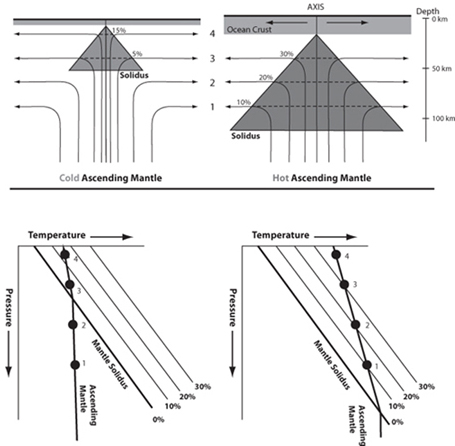
Now let’s consider what happens if the temperature of the mantle varies, as it must as the ridges journey across the upper mantle convective system (see Fig. 11-17). At higher temperatures, the mantle solidus would be crossed at greater depth beneath the ridge, and the size of the melting regime and length of the residual mantle column both increase. If melting were to begin at 90 km, then the maximum extent of melting would be 30% (90 km/3), the mean extent of melting 15%, and the crustal thickness would be 15% of 90, or 13.5 km. If on the other hand melting were to begin at 30 km, then the maximum extent of melting would be 10%, the mean extent of melting only 5%, and only 1.5 km of crust would be produced. These changes in crustal thickness have direct consequences for the depths of ocean ridges. The ocean crust is buoyant relative to the mantle and is subject to the principles of isostatic compensation. Ridges with thick crust float higher than thin crust, and therefore shallow ocean ridges should be associated with thicker crust and with higher temperatures in the underlying mantle.
The conclusion is that changes in the depth at which melting begins, which are a direct response to the temperature of the underlying mantle, control the thickness of the ocean crust and the depth of the ocean ridge. Hot mantle melts more and creates thicker crust and shallower ridges. The temperature differences can be quantified by knowing that the temperature at which melting begins increases by about 4°C for every kilometer of depth. Changing the initial depth of melting from 100 km to 60 km, for example, would reflect a temperature difference of about one hundred degrees.
Fig. 11-17: Illustration of how variations in the temperature of the mantle beneath the ridge influence the depth of melting, the size of the melting regime, the mean extent of melting, and the crust thickness. Hot mantle melts more, leading to thicker crust, which has shallower depths below sea level in response to isostatic compensation.
There are also chemical consequences of varying the extent of melting of the mantle. As we learned in our investigation of simple phase diagrams, liquid compositions change progressively with the proportions of melt produced. Therefore we would expect ocean crust derived by larger extents of melting to differ in composition from crust created by smaller extents of melting. One of the simplest chemical consequences relates to the magmaphile elements—those elements that are strongly concentrated into the liquid fraction no matter what proportion of liquid is present. The concentrations of these elements are inversely proportional to the fraction of liquid. If all of the sodium, for example, goes into the liquid, and the liquid forms only 1% of the total, then the sodium would be one hundred times enriched in the liquid relative to the whole. If the liquid proportion increases to 2%, then the sodium would be fifty times enriched, and at 10% melting, the sodium would be only ten times enriched. The same numbers of Na atoms are diluted by the increased melt volume as the percentage of melt increases. In practice, not all of the sodium goes into the liquid, but most of it does. For this reason, the same mantle composition that melts to greater extents owing to higher mantle temperatures should have lower Na contents that go along with the thicker crust and shallower depths.
This line of reasoning shows that the depths of ocean ridges, the thickness of the ocean crust, and the chemical composition of the ocean crust all should be related to one another. This relationship can be seen in Figure 11-18, where the sodium concentration in the ocean crust relates simply to the depth of the ocean ridge, a result that is a natural consequence of variations in mantle temperature.
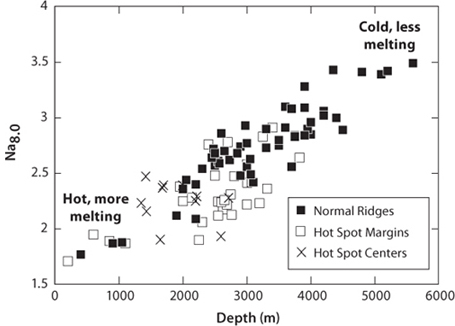
Fig. 11-18: Variations in the composition of the ocean crust vary with the regional depth of the ridge axis. Each point represents an average crustal composition over distances of ~100 km. Low Na contents and shallow depths are both consequences of greater extents of melting of the mantle owing to higher mantle temperatures.
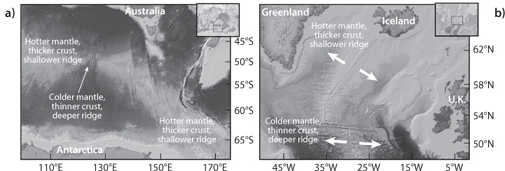
Fig. 11-19: (a) Map of the Southeast Indian Ridge between Australia and Antarctica, a region called the Australian/Antarctic Discordance (AAD). Light colors along the ridge axis midway between Australia and Antarctica are shallow and indicate a ridge created by hotter mantle, and dark colors are deeper, where the crust is thinner, produced by mantle at a lower temperature. The AAD is a cold region that separates distinct chemical provinces associated with the mantle beneath the Indian and Pacific basins (b) Map of the Iceland region. Iceland is a mantle plume where temperatures are inferred to be the highest of the entire ocean ridge system, leading to shallow depths and thick crust. Temperature apparently decreases both north and south of Iceland, leading to greater depths and thinner crust. See color plate 20. (Background maps from GeoMapApp; www.geomapapp.org)
While relating the depth of the ocean ridge to the temperature of the mantle requires a long chain of reasoning, the inferences are quite straightforward—the depth of the ocean ridge reflects the temperature structure of the underlying mantle. A global map of the ocean ridge system then gives a snapshot into the temperature of the mantle underneath! The ridges that are shallowest are those associated with hot spots that occur near ocean ridges, providing additional evidence that hot spots are indeed hot. The most obvious example is Iceland, where temperatures are high enough that the crust is five times thicker than normal ocean crust, leading to the creation of an island along a spreading ridge.
Temperature variations inferred from ridge depths then provide us with additional information about the pattern of mantle convection. The shallow ridges associated with hot spots such as Iceland are consistent with hot spots derived from mantle plumes from a thermal boundary layer in the deep mantle (Fig. 11-19b). The deepest ocean ridges generally occur at the margins of the great ocean basins—e.g., the separation between the Indian and Pacific oceans south of Australia and the equatorial Atlantic. The Australian-Antarctic Discordance (Fig. 11-19a) is a boundary between Indian and Pacific mantle that is consistent with cooler mantle temperatures in that region. In general, ridges show an undulation over distances of 5,000–10,000 km of highs and lows that must reflect the overall mantle convective circulation, with upflow zones associated with hot spots and return flow associated with the edges of ocean basins far from hot spots. The large variation in the depths of ocean ridges confirms that ridges migrate over the Earth’s surface and simply respond to the mantle temperature above which the spreading occurs.
The movements and surface topography of the oceans are closely linked to processes occurring in Earth’s interior. Isostasy and plate movement show that the mantle must flow. The high Rayleigh number of the mantle shows that active convection is inevitable. Mantle convection is the essential link between the thermal energy of the interior and the external functioning of the planet. Exterior movements of the plates cause circulation of the mantle and influence its flow. Other forms of mantle convection, represented by plumes, also transport material and energy from the core and mantle to the surface and influence the depths of ocean ridges and the detailed position of plate boundaries. The plumes are most abundant far from subduction zones, suggesting feedback between the different modes of convection of the mantle. Mantle convection links a hot thermal boundary at the core/mantle boundary to the cold thermal boundary between the mantle and the surface. The core-mantle and mantle-plate connections produced by interior modification in Earth’s early history exchange and transfer energy that keeps the planet in motion. We shall understand from subsequent chapters how this continual circulation of the solid Earth and core is an essential aspect of Earth’s habitability.
Goeffrey F. Davies. 2001. Mantle Convection for Geologists. New York: Cambridge University Press.
Gerald Schubert, Donald L. Turcotte, and Peter Olson. 2001. Mantle Convection in the Earth and Planets, 2 vols. Cambridge: Cambridge University Press.