Ninety-nine percent1 of the planet’s freshwater ice is locked up in the Antarctic and Greenland ice caps. Now, a growing number of studies are raising the possibility that as those ice sheets melt, sea levels could rise by six feet this century, and far higher in the next, flooding many of the world’s populated areas…
Last month [April 2016] in Greenland, more than a tenth of the ice sheet’s surface was melting in the unseasonably warm spring sun, smashing 2010’s record for a thaw so early in the year. In the Antarctic, warm water licking at the base of the continent’s western ice sheet is, in effect, dissolving the cork that holds back the flow of the glaciers into the sea; ice is now seeping like wine from a toppled bottle.
—Nicola Jones (2016)
Our journey into the mists of time opened a window into possible Earth futures. Even so, anticipated conditions may well lie beyond past bounds. The Eemian gave us a foretaste of far higher sea levels, but one would need to revisit the Pliocene to experience the full impact of today’s carbon dioxide (CO2) level (now over 400 ppm), or perhaps even ultimately the hothouse Eocene. Where are the ice sheets headed? How long will it take at today’s and tomorrow’s ramped-up warming rates before the remaining large ice masses ultimately collapse and unleash renewed meltwater pulses? Will the coming meltdown unfold abruptly, in stark contrast to the last deglaciation, which spanned 8,000 to 10,000 years? MWP-1A followed quickly on the heels of the Bølling-Allerød warming, 14,700–14,000 years ago, as did MWP-1B soon after the end of the cold Younger Dryas, 11,500 years ago (see fig. 7.5, table 7.1). Yet many centuries of prior warming and gradual ice deterioration had primed the ice sheets for these sudden outbursts. Another important distinction is that the Eemian and Holocene interglacials were set off by increasing northern solar insolation, as predicted by the Milankovitch theory. However, increasing anthropogenic greenhouse gas emissions are largely responsible for the current warming trend. Therefore, the hemispheric and seasonal distributions of higher temperatures may differ from those of the past.
More importantly, our excursion into the distant past has demonstrated that large ice sheets may not be as invariant as once assumed. Sea level rose or fell as glaciers and ice sheets repeatedly retrenched and expanded in response to changes in climate and atmospheric CO2, both then and now (e.g., fig. 7.4; also chaps. 4–6). These close linkages will still persist in the future. As Gabrielle Walker starkly reminds us, “Carbon dioxide has risen and fallen with the seasons, with the ice ages, with the different climate patterns. But in all that time it has never been within striking distance of the amount we have today. Throughout the entire EPICA record [800,000 years], the highest value of CO2 was about 290 parts for every million parts of air. Now we are at nearly 400 and rising…. The deepest voids of Dome C hold a warning that we would do very well to heed.”2
Not only does today’s CO2 level far exceed those of the past million years; we must turn the clock back 3 million years to match today’s high level—to a time when sea level may have been as much as 20 meters (66 feet) higher! The Earth may take a long time to reestablish a new atmospheric equilibrium. Once in the atmosphere, the extra CO2 is notoriously difficult to eliminate. It stays in the atmosphere for millennia, unlike other greenhouse gases such as methane and nitrous oxide, which have much shorter atmospheric lifetimes and decline within decades.3 Meanwhile, the heat builds up. Will rising temperatures push the ice sheets into an irreversible downward death spiral?
Already, the Arctic is warming twice as fast as the rest of the planet. Arctic summer sea ice has shown a steady decline over the past 30 years. Any Antarctic sea ice gains have been surpassed by Arctic losses. In February 2017, the temperature at the North Pole briefly spiked 30°C above normal to 0°C (32°F). Both poles also experienced record sea ice lows.4 Greenland, and recently Antarctica as well, have also been losing ice, as documented in chapters 5 and 6. The explosive disintegration of Larsen B in 2002 illustrates what happens when the integrity of an ice shelf is compromised and it unleashes previously constrained ice streams. Is Larsen B therefore a forerunner of things to come? Could Larsen C be on a similar trajectory, after a giant iceberg split off a rift in the ice shelf on July 12, 2017?5 In West Antarctica, large icebergs calved off the Pine Island Glacier in 2013, 2015, and 2017. The calving events were preceded by rifts encroaching ever landward (chap. 6). Seongsu Jeong of Ohio State University finds these recent rifts “anomalous,” because the fissures originated at the center of the ice shelf and propagated toward the edges. They also opened up from the bottom of the ice, at the grounding line. The ice shelf may have been weakened by thinning caused by incursions of warm marine water. As Nicola Jones starkly reminds us, the West Antarctic ice shelves—the “cork” that keeps the ice in check—are slowly dissolving, spilling more ice into the ocean “like wine from a toppled bottle.” Will rising tides be far behind?
THE COMING SUPERINTERGLACIAL
As a matter of fact, summertime sunlight at 65°N is getting a little thin lately. It’s approaching the trigger value now…if the climate system misses the glacial express this time, the next opportunity will be 50 thousand years from now.
—David Archer, paleoclimatologist (2009)
Most interglacials last around 10,000 years. A few, like the one 400,000 years ago, last around 30,000 years. The orbital alignments for the next glaciation (see box 7.1) could come in as little as a few thousand years or in 50,000 years. But human activities may stall the next glaciation for another half a million years. David Archer, a paleoclimatologist at the Department of Geophysical Sciences of the University of Chicago, and his colleague Andrey Ganopolski reached this startling conclusion after running a climate model that included atmospheres, oceans, and ice sheets that grow, flow, and melt. They simulated changes in the Earth’s orbital configurations and atmospheric CO2 levels. At a preindustrial CO2 concentration of 280 ppm, they easily initiated an ice age under favorable orbital alignments (see “Recipe for Starting an Ice Age,” box 7.1). But the higher the CO2, the harder and harder it is to regrow ice. On a business-as-usual pathway, we avoid another glaciation for at least 50,000 years, possibly 130,000 years. Worse, if we burn all our coal reserves, the next ice buildup is postponed for much, much longer. “The Earth,” they say, “could remain in an interglacial state until the end of not only our current period of circular orbit, but the next circular time, 400 millennia from now.”6
This is no great excuse for staving off a coming ice age. As the next chapter will show, the potential dangers of warming are already under way. A scary implication of the Archer-Ganopolski study is that “by releasing CO2, humankind has the capacity to overpower the climate impact of Earth’s orbit, taking the reins of the climate system that has operated on Earth for millions of years.”
Current observations suggest that both surface melting and ice discharge will dominate future Greenland Ice Sheet attrition, whereas Antarctica will sustain most of its losses via ice outflow into the ocean. Surface melting will likely be negligible, because Antarctica will remain extremely cold in spite of a warmer climate. Increases in interior snowfall will largely cancel losses from surface melting. However, the ice sheet’s margins will sustain greater losses that may exceed potential gains inland.
To foresee more clearly where we are headed, climate scientists turn to global climate models (GCMs) that mathematically replicate the major natural and atmospheric processes that govern our climate, based on fundamental principles of physics. These models provide a scientific basis for forecasting anticipated atmospheric greenhouse gas levels. Most combined atmospheric and oceanographic global models (AOGCMs) focus on changes in air and ocean temperatures, circulation patterns, and ocean thermal expansion. Ice losses are usually determined separately. These losses include changes in both surface mass balance (snowfall minus ice melt and runoff) and ice dynamics (calving or outflow of solid ice past the grounding line). Surface mass balance is generally calculated from downscaled global or, preferably, regional-scale climate model projections of temperatures and precipitation (see chaps. 4 and 5).
Dynamic ice flow models additionally estimate future changes in iceberg calving rates and discharge of ice past the grounding line. The latest dynamic ice models also capture significant elements of ice sheet and ice shelf processes, including retreat of grounding lines, changes in ice shelf buttressing, hydrofracturing, ice cliff failure, calving, and basal melting. Even though these models may be much more sophisticated than earlier versions, they may still miss several important aspects of ice loss. For example, they may oversimplify important processes, such as mixing of ocean water with freshwater runoff in the fjord, or ice sliding over obstacles on its bed. Still, they portend troubling news from Antarctica. In contrast to earlier simulations that lacked consideration of some of these ice processes, the newer findings reveal that by 2100, Antarctic ice losses will account for a larger percentage of global sea level rise than previously assumed, and this share will expand in the future.
In a recent study, Robert DeConto of the University of Massachusetts and David Pollard of Pennsylvania State University applied an advanced ice sheet–ice shelf model to Antarctica that mimics the marine ice sheet instability (MISI) and ice cliff fracturing instabilities.7 They found that at high greenhouse gas emission rates, ice shelves could begin to break apart by midcentury. Antarctica may contribute 1 meter (3.2 feet) of sea level rise by century’s end, and over 15 meters (49 feet) by 2500. At such rates, the West Antarctic Ice Sheet (WAIS) would disappear within a few hundred years.
Another, more cautiously worded study finds such high estimates “implausible” given our current understanding of the physical processes involved.8 Instead, Antarctica would contribute at most around a third of a meter (1 foot) by 2100 and 72 centimeters (2.4 feet) by 2200. But this analysis does not include the consequences of surface melt ponding and ice cliff failure, which could augment these figures.
Semiempirical models adopt a quite different approach to predictions of ice sheet (and ocean) evolution.9 These models assume that past correlations between observed mean global sea level rise and temperature will continue to hold in the future. Since these models do not simulate underlying individual processes, they provide no further information on glacier or ice sheet contributions. This also limits their ability to account for those processes that, while relatively insignificant today (for example, growing ice sheet instabilities), are expected to play an increasingly important role. The overall balance of processes that causes ice losses may thus change over time. This failure to account for evolving ice sheet behavior is a serious shortcoming of semiempirical methods.
Table 8.1 summarizes the contributions from glaciers and ice sheets to sea level rise by the year 2100. Although most studies find that combined ice mass losses will yield less than a meter of global sea level rise by 2100, adding thermal expansion of the ocean and other processes affecting sea level brings the overall total to nearly a meter or more. The DeConto-Pollard model, which depicts ice sheet/ice shelf behavior more realistically, presents a high-end scenario. But no end-of-century projection should induce complacency. As we shall soon see, the story does not end in 2100.
TABLE 8.1 Cryosphere Contributions to Sea Level Rise (m) by the End of the Twenty-First Century
| |
SURFACE MASS BALANCE |
DYNAMICS |
TOTAL |
REFERENCE |
| GLACIERS |
| |
— |
— |
0.10–0.16a |
Intergovernmental Panel on Climate Change (2013a) |
| |
— |
— |
0.12–0.18b |
Kopp et al. (2014) |
| |
— |
— |
0.08–0.11c |
Mengel et al. (2016) |
| GREENLAND ICE SHEET |
| |
0.03–0.07 |
0.04–0.05 |
0.07–0.12 |
Intergovernmental Panel on Climate Change (2013a) |
| |
0.04–0.09 |
— |
— |
Fettweis et al. (2013) |
| |
— |
— |
0.06–0.14 |
Kopp et al. (2014) |
| |
— |
— |
0.04–0.10d |
Fürst et al. (2015) |
| |
0.07–0.27 |
0.05–0.07 |
0.12–0.34 |
Mengel et al. (2016) |
| ANTARCTIC ICE SHEET |
| |
−0.02–−0.04 |
0.07–0.07 |
0.03–0.05 |
Intergovernmental Panel on Climate Change (2013a) |
| |
|
|
0.04–0.06 |
Kopp et al. (2014) |
| |
−0.02–−0.03 |
0.06–0.13 |
0.04–0.10 |
Mengel et al. (2016) |
| |
— |
— |
0.01 (0.10); 0.10 (0.39)e |
Golledge et al. (2015) |
| |
|
|
0.11–1.05f |
DeConto and Pollard (2016) |
| All ice |
— |
— |
0.37–0.56g |
Meehl et al. (2012) |
a Median range across four RCP scenarios (RCP2.6, RCP4.5, RCP6.0, and RCP8.5) between 1986–2005 and 2081–2100.
b Median range across three RCP scenarios (RCP2.6, RCP4.5, and RCP8.5) between 2000 and 2100.
c Median range across three RCP scenarios (RCP2.6, RCP4.5, and RCP8.5) between 1986–2005 and 2100.
d Mean of combined climate models across four RCP scenarios (RCP2.6, RCP4.5, RCP6.0, and RCP8.5) between 2000 and 2100.
e Low (high) estimates for four RCP scenarios (RCP2.6, RCP4.5, RCP6.0, and RCP8.5) between 2000 and 2100.
f Mean range across four RCP scenarios (RCP2.6, RCP4.5, RCP6.0, and RCP8.5) between 2000 and 2100.
g Median range across three RCP scenarios (RCP2.6, RCP4.5, and RCP8.5) between 1986–2005 and 2100.
Runaway Ice Sheets?
The future evolution of the Antarctic Ice Sheet represents the largest uncertainty in sea-level projections of this and upcoming centuries…In our simulations…the region disequilibrates after 60 years of currently observed melt rates. Thereafter, the marine ice-sheet instability fully unfolds and is not halted by topographic features…Our simulations suggest that if a destabilization of [the] Amundsen Sea sector has indeed been initiated, Antarctica will irrevocably contribute at least 3 m to global sea-level rise during the coming centuries to millennia.
—Johannes Feldmann and Anders Levermann (2015)
Repeated past West Antarctic Ice Sheet fluctuations, as well as recent trends and model projections (see the previous section), raise deep concerns over an impending WAIS instability. Thwaites Glacier, along with neighboring Pine Island Glacier and other nearby glaciers, has recently accelerated and thinned, suggesting to some observers a potential collapse in progress.10 Thwaites has greater access to deep marine-based interior basins than do its neighbors. One study suggests that as little as 2°C (3.6°F) of air and 0.5°C (0.9°F) of ocean warming could destroy nearly all ice shelves and trigger a MISI11 (see also fig. 6.6). Once initiated, the process would become self-sustaining. Ice losses would eventually drain much of the marine-based portions of WAIS, raising sea level by up to 3 meters (9.8 feet) within 300 years, under high greenhouse gas emissions (e.g., RCP8.5, appendix A). Worse yet, Feldmann and Levermann, in another study, suggest that the whole Amundsen Sea sector could destabilize in only 60 years at current ice shelf melting rates. The instability would spill into deep inland valleys and cross into adjacent catchments that feed into presently stable ice shelves (chap. 6). Most of the remaining WAIS would disappear centuries to millennia hence.12
The Greenland Ice Sheet may face its own MISI, because of deeply buried subglacial valleys with potential outlets to the sea (recall Greenland’s hidden “Grand Canyon,” chap. 5). The Northeast Greenland Ice Stream (NEGIS) drainage system, parts of which lie on a reversed slope, cuts deep into the heart of Greenland. It remained stable until the early 2000s, when the Zachariae Ice Stream, a branch of NEGIS, began to retreat.13 Several other glaciers, including fast-retreating Jakobshavn Isbrae, Helheim, and Kangerlussuaq, sit on reverse slopes as well.
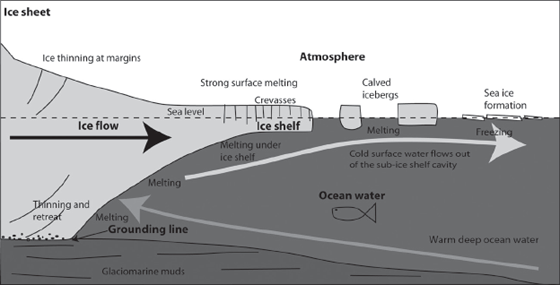
Greenland’s tidewater glaciers react quickly to slight ocean and air warming (chap. 5). Increasing surface meltwater works its way down to the glacier bed, where more freshwater not only courses to the sea, but erodes the ice sheet from below. Furthermore, milder water entering a fjord eats away at the glacier terminus, driving the grounding line farther inland (fig. 8.1). This also undercuts ice along the glacier’s edges, thereby deepening the fjord cavity into which more seawater can pour. Calving rates increase as the ice edge is undermined. Could this combination of processes also put the Greenland Ice Sheet on the verge of an unstoppable rush to the sea?
FIGURE 8.1
Before we wring our hands at the inevitability of runaway ice sheets, we should recall two important negative feedbacks that may slow down or even halt the marine-based instability, at least for a while. These feedbacks involve the way the Earth responds to a lessened ice load and weaker gravity.14 The land springs back under a thinner ice sheet (glacial isostatic rebound), and local sea level drops. At the same time, the smaller ice sheet exerts less of a gravitational pull on the ocean, so that water flows away into the distance, which further reduces local sea level rise. A lower sea level hinders entry of warmer marine water into subglacial fjord cavities or the base of ice shelves, thereby slowing down ice shelf and ice tongue deterioration. Moreover, an initially reverse slope could steepen seaward due to glacial rebound. Ice shelf disintegration within a narrow embayment can also hinder retreat, because the resulting loose ice mush could provide some temporary buttressing support. Even so, these negative feedbacks may not be enough to prevent a marine ice sheet instability from developing in the face of unabated, mounting CO2 levels.
Tipping Points and Climate Commitments
The global average temperature of the Earth might be 3°C warmer in the year 2100 than it was in 1950. That doesn’t sound like much…On the other hand, the climate changes that civilized humanity has witnessed have all been 1°C or less…but this is nothing compared with the forecast in 2100…Given the long atmospheric lifetime of fossil fuel CO2…it is clear that there is lots of time available to melt ice. The sea level rise one thousand years from now will be much higher than what the coming century will bring. The forecast for 2100 is only the tip of the iceberg. So to speak.
—David Archer, paleoclimatologist
A few degrees of warming may be all that is needed to destabilize the Greenland Ice Sheet and ultimately return Greenland to a nearly ice-free state. The tipping point may be as low as 1.6°C (2.7°F).15 Many climate change scenarios foresee much higher temperatures by the end of the century. Deglaciation will not occur overnight, however. It could take as long as 50,000 years for a 2°C regional summer warming. If temperatures soar by 8°C, 20 percent of the ice sheet will melt after 500 years and all of it will melt after two millennia. At the opposite end of the Earth, a half a degree Celsius warmer ocean and several degrees warmer air temperatures would eliminate nearly all ice shelves.16 While ocean warming and ice shelf breakup cause the greatest initial losses, increasing air temperatures over centuries thin the margins and “soften” the ice sheet, which then accelerates. Once past the initial threshold, Antarctica commits to a substantial sea level rise, which stems largely from the demise of the buttressing ice shelves. A model that features shelf-weakening processes such as hydrofracturing and ice cliff failure finds that Antarctica could potentially drive up sea level by as much as 1 meter (3.3 feet) by the end of the century and over 15 meters (49 feet) in 500 years, at high emission rates.17 The latter scenario implies significant inputs from East Antarctica. This scenario of a ramped-up ice sheet instability may be somewhat exaggerated. In many other projections, the West Antarctic collapse stretches out longer, over many millennia. A multiplicity of interacting atmospheric, oceanographic, and geologic variables can influence the future course of ice sheets, which generate large uncertainties in future forecasts. Nevertheless, both past geologic evidence and climate projections demonstrate that given enough warming for long enough, drastic scenarios of ice sheet meltdowns are not beyond the realm of the possible. Whether the ocean rises to such extreme heights within 100, 500, or 1,000 years matters less than the fact that once the big-time meltdown begins, the die will have been cast. The process is irreversible. There is no turning back.
The scientific basis for the close link between changing atmospheric CO2 levels and temperature, alluded to earlier in this chapter and in previous chapters, has been known for over a century. In 1896, the Nobel Prize–winning chemist Svante A. Arrhenius (1859–1927) helped to establish the foundation for what later became known as the “greenhouse effect”—the heat-trapping ability of atmospheric CO2 and other greenhouse gases, such as methane (CH4) and nitrous oxide (N2O). Motivated by a desire to explain the origin of the ice ages and building upon earlier work by Joseph Fourier, Claude Pouillet, and John Tyndall, Arrhenius applied his knowledge of physical chemistry to calculate the effect of increasing CO2 on Earth’s surface temperatures. His calculations led to a “rule” simply stating that increasing carbonic acid (i.e., CO2 and H2O) geometrically would increase temperature nearly arithmetically. Thus, doubling CO2 would result in a 4–5°C (7.2–9°F) rise in temperature; a fourfold increase in CO2 would raise it 8°C (14.4°F). This supposedly works both ways: i.e., halving CO2 would reduce temperatures by 4°C (7.2°F), eventually leading to a new ice age. Arrhenius also realized that the then-modest increases in CO2 from industrial activities would eventually lead to a warmer climate. But he actually saw this as beneficial, especially in northern climates (such as in Sweden, where he lived) where more crops could be grown to feed “rapidly propagating mankind.”18 However, as we shall soon see, it’s not so easy to get rid of the excess CO2 our activities are generating.
Although progress in atmospheric science, recent observations, and geologic evidence of past climates have vastly expanded our understanding of the greenhouse effect, Arrhenius’s simple calculations, given the limited knowledge of his day, were amazingly close to present estimates. For example, climatologists refer to the temperature rise for a doubling of atmospheric CO2 as the equilibrium climate sensitivity. This value is currently believed to lie in a range between 1.5° and 4.5°C (2.7° and 8.1°F), close to Arrhenius’s estimate of ~4° to 5°C.19
As Arrhenius suspected, our industrial activities, including fossil fuel combustion, cement manufacture, and deforestation, are adding CO2 to the atmosphere above and beyond what is produced by volcanoes or naturally present atmospheric water vapor (another greenhouse gas). As illustrated in chapter 1, CO2 has been trending steadily upward since the 1950s (fig. 1.7). The CO2 level of ~407 parts per million as of December 2017 has far surpassed the preindustrial value of ~280 parts per million.20 Both temperature and sea level have already responded to this sharp increase. Earth’s global temperature in 2016 was the highest ever since the late nineteenth century.21 Overall, temperatures have gone up 1.1°C (2°F) since the late nineteenth century. Twentieth-century global sea level rose at a rate of 1.2 to 1.9 millimeters (0.05–0.07 inch) per year between 1900 and the 1990s. Since 1993, satellite altimeters have registered an average yearly sea level rise of ~3 millimeters (0.12 inch) per year (chap. 1).
A growing share of the total sea level rise is coming from glaciers and ice sheets (see chaps. 4–6 and tables 4.1, 5.1, and 6.1). Given the expected warming that lies ahead, glaciers and ice sheets will continue to shed even more ice, as suggested in table 8.1 (see also appendix A and “The Coming Superinterglacial,” earlier in this chapter).
Most scientists and a growing number of the general public (aside from a few influential climate change skeptics) now concede that the Earth has been warming and that recent changes, especially since the 1960s, bear a considerable human imprint. Yet many point to the large climate oscillations of the geologic past, described in chapter 7, and maintain that the recent warming is merely the latest example of a natural cycle. So why worry? Furthermore, most changes to date are barely perceptible against the wild day-to-day swings in temperature, rainfall, snowstorms, and other extreme weather events.22 Nevertheless, those living in the Arctic, the mountains, and the major deltas and on coastal barrier islands already notice the changes, as the next chapter will show. Still, most of us find it difficult to think beyond a few years, or at most a human lifetime or that of one’s children and grandchildren. Businesspeople plan for this year’s or next year’s profits, politicians look toward the next election cycle, and urban planners and developers look to the lifespan of a building, roadway, or bridge. Thus, a sharp disconnect separates ordinary human experience from the much longer time spans over which climate change evolves. Therefore, steps to reduce our CO2 emissions receive a much lower priority than more immediate concerns. However, decisions made now or within the next few decades will ultimately affect not just the fate of the ice sheets, but the fate of our planet as we know it.
Even if we were to stop further CO2 emissions by midcentury, the emissions we have already generated and will likely add within the next few decades will remain in the atmosphere, where they will linger for millennia before slowly diminishing. Methane lasts roughly 10 years in the atmosphere and nitrous oxide survives a century, while CO2 interacts with the atmosphere, ocean, and biosphere in complex ways that operate on different timescales. The ocean consumes about a third of the CO2 released by fossil fuel burning, while the rest winds up in the atmosphere and biosphere. The longevity of atmospheric CO2 commits us to higher temperatures and sea level long after greenhouse gas emissions have stabilized or are reduced. In a sharp warning, a multidisciplinary, international team of Earth scientists headed by Peter U. Clark proclaim that “20–50 percent of the airborne fraction of anthropogenic CO2 emissions released within the next 100 years remains in the atmosphere at the year 3000, that 60 to 70 percent of the maximum surface temperature anomaly and nearly 100 percent of the sea-level rise from any given emission scenario remains after 10,000 years, and that the ultimate return to pre-industrial concentrations will not occur for hundreds of thousands of years.”23 If that weren’t bad enough, Clark et al. continue: “If CO2 emissions continue unchecked, the CO2 released during this century will commit Earth and its residents to an entirely new climate regime”—one in which, they further point out, Greenland would deglaciate completely within 2,500 to 6,000 years and Antarctica would lose the equivalent of 24 to 45 meters (79–148 feet) of sea level rise within 10,000 years. This long-term change occurs because the extra heat already absorbed near the ocean surface requires many centuries to penetrate to great depths. As it does, an ever-increasing volume of ocean water continues to expand and raise sea level. The prolonged warming over timescales comparable to that since the last deglaciation also enables widespread ice sheet melting. Clark et al. furthermore point out that the projected warming “will also reshape the geography and ecology of the world.” Clark and his team emphasize that the only way to prevent such a hothouse meltdown is to aim for net-zero carbon emissions—and fairly soon. Our window of opportunity is rapidly closing—possibly within decades.
How do we begin to curb our carbon appetite? One major step forward was the Paris Agreement within the United Nations Framework Convention on Climate Change (UNFCCC), which was adopted by consensus in December of 2015. The Paris Agreement, originally signed by 132 nations, including the United States, took effect in November of 2016.24 Subsequently, President Donald Trump withdrew the United States from the Paris Climate Accord on June 1, 2017. Meanwhile, Syria, the other remaining holdout nation, signed the accord on November 7, 2017, following Nicaragua’s decision to join on October 24, 2017.
The accord ambitiously aims to keep global temperatures from rising by more than 2°C (3.6°F) by 2100, and ideally by only 1.5°C (2.7°F), with the ultimate goal of achieving zero carbon emissions by later this century in order to avert “dangerous anthropogenic interference with the climate system.”25 Participating countries agree to set Nationally Determined Contributions (NDCs) to limit their carbon emissions. While the agreement establishes an important historic precedent, emission targets are self-defined and voluntary, the accord is legally nonbinding, and no provisions exist for enforcement. Furthermore, as recent events have shown, the political climate can change almost as suddenly as the weather, and despite nations’ best intentions, actual outcomes may fall short of expectations. Still, hopefully, momentum is slowly building toward a change in course, even in the United States.
Prevention, or at least a dampening of the worst impacts of a potentially large-scale, irreversible deglaciation, requires attacking its ultimate source: the increasing anthropogenic production of atmospheric greenhouse gases. A full treatment of this thorny subject lies beyond the scope of this book and is covered more extensively elsewhere, but here we briefly sketch a few basic steps that can be taken.26 A broad range of options exist for reducing CO2 emissions using currently available technology. These include measures such as promoting energy efficiency and conservation in transportation, housing, and energy. In spite of recent declarations of the intention to revive the coal industry, U.S. energy consumption has been moving toward greater utilization of natural gas. Natural gas, or CH4, does not present a perfect solution, because it too is a fossil fuel, which upon combustion yields CO2. However, it is far more energy efficient than either coal or oil and also burns more cleanly. Renewable energy derives from natural sources such as the sun, wind, tides, biomass (plant matter and organic wastes), and geothermal energy. Although still a fraction of total energy consumption, renewables’ share is growing and has potential for further expansion. Another option is nuclear energy, a route taken by France, Japan, and, to some extent, the United States. While nuclear power emits no CO2, concerns remain over reactor operating safety after such catastrophic incidents as, for example, the Fukushima, Chernobyl, and Three Mile Island accidents. Another serious consideration is long-term (i.e., 10,000-year) storage of nuclear wastes in a seismic-free, leakproof repository.27
Geoengineering, or large-scale anthropogenic interventions in the environment to counteract effects of greenhouse gas emissions, represents an as-yet-untested and potentially risky option. One idea involves injecting tons of sulfur dioxide into the upper atmosphere from high-flying jets to cool the planet. Another plan envisions a string of shiny orbital screens or mirrors to reflect sunlight back into space. However, these “solutions” merely mask the fundamental problem. At best, they work as long as we maintain our atmospheric injections of sulfur or reflecting screens. These fixes may affect cloud formation or plant growth in as-yet-unforeseen ways. They may also fail to prevent other consequences of global warming such as ocean acidification and changes in atmospheric and ocean circulation.
More environmentally friendly approaches involve working with nature. Reforestation soaks up excess atmospheric CO2 while providing wildlife habitat. Ways of creating biological sinks of CO2 include expansion of parkland and urban green spaces, and planting rooftop gardens (“green roofs”). Dune rebuilding and coastal ecosystem restoration (e.g., salt marshes, oyster reefs) help mitigate impacts of wave action and storm surges in the face of rising sea levels.
The coming global energy transformation cuts across all economic sectors, but transitioning away from fossil fuels still faces significant technological, economic, and political hurdles. Will our currently available carbon-free technologies suffice to meet growing energy demands? What are the economic costs of the transition, and how can these be met while minimizing dislocations? How best to convince a skeptical public of the urgency of the situation and need for decarbonization? A massive research and development program akin to the Manhattan Project or moon landing may be required to successfully meet this challenge. Meanwhile, existing alternative energy technologies need to be implemented on a more widespread scale than hitherto. Economic incentives to replace fossil fuels with other energy systems should be encouraged. International-scale cooperation, exemplified by treaties such as the Paris Agreement, may be important starting points, but such agreements need stronger enforcement provisions to become truly effective. This may prove challenging, given the disparate agendas and rivalries among, and even within, nations. Meanwhile, a growing number of urban centers, particularly those along the world’s coasts, that face the brunt of climatic impacts have been organizing to take steps to adapt to existing and anticipated changes.28
Why Care?
What does the fading ice empire mean for the people of the Earth? Why should we care? Many people would welcome a warmer climate, and indeed, many “snowbirds” from northern lands head south each winter to enjoy the sun, warmth, and summer sports. The next chapter investigates in depth why losing ice really matters. The vanishing cryosphere ultimately affects us all, not only those inhabiting the most directly impacted regions—the Arctic and high mountains—but the rest of the world far afield, as Jane Lubchenco, a former NOAA official, reminds us. While the ramifications of a thawing cryosphere extend in multiple directions, we will focus on several that impact large regions or populations. We begin by exploring the epicenter of greatest change: how the big melt affects the Arctic—its people, environment, and economy; how the diminishing summer sea ice opens up new trade routes, travel opportunities, and access to mineral resources; and also how the changing climate alters the landscape as impermanent permafrost thaws, coastlines crumble, and ecosystems slowly adjust to the new norm. We next head for the mountains to determine how reduced winter snowfall will affect water resources for downstream urban and rural populations, and how rapidly shrinking glaciers may make winter sports a fading memory and mountainside living more hazardous.
As alluded to in this and preceding chapters, sea level rise will become one of the most serious consequences of melting glaciers and ice sheets. Glaciers have but little to contribute to the oceans—a half meter (1.6 feet) of rise at most. Greenland has more to give. But when the giant gorilla—Antarctica—reawakens, it may ultimately reconfigure the shorelines of the world and transform the geography of the planet.
The rising waters will imperil coastal populations, megacities and smaller settlements, and deltas and coastal wetlands worldwide. Coastal residents will face more frequent storm flooding. Low-lying lands will be submerged and eventually disappear underwater. Salty and brackish water will creep farther and farther upstream and contaminate rivers and coastal aquifers. Many cities may need to follow the example of Venice and Amsterdam and convert streets to canals, or abandon entire neighborhoods. The ultimate option—a retreat from the coast—may soon become a necessity for some Alaskan villagers, as the next chapter will show. As David Archer reminds us, our actions today could postpone the next interglacial for nearly half a million years—a period that otherwise would likely experience at least another four glacial-interglacial cycles. Welcome to the superinterglacial and hothouse Earth!