Dissection of Complex Trait Evolution
Bret A. Payseur
OUTLINE
1. Genetic variation in complex traits
2. Using laboratory crosses to map the mutations responsible for phenotypic evolution
3. Using association testing to map the mutations responsible for phenotypic evolution
4. Current challenges and prospects for future research
This chapter describes approaches that use naturally occurring variation to dissect the genetic basis of phenotypic evolution. Emphasis is given to complex traits—those phenotypes controlled by multiple genetic and environmental factors. The use of laboratory crosses to locate mutations that affect trait variation is briefly reviewed. Then the strategy of comparing phenotypes and genotypes in population samples of unrelated individuals is explained. The factors that affect success in association testing when conducted on the genome-wide scale are discussed, along with some lessons from studies in humans.
GLOSSARY
Alleles. Different versions of a gene or mutation carried by individuals in a population.
Complex Traits. Phenotypes to which multiple genetic and environmental factors contribute.
Genome-Wide Association Testing. A strategy that compares phenotypes with genotypes at markers throughout the genomes of unrelated individuals from a population to identify mutations associated with complex trait variation.
Haplotype. The particular combination of alleles at a series of polymorphisms that is present on one chromosome in an individual.
Heritability. The fraction of phenotypic variation in a population that is caused by genetic differences.
Linkage Disequilibrium. The statistical correlation between alleles at different loci in populations.
Missing Heritability. The common observation that the combined phenotypic effects of variants discovered through genome-wide association testing leave much of the genetic variation in a trait unexplained.
Quantitative Trait Locus (QTL). A genomic region that contributes to complex trait variation.
Recombination. Exchange of genetic material during meiosis that produces new combinations of mutations in a population.
Single Nucleotide Polymorphism (SNP). A single site in the genome that varies among individuals in a population.
1. GENETIC VARIATION IN COMPLEX TRAITS
Organisms vary in anatomy, physiology, and behavior. For most traits, this variation reflects the combination of multiple environmental and genetic factors. Although understanding the environmental component of trait variation is an important goal, evolutionary biologists have long been obsessed with the genetic piece. This fixation arises because evolution specifically targets inherited variation. Without genetic differences between organisms, evolution stops (see chapter I.4).
The field principally concerned with measuring and interpreting genetic variation in complex traits is quantitative genetics, which uses statistical models to partition different sources of trait variation in a population, including environmental and genetic variance. Genetic variance is a population quantity that jointly reflects the frequencies and phenotypic effects of all mutations that shape a trait. Phenotypic resemblances among relatives can be expressed as functions of genetic variances, enabling the estimation of these quantities from phenotypic data. Nevertheless, because genetic variances are statistical composites of effects across many loci, the contributions of specific genes and mutations cannot be obtained from them without inspecting DNA variation. The union of quantitative genetics with molecular approaches that allow rapid DNA genotyping throughout the genome has made it possible to map mutations responsible for complex trait variation.
2. USING LABORATORY CROSSES TO MAP THE MUTATIONS RESPONSIBLE FOR PHENOTYPIC EVOLUTION
A powerful approach to mapping mutations that shape complex trait evolution is to look for the cosegregation of phenotypes and DNA genotypes in the offspring from a laboratory cross. A little more than two decades after the necessary statistical machinery was developed, the evolution of a large variety of complex traits in a wide array of species has been mapped to specific genomic regions, commonly referred to as quantitative trait loci (QTL).
The simplest and most commonly used QTL design begins with two inbred lines that differ in the trait of interest. In evolutionary studies, these lines are often created by conducting repeated rounds of self-fertilization or brother-sister mating, beginning with individuals sampled from nature. Using two inbred lines reduces the maximum number of possible alleles at each locus to two, simplifying genetic analysis (though the procedure for mapping QTL using outbred parents is similar). Individuals from the two (parental) inbred lines are crossed to create F1 hybrids, which inherit half of their genome from each line and are genetically identical to one another along the autosomes. The F1s are mated to a parental strain (backcross) or to one another (intercross) to yield the next generation of offspring. Importantly, meiotic recombination in the F1s scrambles chromosomal pieces so that each offspring inherits a unique combination of alleles from the parental lines. This randomization of the genome is a key element that makes it possible to map QTL.
Phenotypes and genotypes are collected for each individual. Typically, the parental lines harbor different alleles at loci throughout the genome, allowing the source of each chromosomal segment in each hybrid to be determined. Standard backcross or intercross designs feature limited opportunity for useful recombination (only one generation), so that each chromosome is broken into several large pieces (figure 1). As a result, only a small subset of informative loci needs to be surveyed. These molecular markers—usually single nucleotide polymorphisms (SNPs) or short tandem repeat polymorphisms (microsatellites)—are typically chosen to be equally spaced on a genetic or physical map. Markers can be genotyped using a variety of methods, such as polymerase chain reaction, DNA microarrays, or DNA sequencing.
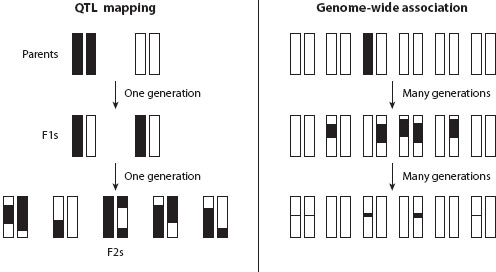
Figure 1. The difference in mapping resolution between QTL mapping and genome-wide association testing. The left panel shows chromosomes in individuals sampled from an intercross between two inbred parental strains. Informative recombination is restricted to one generation, leaving a causative mutation associated with large chromosomal blocks. The right panel shows chromosomes in individuals sampled from a natural population. At the top, a causative mutation (shaded) arises on a single chromosome and is initially associated with the particular haplotype on that chromosome. Over many generations, recombination reduces the sizes of chromosomal blocks (linkage disequilibrium) associated with the causative mutation, dramatically increasing mapping resolution. Only chromosomal blocks harboring the causative mutation are shown (the large diversity of haplotypes is not shown).
The test for linkage between genetic marker and QTL is straightforward. In genomic regions that do not harbor mutations affecting the measured phenotype, marker alleles and trait values will segregate independently. In genomic regions that contain QTL, individuals with different marker genotypes will differ in phenotype.
The most widely applied method—interval mapping—uses data from the two markers flanking a genomic position to estimate the conditional probabilities of genotypes at that location. Inference proceeds by comparing the likelihood of the data given a QTL at a position to the likelihood of the data given no QTL at that same position. This comparison is usually made by calculating an LOD score, the difference between the log10-transformed likelihoods (similar to the F-statistic from an ANOVA). In the most common procedure, an LOD score is calculated separately for each genomic position and the collection of scores for a chromosome is plotted to identify peaks, where evidence for the presence of a QTL is strongest. Permutation tests are used to determine whether a particular LOD score exceeds that expected by chance when tests are conducted across the genome. In addition to yielding QTL position, this analysis can estimate the QTL effect, including the percentage of phenotypic variance it explains and whether it is additive or dominant. More complex models allow simultaneous detection of multiple QTL and testing for interactions among QTL.
The logic of QTL mapping can be extended to generate a variety of additional genetic resource populations that can help to identify the causative mutations. Collections of inbred lines can be formed using F2s or later-generation intercross progeny as parents. The additional rounds of recombination that occur during the creation of these recombinant inbred lines (RILs) provide finer mapping resolution. RILs also allow the measurement of multiple, genetically identical individuals (in contrast to standard backcross and intercross designs, in which each individual is unique), increasing the accuracy of phenotypic characterization. Researchers can estimate the phenotypic effect of a single QTL region in isolation from the remainder of the genome by constructing introgression lines (sometimes called “nearly isogenic lines” or “congenic lines”). This is accomplished by backcrossing to one parental strain, choosing (heterozygous) offspring that harbor the QTL region from the other parental strain (by genotyping markers in the region), and continuing this procedure for several generations. The result is an inbred strain carrying the QTL region from one parent on the fixed genomic background of the other parent.
The large number of QTL mapping studies completed by evolutionary biologists collectively point to a few general patterns. First, multiple QTL contribute to complex trait evolution, as expected from quantitative genetic models. Second, QTL vary in both effect size and mode of action (e.g., dominance). Third, the expression of a QTL often depends on other factors, including sex, genomic background, and environment. Finally, larger crosses yield more QTL, suggesting that many QTL with modest effects go undetected with the sample sizes typically employed. These conclusions apply to both variation between populations and variation within populations.
A list of QTL for a particular trait helps researchers evaluate models of phenotypic evolution, including hypotheses about the genetic architecture of adaptation (see chapter V.12) and speciation (see chapter VI.8). Importantly, QTL mapping also provides an entrée into determination of the specific DNA variants responsible for phenotypic evolution. QTL mapping aided the identification of genes or mutations that underpin the evolution of bony armor in fish, coat color in mice, domestication traits in corn, and flower color in plants; unfortunately, most QTL studies have not achieved this level of success. The pedigree of an intercross or backcross features two generations of mating, and only one of those generations includes recombination that is useful for genetic mapping. This restriction limits the resolution of genotype-phenotype linkage to large chromosomal regions that contain many genes. Even QTL regions narrowed by mapping in recombinant inbred lines or introgression lines typically comprise multiple genes. The desire to drastically and rapidly improve mapping resolution by sampling many more recombination events is a primary motivation for a different approach: association testing in natural populations.
3. USING ASSOCIATION TESTING TO MAP THE MUTATIONS RESPONSIBLE FOR PHENOTYPIC EVOLUTION
Like organisms in a laboratory cross, individuals in a population are connected by a pedigree, but independent assortment and recombination during meiosis uncouple the pedigrees of different genomic regions. Each stretch of DNA has its own genealogical history, comprising a series of DNA replication events in ancestors that ultimately gave rise to the current generation. The chance that a genomic region has experienced recombination increases with time, so longer genealogies offer higher mapping resolution (figure 1). Although the structures of genealogies are difficult to resolve, two simple criteria can be used to sample longer genealogies and maximize the opportunity for recombination. First, unrelated individuals can be chosen. Whereas a stretch of DNA found in a pair of close relatives traces back to a common ancestor that lived recently, the same region found in two unrelated individuals may trace back to a common ancestor many generations ago. Second, a large number of individuals can be surveyed. Each new individual increases the length of the sampled genealogy. Partly for these reasons, association testing generally involves taking large samples of unrelated individuals from natural populations.
Like QTL mapping, association testing requires the collection of two forms of data. First, phenotypes are measured for each individual in the sample. Next, individuals are genotyped at DNA sites that vary in the population. Broadly speaking, there are two ways to choose mutations to survey. Investigators may focus on a subset of candidate genes with known or inferred functions that imply their involvement in the phenotype (see chapter V.11). A gene could be specifically targeted because previous studies revealed that mutations in this gene affect the phenotype of interest, either in the same species or in a different one. Less directly, a gene whose product is expressed at the right time or in the right tissue could be prioritized. Although this candidate gene approach has produced notable success stories in evolutionary biology, the ability to survey DNA variants from across the genome using high-throughput genotyping, along with growing realizations about the genetic complexity of most traits, has spurred increasing interest in the alternative strategy: genome-wide association testing. The reasoning behind this approach is that the mutations responsible for phenotypic variation may lie anywhere in the genome. Investigators genotype a large number of sites across the genome, often focusing on those that were previously identified as variable in the population of interest or in another population. The number of sites required to achieve adequate coverage depends on genome size and the correlations between mutations in the population (see “Linkage Disequilibrium,” below).
Association testing proceeds by comparing phenotypes and genotypes across the population sample, one DNA variant at a time. In all tests of association, genotypes are categorical. For an SNP with two alleles, there are three possible genotypes. If the trait has two categories, say, light and dark coloration, associations can be detected using a Fisher’s exact test of the 2 × 3 (phenotype × genotype) matrix. The linear regression of the frequency of light individuals on genotypic category (recoded as 0, 1, or 2) provides an alternative test of association. When phenotypes take on more than two (unordered) states, multinomial regression can be used.
For traits that vary continuously, analysis of variance (ANOVA) or linear regression can be used to examine genotype-phenotype associations. ANOVA is the more general test in that phenotypic differences between genotypes may assume any form (analogous to Fisher’s exact test for discrete traits).
These basic tests of association can be extended in multiple ways. Biological variables that could explain additional variation in the phenotype of interest, such as environmental factors or sex, can be included as cofactors to improve power. Multiple DNA variants can be jointly tested, which can help detect associations with the phenotype that derive from functional interactions among sites (i.e., epistasis). Finally, previous knowledge can be used to prioritize variants for testing. For example, nonsynonymous mutations, those that alter the amino acid sequence of a protein, might be expected to affect phenotype more frequently than synonymous mutations. The incorporation of outside information is perhaps accomplished most naturally through Bayesian association testing, in which variants are weighted by prior probabilities of association with the phenotype.
Several biological and statistical factors influence the ability of investigators to map genetic variants that contribute to complex trait evolution through association testing. Five of the most important variables are the phenotypic effects of causative mutations, the correlations between alleles at different loci (linkage disequilibrium), the frequencies of causative and marker mutations, the homogeneity of the population sample, and the very large number of tests.
Phenotypic Effects of Causative Mutations
The power to detect an association between genotype and phenotype is driven principally by the phenotypic effect of the causative mutation. For a continuous trait, this effect can be measured by comparing phenotypic means between genotypic classes. Half the difference in average trait values between the two homozygotes estimates the effect of substituting one allele, or the additive effect. The difference between the mean value for heterozygotes and the mean of the two homozygote values measures the deviation from additivity, or the dominance effect. The genetic variance contributed by a mutation is a sum of the squared additive and dominance effects, each weighted by different products of allele frequencies. Additive mutations with large effects are the easiest to detect. Effect sizes also may be reported as the percentage of phenotypic variance explained by marker genotype. For discrete traits with two categories, phenotypic effects are often measured using odds ratios. These ratios compare the odds that an individual exhibits one phenotype versus the other for two genotypic categories (e.g., whether or not the individual harbors a particular allele).
Genetic complexity that dilutes the phenotypic effects of mutations reduces the power of association studies. When trait values are determined by a large number of loci, the contribution of an individual mutation will be small. Phenotypic effects that are contingent on genotypes at other loci (epistasis) or the environment (genotype by environment interaction) are especially difficult to detect through association testing. Finding mutations with modest effects requires large sample sizes that may be prohibitive for a typical evolutionary study.
In most cases, a correlation between phenotype and genotype detected in a genome-wide association study is not caused directly by the tested polymorphism itself; instead, these associations arise because the tested polymorphism is located near a mutation that affects the trait of interest. The polymorphism is a marker for the causative mutation, providing its genomic address.
Randomly chosen polymorphisms can serve as markers because nearby mutations are often statistically correlated in populations. The force primarily responsible for the magnitude of these correlations is meiotic recombination (see chapter IV.4). When polymorphisms are separated by great physical distances along a chromosome, there is a high probability that recombination events have occurred between them during the history of the sample. These recombination events create new combinations of polymorphisms. Comparatively, the probability that recombination has occurred between closely spaced polymorphisms is low. Without recombination, sets of mutations that have been together in the population stay together. As a result, one can predict the allele carried by an individual at one polymorphism from knowledge of the allele at another polymorphism. This statistical association is called linkage disequilibrium. When recombination has shuffled combinations of polymorphisms, such that the frequency of a multisite combination is predicted from the product of its constituent allele frequencies, the population is said to be at linkage equilibrium.
Linkage disequilibrium is straightforward to measure. When the string of alleles on each chromosomal copy carried by an individual—the haplotype—is known or can be reconstructed, the population frequencies of haplotypes are compared to their predicted frequencies assuming free recombination. If the observed and predicted frequencies differ, there is linkage disequilibrium. Several summary statistics are available that use this basic principle.
The physical scale of linkage disequilibrium is a primary determinant of marker density in genome-wide association studies. When linkage disequilibrium decays rapidly, more markers must be genotyped to ensure that causative mutations are “tagged.” When linkage disequilibrium decays slowly, fewer markers are needed.
Linkage disequilibrium has been measured in a variety of species, but the most exhaustive analyses on the genomic scale come from the International Human Haplotype Map (HapMap) project. During the three phases of this effort, millions of SNPs were genotyped in large samples from populations representing primary axes of human genetic diversity. Four major patterns were observed. First, nearby SNPs often show strong linkage disequilibrium. Second, linkage disequilibrium decays on the scale of tens of kilobases (kb). Third, linkage disequilibrium varies among genomic regions, with lower values in regions with higher recombination rates. Fourth, linkage disequilibrium varies among populations, with lower values in populations of larger size. These patterns are all predicted by population genetic theory. Similar results have been observed on smaller scales in other species.
The observed patterns of linkage disequilibrium have implications for the design of genome-wide association studies. The fact that nearby mutations are often correlated suggests good prospects for association testing, as long as enough markers are genotyped. The required density of markers depends on the local recombination rate and the population size. Because these biological factors vary among species, different marker densities are needed to achieve the same level of coverage in different species. For example, population sizes in Drosophila melanogaster are much larger than in humans; as a result, linkage disequilibrium decays faster in fruit flies. Therefore, genome-wide association studies in fruit flies require a higher density of markers to obtain the same level of genomic coverage.
Frequencies of Causative and Marker Mutations
Each mutation that contributes to evolutionary differences in a complex trait takes on a particular frequency in the population. The frequency is determined by a combination of evolutionary factors. Natural selection increases the frequency of beneficial mutations and decreases the frequency of deleterious mutations. The magnitude of selection “felt” by a particular mutation is determined by both the strength of selection on the phenotype and the genetic architecture of the trait. For example, selection acting on trait variation controlled by a large number of loci may not generate substantial changes in the frequencies of individual mutations, whereas selection targeting a phenotype affected by a few loci will likely change mutation frequencies.
As with all DNA variants, the frequencies of causative mutations change randomly as a result of finite population size (see chapter IV.1). Genetic drift can cause mutations to increase or decrease in frequency. When population size is small or differences in genotypic fitness are limited, frequency changes due to genetic drift can overwhelm those caused by selection. Mutation (when rates are high) and migration also affect allele frequency.
Population genetic models predict that mutations contributing to complex trait variation will span the frequency spectrum from rare to common. General statements about the frequency spectrum underlying traits of evolutionary interest are not yet possible, but it is clear that the frequencies of causative mutations affect the success of association testing. For example, holding phenotypic effect size constant and assuming no dominance, mutations with frequencies of 0.5 contribute the maximum amount of genetic variance to the population; genetic variance declines as frequencies move away from 0.5. This frequency effect may be balanced by the expectation that rare alleles exhibit larger phenotypic effects, a biologically realistic idea for deleterious mutations.
Whereas the frequencies of causative mutations are usually unknown, the frequencies of marker mutations are directly measured in an association study. The power to detect trait-genotype associations is maximized when marker and causative mutations have identical frequencies. Even when linkage disequilibrium values are the same, frequency-matched alleles are easier to detect than those with divergent frequencies. As a result, the frequencies of marker mutations chosen for genotyping directly influence the classes of causative mutations that can be discovered through association testing. The common strategy of surveying only common mutations skews detected associations toward those generated by common alleles. Because the frequency spectrum of causative mutations is unknown, this bias should motivate choosing markers to span the frequency range or association testing of all variants in the genome (through whole-genome sequencing).
Homogeneity of Population Sample
Associations can be generated by factors other than a direct mechanistic connection between DNA and phenotypic variation. One confounding variable that has received much attention is the presence of structure within the population sample. Unintentionally combining groups that differ in both trait values and allele frequencies can produce false-positive associations at random loci scattered throughout the genome. Several strategies are available to detect and to account for the effects of population structure in genome-wide association studies. Quantile-quantile plots of association P values across loci can reveal genome-wide departures that might be attributable to population structure. Population genetic methods can be applied to genotypes at markers throughout the genome to identify groups in the study sample. Investigators can then split the sample into homogeneous groups for association testing or they can include population membership as a cofactor in association tests.
Not all population structure is an impediment to detecting genotype-phenotype associations. When populations result from gene flow between genetically divergent lineages, phenotypic differences among these admixed individuals may be attributed to allelic differences among their source populations. This “admixture mapping” strategy is particularly useful in hybrid zones.
Multiple Testing
Each comparison between phenotypic values and marker genotypes has some chance of producing a false-positive association. To achieve adequate coverage of the genome, association studies typically require tens of thousands to millions of tests, substantially raising the risk that false positives will be included in the list of identified associations. The simplest approach to control the genome-wide false-positive rate is to simply divide the single-marker critical value by the number of tested markers, but linkage disequilibrium between markers makes this method overly conservative. Instead, researchers can use a permutation procedure that randomizes phenotypes but leaves the linkage disequilibrium structure of marker genotypes intact. Under this method, the corrected significance threshold is obtained by collecting extreme P values from many rounds of genome-wide association testing in which the connection between phenotype and genotype has been erased. An alternative approach is to control the false-discovery rate (FDR), which is the proportion of false-positive associations among all positive tests. If none of the tested markers are linked to variants that affect the phenotype, the genomic distribution of P values should be approximately uniform between 0 and 1. FDR asks whether the observed distribution is instead a mixture between this uniform distribution and one skewed toward lower P values.
General Patterns from Genome-Wide Association Studies
Human populations have been the target of most genome-wide association studies to date. As of September 30, 2011, the National Human Genome Research Institute Catalog of Published Genome-Wide Association Studies listed 5103 SNPs showing good evidence of association with at least one phenotype (from 1032 publications). Inspection of these results reveals some general patterns. First, like QTL mapping, genome-wide association studies often point to multiple genomic locations that control a complex trait. Second, a subset of these associations replicates in other human populations or involves loci previously known to affect the phenotype (or both). This congruence suggests that some identified associations reflect mechanistic connections between genotype and phenotype. Third, most identified loci were not previously known to affect the phenotype of interest, indicating that genome-wide association testing is a powerful approach for discovering new variants that contribute to evolution. Fourth, the vast majority of loci exert small phenotypic effects, a finding that has generated considerable attention. Only a small fraction of the genetic variance in the trait that is suspected to exist in the examined populations (estimated from comparisons among relatives) can be explained by summing the effects of detected associations from across the genome. This “missing heritability” problem is probably caused by limited power to detect many mutations with small effects or low frequencies using reasonable sample sizes and common marker alleles. A practical consequence of this challenge is that individual phenotypic values cannot be accurately predicted from genotypes at the loci statistically associated with the trait. An alternative approach to phenotypic prediction that works better in some contexts (“genomic selection”) fits the relationship between the trait and all genotyped variants into a single statistical model. For evolutionary studies, the standard genome-wide association strategy is still preferable because it points to specific genes and pathways responsible for phenotypic evolution. Although the vast majority of human studies target disease phenotypes, nondisease traits show similar properties. For example, genetic differences in height are determined by a large number of mutations with small phenotypic effects.
Looking beyond humans, published genome-wide association studies are currently biased toward domesticated plants and animals. Recent and intense selection by humans has produced striking phenotypic divergence within or between these species, increasing the power of association testing. In some cases, loci with large phenotypic effects on complex traits have been identified and a larger fraction of genetic variation has been explained than in human studies. For example, association testing revealed a major role for the insulin-like growth factor 1 (IGF1) gene in body size evolution in dogs. Determining whether the genetic basis of trait variation in natural populations of evolutionary interest more closely resembles that in humans or that in domesticated organisms will require genome-wide association studies across a broad array of species. Variation in population history among species will generate differences in linkage disequilibrium, allele frequencies, phenotypic effects of mutations, and population structure, suggesting caution in comparisons across groups.
4. CURRENT CHALLENGES AND PROSPECTS FOR FUTURE RESEARCH
If genome-wide association testing can successfully find variants that contribute to phenotypic evolution, why hasn’t this strategy been applied more widely in evolutionary biology? One reason may be that association testing is designed for application to within-population variation; QTL mapping is a better strategy for dissecting the genetic basis of trait differences between populations or species. Other barriers are practical. Simulation studies and results from humans suggest that large sample sizes are typically required. Additionally, surveying molecular variation across genomes is a challenging task in organisms without genomic tools.
These challenges can be overcome. Amassing large numbers of unrelated individuals from a population is an achievable goal, especially for organisms that are easy to collect such as invertebrate animals, plants, and microbes. Although surveying thousands of individuals may not be realistic, sampling hundreds may suffice for finding the loci that contribute disproportionately to trait variation. The genomic resources required for genome-wide association testing can now be developed for a broader variety of organisms. One approach is to sequence the genomes of a handful of individuals using next-generation sequencing technology, compare the sequences to identify (common) SNPs, and develop an array to genotype these SNPs in a larger sample from the population. Although this procedure is not cheap, rapid advances in sequencing and genotyping are bringing the cost within reach of evolutionary biologists studying organisms that are not traditional genetic models. Results from the candidate gene approach should provide further motivation for genome-wide association studies in natural populations. This strategy has identified a variety of genes that contribute to variation in evolutionarily interesting phenotypes in natural populations (see chapter V.12). Although these links have been biased toward genetically simple phenotypes controlled by small numbers of genes, some traits have been more complex, including behavior.
A more fundamental challenge is how to proceed after a genotype-phenotype association is identified. The approaches described above locate the genetic origins of phenotypic differences in genomic regions or even specific genes, but a causative mutation is unlikely to be pinpointed from QTL mapping or associating testing alone, because multiple mutations in linkage disequilibrium will typically be found in associated intervals. Laboratory crosses and association studies do not evaluate the biological mechanism that connects genotype with phenotype. In the future, sequencing genomes and exhaustively testing for associations at all variants (rather than relying on markers) may ameliorate this problem, but the resolution may still be limited by linkage disequilibrium (and the multiple testing burden will only worsen). Although variants can be prioritized by location (e.g., coding vs. noncoding), levels of conservation across divergent species, or predicted biochemical effects, functional studies are ultimately needed to identify the causative mutation. Creative methods for whittling down the number of candidate variants will reach a premium as the ability to sequence whole genomes expands.
FURTHER READING
Balding, D. J. 2006. A tutorial on statistical methods for population association studies. Nature Reviews Genetics 7: 781–791. This review clearly articulates the issues faced by investigators conducting genome-wide association studies.
Flint, J., and T.F.C. Mackay. 2009. Genetic architecture of quantitative traits in mice, flies, and humans. Genome Research 19: 723–733. This review summarizes knowledge about the genetic basis of complex traits in three species and compares the strategies of QTL mapping and genome-wide association testing.
Hamblin, M. T., E. S. Buckler, and J.-L. Jannink. 2011. Population genetics of genomics-based crop improvement methods. Trends in Genetics 27: 98–106. This review correctly argues that population history is an important determinant of the success of genome-wide association studies and raises the idea that the inferred genetic architectures of complex traits may differ between agricultural crops and humans.
Hindorff, L. A., J. MacArthur, A. Wise, H. A. Junkins, P. N. Hall, A. K. Klemm, and T. A. Manolio. A catalog of published genome-wide association studies. Downloadable from www.genome.gov/gwastudiesgwastudies. Accessed Sept. 30, 2011. This database from the National Human Genome Research Institute compiles genome-wide association study results and is regularly updated.
International Human HapMap Consortium. 2005. A haplotype map of the human genome. Nature 437: 1299–1320. This paper describes the scale and magnitude of linkage disequilibrium involving common variants across the human genome. The results have guided the design of genome-wide association studies.
Lynch, M., and B. Walsh. 1998. Genetics and Analysis of Quantitative Traits. Sunderland, MA: Sinauer. This book provides a comprehensive review of genetic methods for analyzing complex traits, with an emphasis on laboratory crosses.