CHAPTER 5
Cardiovascular Monitoring
Introduction
Often, anesthesia impairs the patient’s ability to maintain cardiovascular stability. Thus, cardiovascular monitoring equipment is critical for ensuring the safe delivery of anesthesia. In the past, assessment of the function and integrity of the cardiovascular system during anesthesia was limited to visual and tactile observations. Surrogate measures of physiologic variables such as heart rate, blood oxygenation, and blood pressure arose from a finger on the pulse and estimation of skin color and the color of the shed blood. Today, advances in monitoring have reduced anesthesia complications and permitted surgical advances. Some of these practices are so essential that their application is mandated by the American Society of Anesthesiologists (ASA) guidelines for delivery of anesthesia. Anesthesia technicians and technologists are critical in both simple and complex monitoring and must understand its use. Here, the physiology underlying the ASA standard monitors and the advanced monitors of the cardiovascular system will be discussed.
The heart, lungs, and blood vessels work together to deliver oxygenated red blood cells to metabolically active tissues throughout the rest of the body. The tissues utilize oxygen as well as carbohydrates to power cellular function. Without a continuous supply of oxygen, cells die. Hypoxia occurs when the supply of oxygen delivered to tissue is insufficient to meet the metabolic demands of that tissue. Ischemia is a term used to describe cell death occurring due to hypoxia. Different tissues and organs have different sensitivity to oxygen deprivation. For example, the heart and brain are organs that have very high demands, are exquisitely sensitive to hypoxia, and will become ischemic within minutes after disruption of their oxygen delivery. In contrast, some cells of the skin have low metabolic needs and survive for many days without oxygen. Shock is a condition in which the entire body is not receiving adequate perfusion to maintain oxygen delivery and meet metabolic needs; it is often, but not always, characterized by low blood pressure. The overall goal of cardiovascular monitoring is to assess the adequacy of the perfusion of the tissues of the body. Cardiovascular monitors integrate to help measure this overall goal of oxygen delivery.
Pulse Oximeter
If the job of the cardiovascular system is to deliver adequate oxygenated blood to meet the metabolic needs of the body, how does the pulse oximeter help measure that?
The pulse oximeter is often the first monitor placed on a patient upon arrival to the operating room or procedural area because of the wealth of information it provides. The pulse oximeter provides information not only on blood-oxygen saturation but also on pulsatile heart rate, regularity of heart rhythm, and adequacy of peripheral perfusion. Because of this wealth of information, the utility of the pulse oximeter cannot be overstated.
Peripheral Capillary Oxygen Saturation Percentage (SpO2)
The pulse oximeter provides continuous monitoring of the oxygen saturation of hemoglobin on red blood cells traveling through peripheral capillary blood vessels. Oxygen saturation measured by the pulse oximeter is reported as the SpO2. While SpO2 is used by the anesthetist to continuously monitor the oxygen delivered to metabolically active tissues, it is not a direct measurement of the oxygen content of blood. SpO2 serves as a surrogate measurement of oxygen saturation of hemoglobin in arterial blood (SaO2). Hemoglobin is a protein molecule within the red blood cell that binds, transports, and releases oxygen molecules to tissue (Fig. 5.1). SaO2 is, in turn, related to the oxygen content of arterial blood (CaO2). CaO2 represents the total quantity of oxygen in arterial blood. CaO2 is a combination of the amount of oxygen bound to hemoglobin and the amount of oxygen dissolved in blood. CaO2 is described by the following equation:
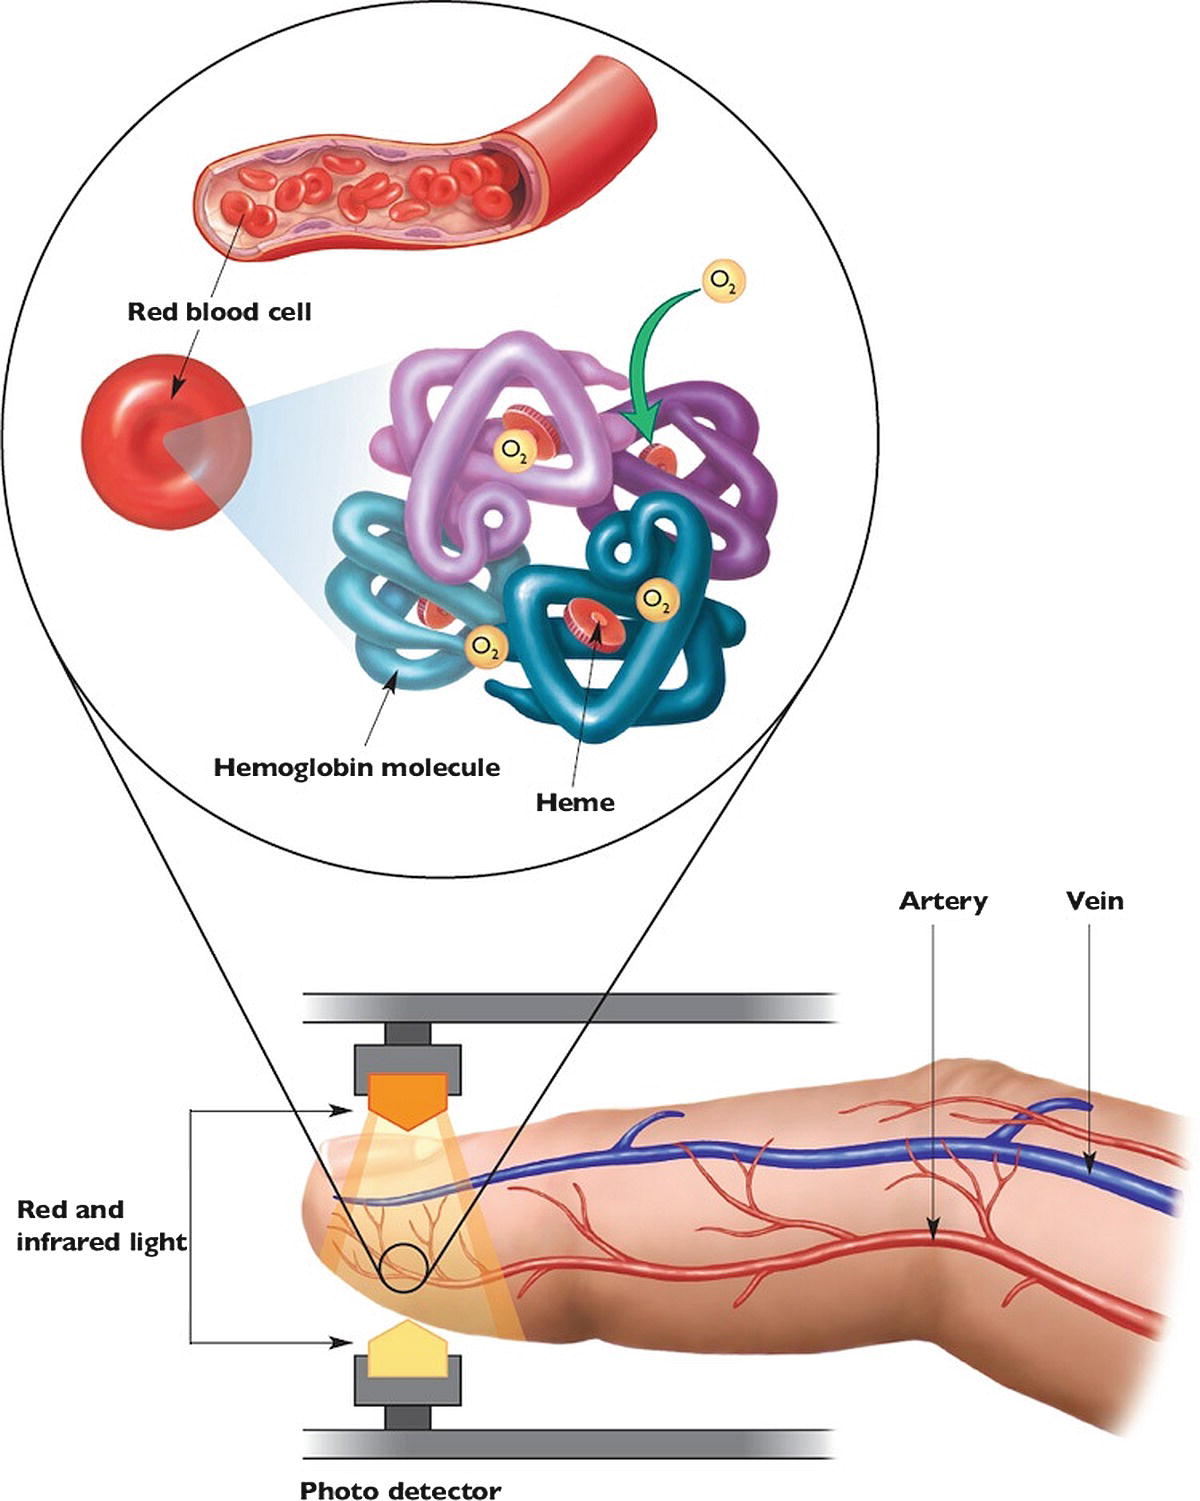
FIGURE 5.1. The pulse oximeter, the red cell, and the hemoglobin molecule. (From Valdez-Lowe C, Ghareeb S, Artinian NT. Pulse oximetry in adults. Am J Nurs. 2009;109(6):52-59, with permission.)

Hgb is the amount of hemoglobin in grams per deciliter of blood, 1.34 is a constant representing the amount of oxygen in milliliters that can be bound to each gram of hemoglobin, PaO2 is the partial pressure of oxygen in arterial blood, and 0.003 is a constant representing the fraction of gaseous oxygen that will dissolve in blood. Greater than 98% of the oxygen in blood is bound to hemoglobin. Therefore, the primary determinants of oxygen content are the amount of hemoglobin in blood (Hgb) and the oxygen saturation of hemoglobin (SaO2). Direct measurement of SaO2 can be done but requires a sample of arterial blood for chemical analysis, a process that is both invasive and time consuming. SpO2 is a very close representation of SaO2 and is measured noninvasively and continuously. For these reasons, SpO2 is used in place of SaO2 to provide a continuous estimate of the oxygen saturation of hemoglobin. SpO2 does not directly represent the oxygen content of the blood but is an excellent surrogate: it closely estimates SaO2, which is the most variable and most important contributor to oxygen content, as hemoglobin changes slowly (primarily with blood loss) and dissolved oxygen contributes little.
The normal value for SpO2 of a patient breathing room air is 95%-100%. While no lower limit of SpO2 has been described, a value less than 92% should raise concern for hypoxia and prompt intervention to improve oxygen saturation.
Technologic details on how the pulse oximeter works are found in Chapter 31, ASA Standard Monitors.
Electrocardiogram
Electrocardiogram (ECG) refers to the continuous measurement of the electrical activity of the heart. Recall from Chapter 4 that cardiac muscle is signaled to contract by an electrical impulse traveling from the sinoatrial (SA node) down through the atria and ventricles in an organized myocardial conduction system to the rest of the cardiac muscle. This impulse causes powerful electrical currents in the cardiac muscle as it depolarizes and repolarizes. A machine with lead wires and electrodes attached to the surface of the chest can measure these currents, amplify them, and record them on a graph, the ECG. The electrodes are small adhesive pads with electroconducting gel. They are attached to the ECG machine with lead wires. Each lead wire, with its attendant electrode, is attached to the body in a specific arrangement (Fig. 5.2).
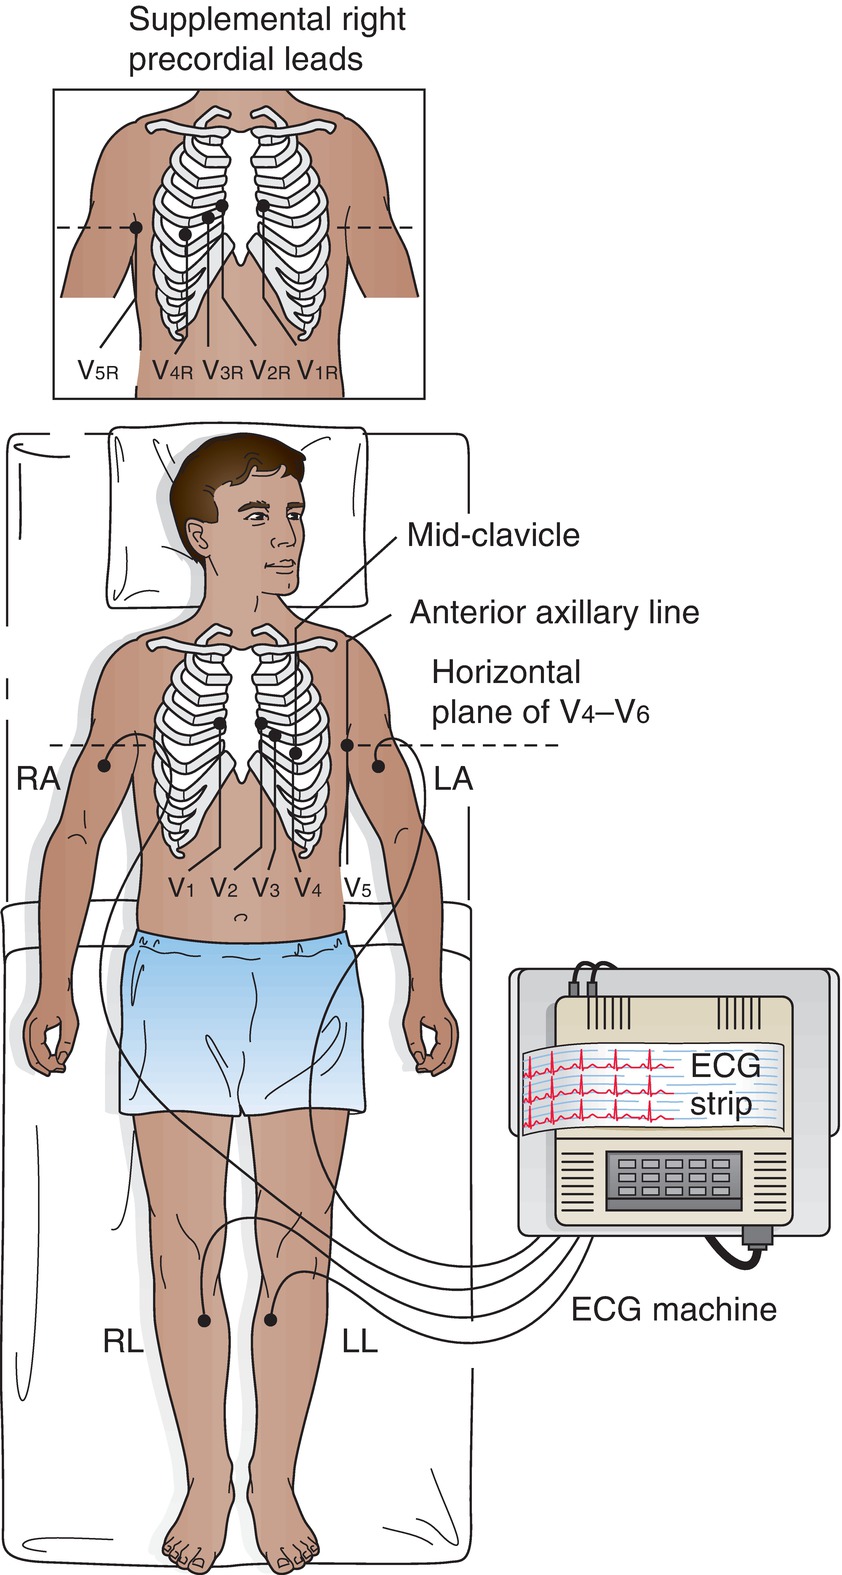
FIGURE 5.2. Electrode placement in different positions to generate a 12-lead ECG. (Adapted from Molle EA, Kronenberger J, West-Stack C, et al. Lippincott Williams & Wilkins’s Pocket Guide to Medical Assisting. 2nd ed. Philadelphia, PA: Lippincott Williams & Wilkins; 2005, with permission.)
The specific location of the electrodes allows monitoring of signals from different directions and can be used to monitor different regions of the heart. Two or more electrodes are combined to form a “lead,” which should not be confused with a single lead wire. Each lead monitors the electrical signals from a specific direction. For example, the electrodes and lead wires from the right arm and the left arm are paired to create lead I. Electrical signals that travel along the axis from the right arm toward the left arm are measured and displayed as lead I. Signals traveling toward the designated electrode will be recorded as positive or upward deflections on the ECG. Therefore, electrical signals traveling toward the left arm electrode along the axis formed by the right arm and left arm electrodes will be recorded as upward deflections on the ECG. If the electrodes and lead wires for the right arm and the left arm are placed properly, lead I will measure electrical forces in the heart that are traveling toward the left. In another example, the electrodes placed on the right arm, left arm, and left leg are combined into a single reference point in the center of the chest that is paired with the left leg electrode to form lead II. The axis from the reference point in the center to the left leg points leftward and inferiorly. Therefore, if the electrodes are properly placed, lead II will measure electrical forces in the heart that are traveling leftward and inferior. A standard ECG uses 10 electrodes (with 10 lead wires) in specific locations. The lead wires are used in various combinations to produce 12 standard leads. Each lead measures the electrical forces from a specific direction. Figure 5.3 demonstrates the spatial orientation of the electrical forces measured by each of the standard 12 leads.
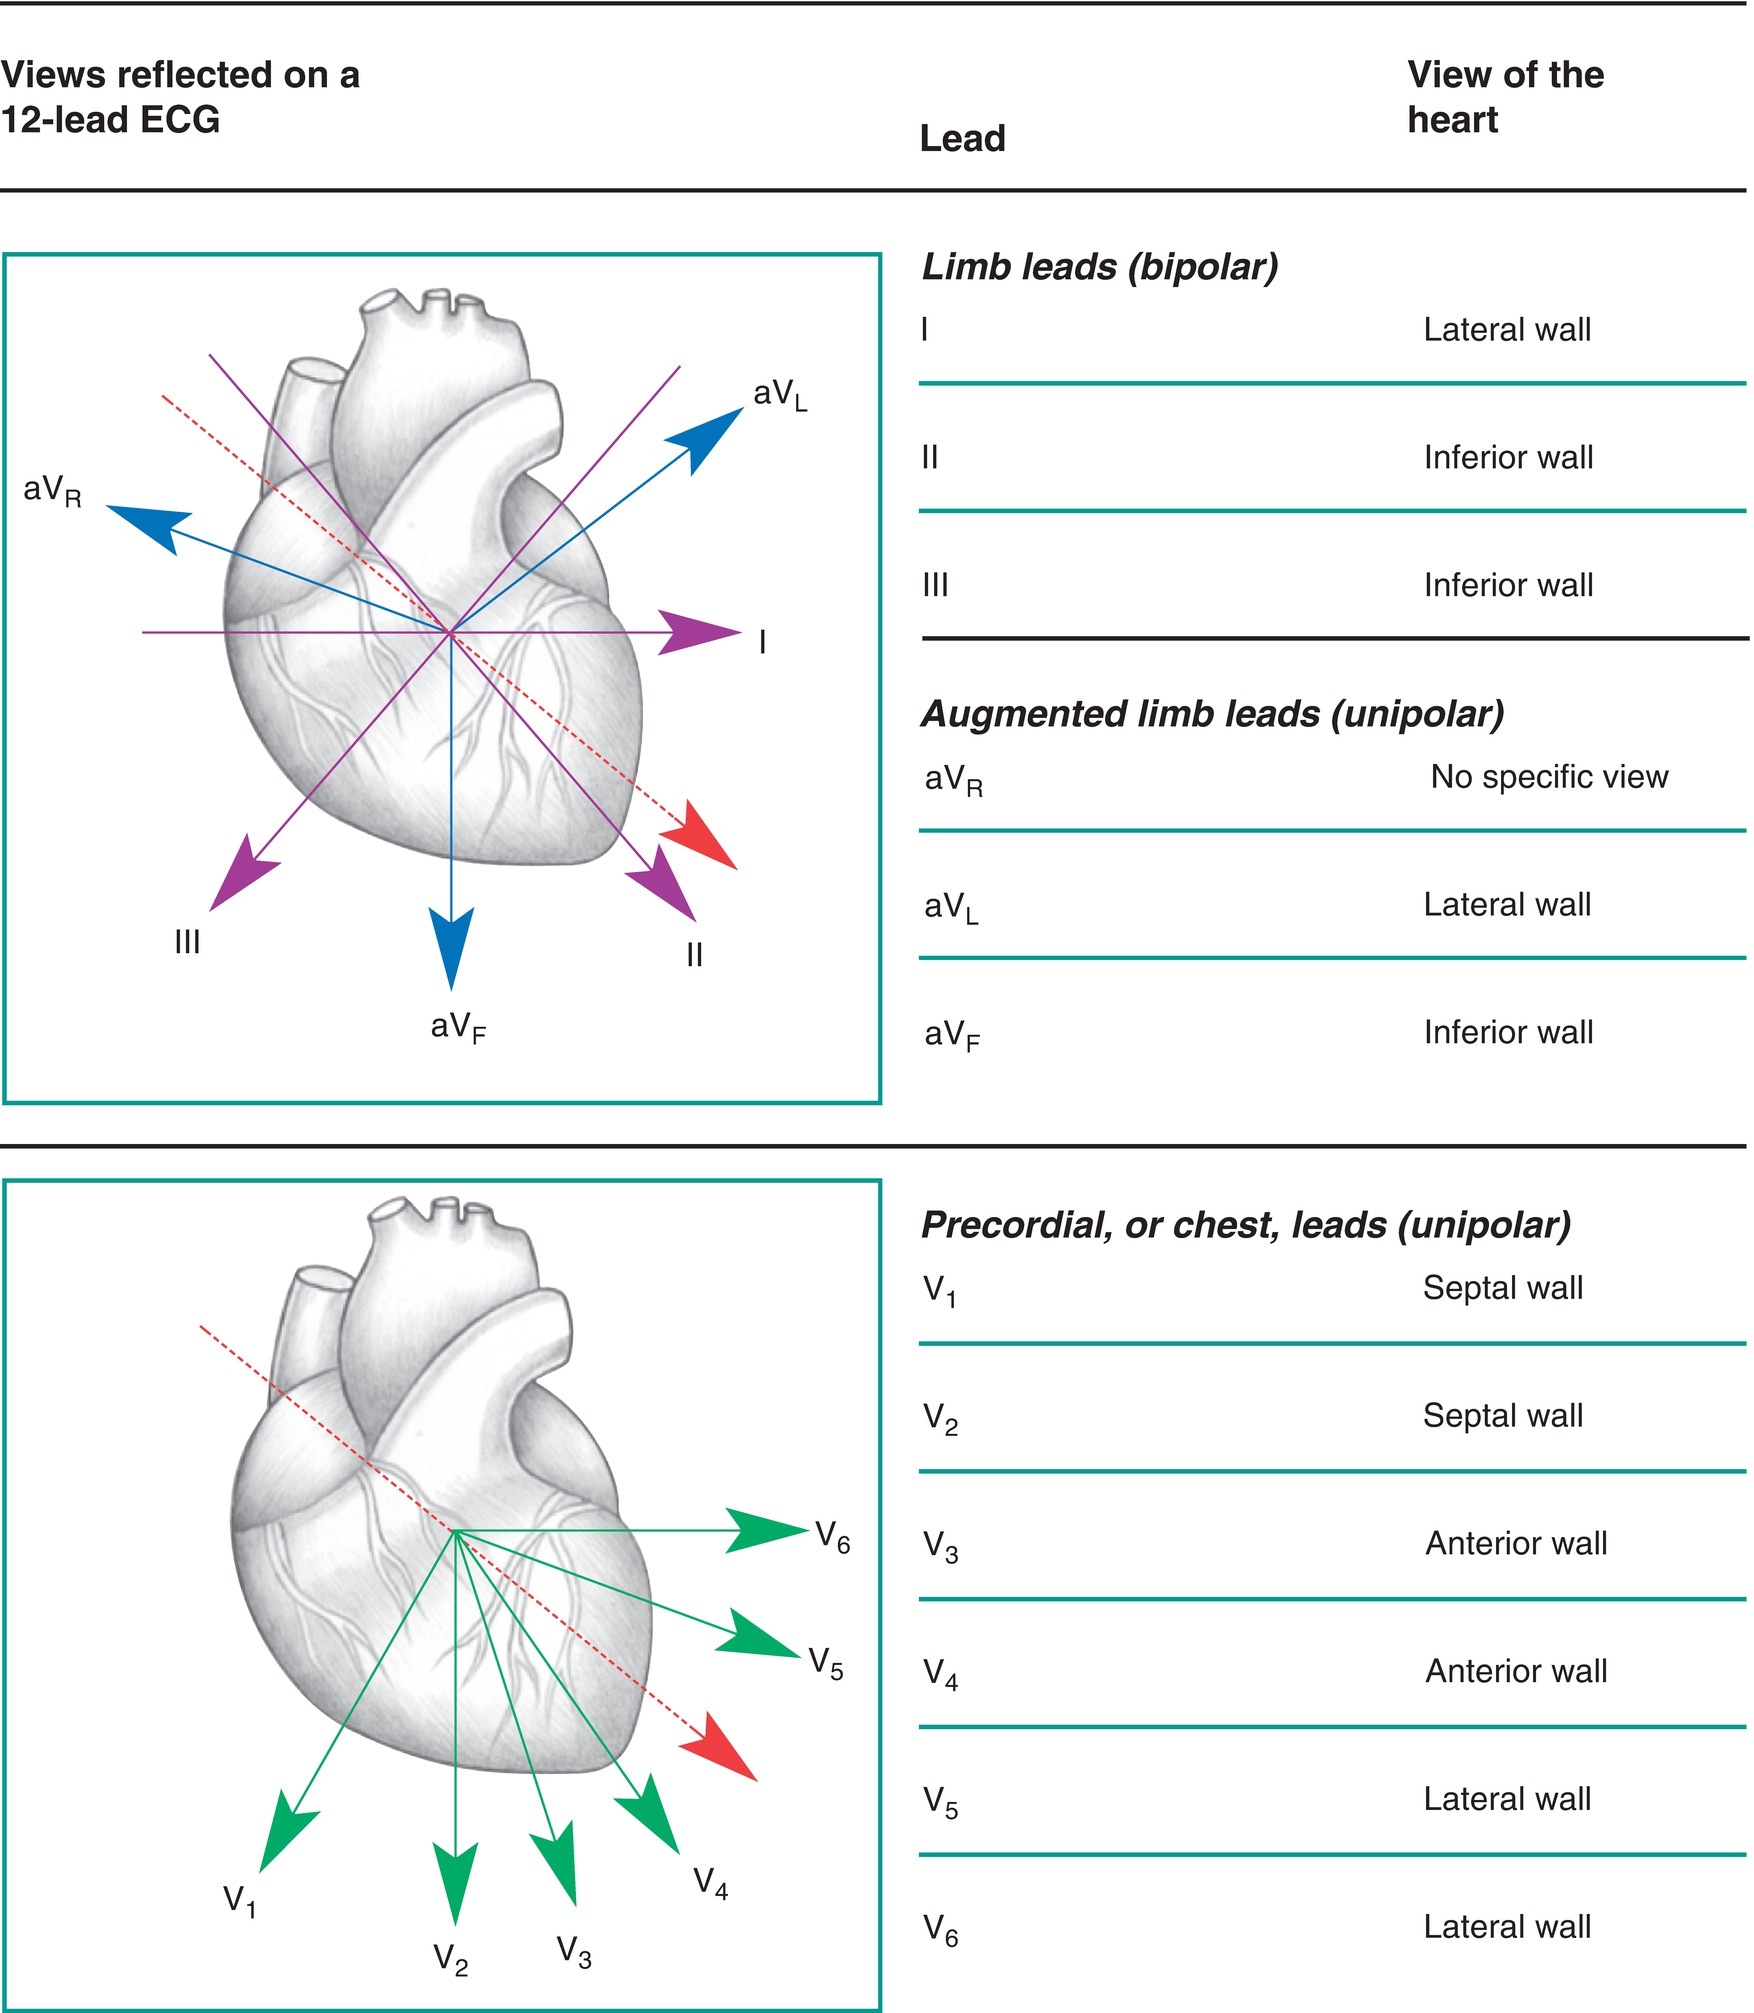
FIGURE 5.3. The spatial orientation of the 12 standard ECG leads. (From Springhouse. ECG Facts Made Incredibly Easy. 2nd ed. Ambler, PA: Wolters Kluwer Health; 2010, with permission.)
Figure 5.4 shows a 12-lead ECG. Each small 1-mm box on the vertical axis of the ECG is 0.1 mV in a standard ECG (the sizing can be changed). By convention, most clinicians refer to the size of the waves in millimeters and not millivolts. The ECG waves are recorded over time, with the paper moving at 25 mm/s. At that paper speed, each large box (5 mm) represents 0.2 seconds; each small box (1 mm) represents 0.04 seconds. In this way, we can measure various features of waves on the ECG. If two events on the ECG are separated by four small boxes, the time separating the events is 0.16 seconds. Just as the size can be changed from the standard 1 mm equal to 0.1 mV, the speed of the paper (or tracing on a monitor) can be changed. The clinician needs to be aware of the size and speed settings to properly interpret the ECG. Typical 12-lead ECGs measure and record from three leads simultaneously for about 2.5 seconds, before switching to three more leads, and so on until all 12 leads are recorded over about a 10-second period on a single sheet of specialized graph paper. The leads are displayed in a standardized pattern as illustrated in Figure 5.4. In addition to graphing the standard 12 leads, most ECGs graph 2 or 3 of the leads over the entire 10-second period. They are graphed at the bottom of the ECG printout. Although these recordings are a subset of the same leads, graphed above, they represent a continuous 10-second period. These long recordings are useful in the diagnosis of abnormal electrical rhythms (arrhythmias).
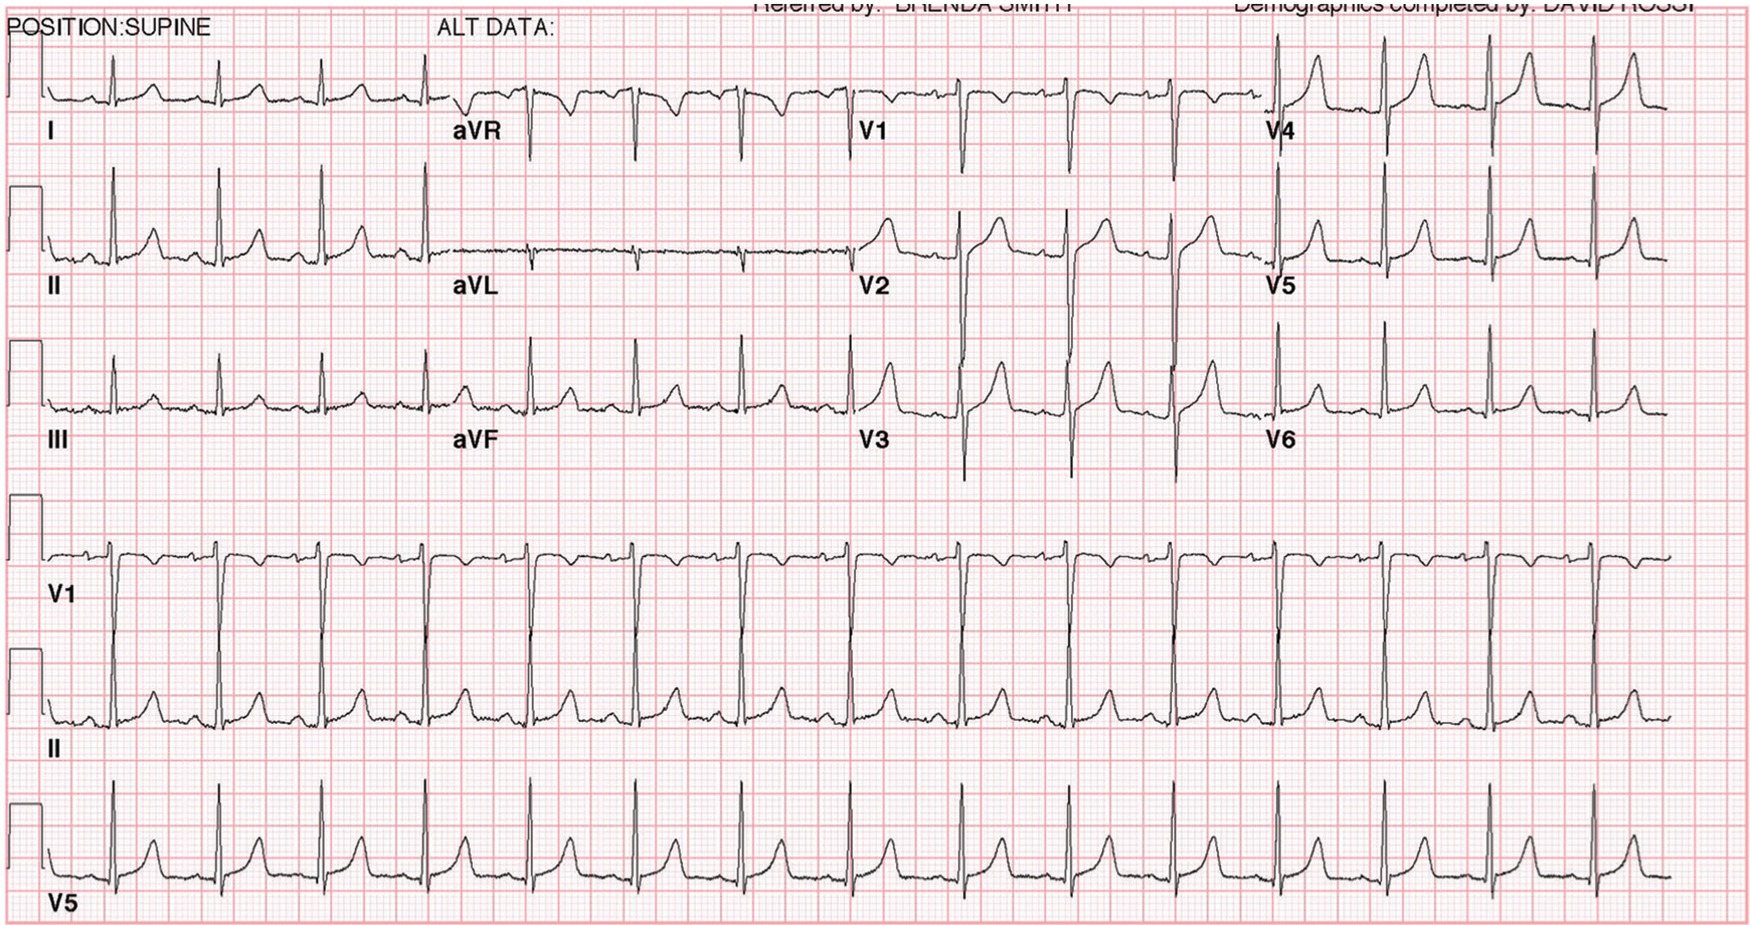
FIGURE 5.4. Standard 12-lead ECG.
ECG monitors in the perioperative setting usually use a 3-, 4-, or 5-lead wire system. Depending upon how many lead wires you are using, they can be combined to produce anywhere from 3 to 12 modified leads. These monitors can display one or more leads continuously on the screen, as well as print one or two leads on a “strip” that may be easier to analyze than by looking at the monitor.
Basic ECG Waveform
The typical ECG wave for one cardiac cycle includes a “P” wave, a “QRS” complex, and a “T” wave (Fig. 5.5). The SA node initiates the cardiac cycle and causes the atria to depolarize followed by atrial contraction. Because the SA node is located in the high RA, the atrial depolarization wave spreads from superior to inferior and from right to left. If you imagine a clock face on a patient’s chest, lead II measures electrical forces heading toward 5 o’clock, inferior and slightly leftward. Therefore, atrial depolarization creates a small positive wave in lead II (the “P” wave). This is why lead II is frequently monitored to determine if the SA node is driving the cardiac rhythm. It is an excellent lead to monitor atrial depolarization. As discussed in Chapter 4, the myocardial conduction system funnels the electrical depolarization to the AV node where the signal is slowed to allow the atria to contract. The signal is then transmitted to the ventricles using the His-Purkinje bundles. The ventricular septum is the first to depolarize followed by the walls of the ventricles. The walls depolarize from the inside of the ventricular wall (endocardium) to the outside of the wall (epicardium). The depolarization of the septum from the left to right produces a short, small electrical signal that is directed anterior, rightward, and slightly superior due to the tilt of the heart in the chest. This electrical signal is moving away from lead II and produces a short, small downward deflection called a “Q” wave. The right and left ventricular depolarizations produce much larger waves due to their larger muscle mass compared to the atria. The RV depolarization is a rightward, anterior signal. The LV depolarization produces a large left, inferior, and slightly posterior signal. Because the LV is much more muscular than the RV, the electrical signal from the LV overwhelms the RV signal. Think of the electrical signals being added together, except they are in opposite directions. Therefore, the RV signal slightly reduces or subtracts from the large LV signal. This combined signal produces a large upward deflection in lead II, which detects leftward and inferior signals. This upward deflection is the “R” wave. Following the R wave, there is often a small negative deflection called the “S” wave. Combined, these three deflections constitute the “QRS” complex. After a short delay, ventricular repolarization follows ventricular depolarization. This repolarization produces the “T” wave. The atria also repolarize; however, this occurs during ventricular depolarization, and the small electrical signal of atrial repolarization is masked by the large ventricular depolarization signal.
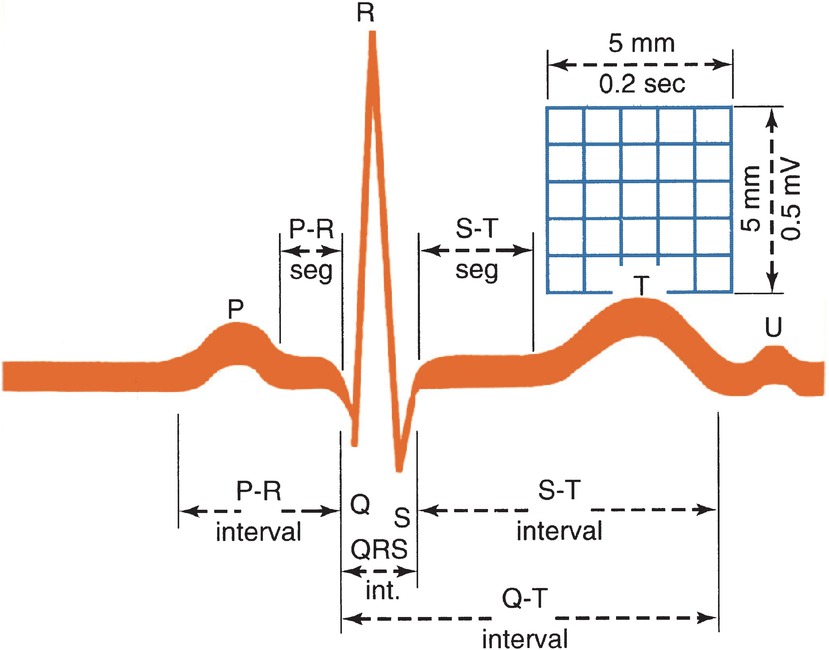
FIGURE 5.5. The ECG wave is formed by the P wave, the QRS complex, the ST segment, and the T wave. (From Weber J, Kelley J. Health Assessment in Nursing. 2nd ed. Philadelphia, PA: Lippincott Williams & Wilkins; 2003, with permission.)
In addition to the P wave, QRS complex, and T wave, clinicians examine the intervals between the waves. The time from the beginning of the P wave to the beginning of the QRS complex is called the “PR interval.” The PR interval represents the time it takes for the electrical signal to travel from the SA node through the AV node and the rest of the myocardial conduction system before reaching the ventricles. The time from the end of the QRS complex to the beginning of the T wave is called the “ST segment.” These waves and intervals are used by clinicians to diagnose problems with the myocardial conduction system and heart muscle (Table 5.1). The default leads monitored in the operating room for adults are II and V5, though the anesthesia provider may choose to look at several different leads using the 5-lead harness standard system. Lead II typically best demonstrates the P wave, and rhythm disturbances are easiest to see there. Leads II and V5 between them “see” electrical activity from the inferior, anterior, and lateral walls of the heart and give the best initial possibility of detecting coronary artery blockage and ischemia in the heart muscle, which can present as repolarization ST segment abnormalities on the EKG.
Table 5.1. Several Examples of Diagnostic Information Derived from the ECG

Noninvasive Blood Pressure Monitor
As discussed in Chapter 4, the heart is a muscular pump responsible for delivering oxygenated blood to the body. Arterial blood pressure, the pressure generated by the heart muscle and the elasticity of arterial blood vessels, serves as a surrogate measure of tissue perfusion. Monitoring blood pressure is necessary as it can alert the anesthetist to the possibility of insufficient tissue perfusion that could result in injury. Arterial blood pressure is monitored in two general ways: noninvasive monitoring and invasive monitoring. Here, the equipment necessary for noninvasive blood pressure monitoring will be discussed.
Perfusion Pressure
Oxygen and nutrients are delivered to tissues in arterial blood; carbon dioxide and other waste products are removed from venous blood. The process of exchanging oxygen and nutrients for carbon dioxide and waste products occurs in the smallest blood vessels in the body, the capillaries. Within capillaries, gases and small molecules are able to diffuse through the thin vessel wall composed of the epithelial cell membranes. Flow of blood through the capillaries is the primary determinant of the rate of delivery of oxygen and nutrients and removal of waste products. Flow through the blood vessels is a function of the pressure gradient applied to the fluid within the vessel and the resistance of the vessel. Generally, the pressure gradient applied to blood within capillaries is the difference between pressure in the arterial circulation and the pressure in the venous circulation. This difference is the perfusion pressure for the tissue. Anesthetic agents as well as the general anesthetic state disrupt the intrinsic mechanisms, which control perfusion pressure. It is not possible to measure perfusion pressure directly; measurement of arterial blood pressure is used as a surrogate for perfusion pressure of the whole body. For this reason, arterial blood pressure must be monitored during the administration of anesthesia.
Arterial blood pressure is described by three numbers, the systolic blood pressure (SBP), the diastolic blood pressure (DBP), and the mean arterial blood pressure (MAP). SBP is the pressure in arterial blood vessels at the peak cardiac contraction, whereas DBP occurs during cardiac relaxation. MAP is the pressure in the vessels averaged throughout the cardiac cycle. MAP can be calculated from the SBP and DBP or directly measured.
For adults, normal blood pressure is a SBP of 90-120 mm Hg and a DBP between 60 and 80 mm Hg. At values of SBP greater than 140 mm Hg or DBP greater than 90 mm Hg, pathologic high blood pressure, or hypertension, exists. In contrast, when SBP is lower than 90 mm Hg or DBP is less than 60 mm Hg, pathologic low blood pressure, or hypotension, exists. An MAP of 60 mm Hg is considered the lower limit of normal. Below this value, hypoperfusion and potential injury may occur in oxygen-sensitive tissues.
Technology
Manual determination of blood pressure (illustrated in Fig. 5.6) has largely been replaced by automated systems but will be discussed here to introduce the general features of monitoring blood pressure. The technology and deployment of noninvasive blood pressure cuff systems will be discussed further in Chapter 31, ASA Standard Monitors. There are three necessary components for monitoring blood pressure: (1) a peripheral artery available for compressing, (2) a pressure application device, and (3) a mechanism for reporting return of arterial blood flow downstream from the site of arterial compression.
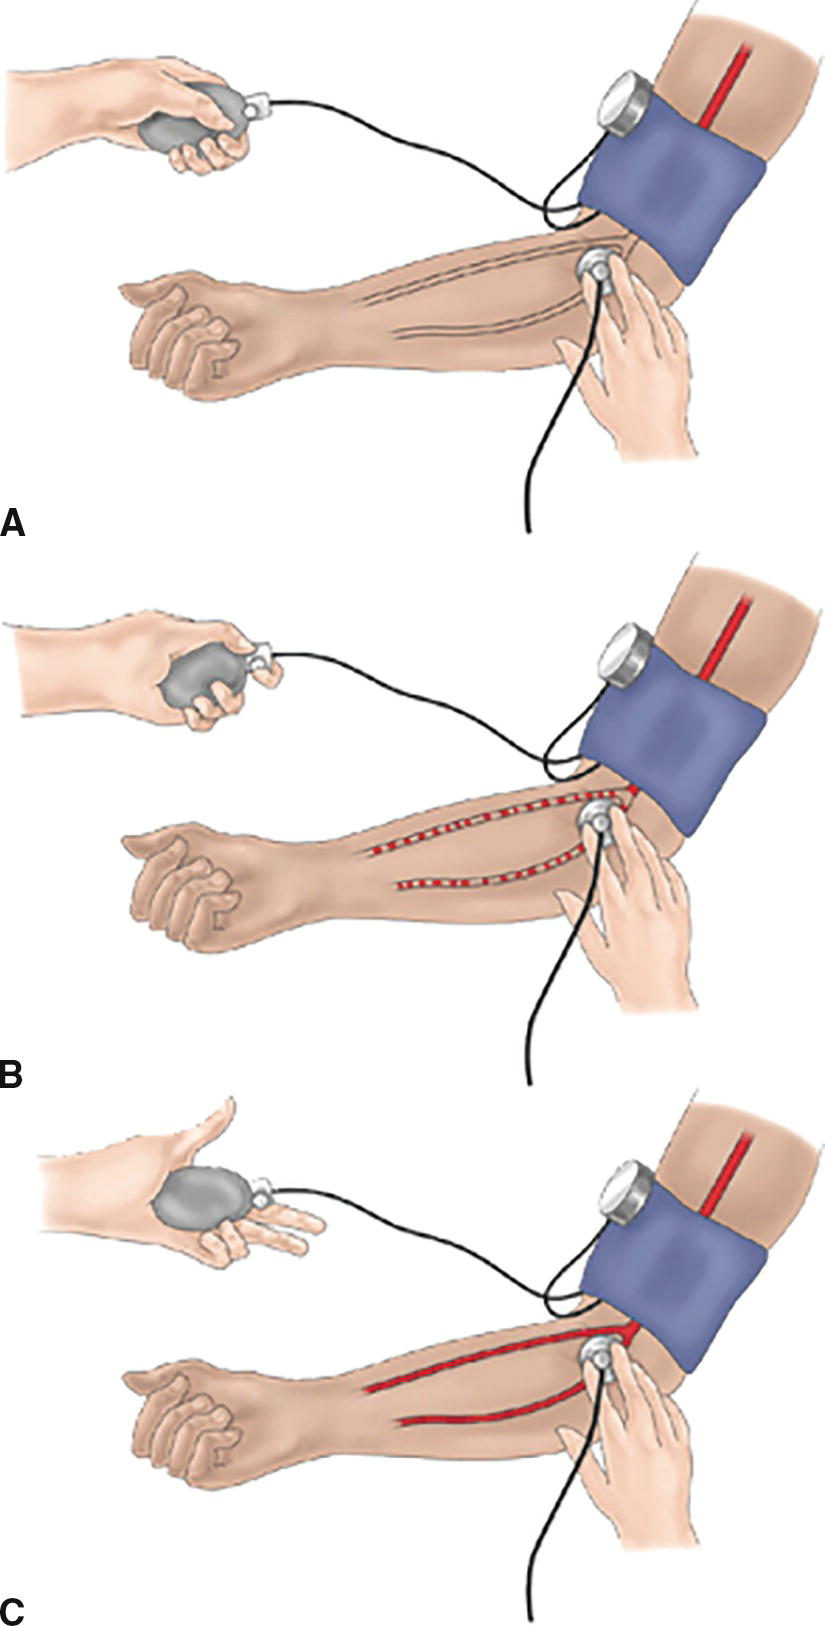
FIGURE 5.6. Manual blood pressure measurement. A: Cuff, with air bladder centered over brachial artery, inflated above systolic pressure. No flow, no audible sound. B: Pressure slowly released. First sound audible at systolic pressure. Pulsatile sound noted. C: Pressure released until sounds disappear: this is now laminar flow, which occurs at diastolic pressure.
The blood pressure cuff consists of a flexible material with an inflatable air bladder that can be wrapped around the patient’s limb. An appropriately sized cuff should have a bladder width approximately 40% the circumference of the limb being measured. A cuff that is too narrow requires a falsely high pressure to occlude the artery. The air bladder is centered over the artery. Attached to the inflatable air bladder is a device to inflate the bladder and a pressure gauge to monitor the pressure within the air bladder; pressure is applied by inflating this air bladder. The air bladder is slowly deflated while monitoring for return of blood flow within the artery distal to the site of compression.
Return of blood flow can be detected by auscultation with a stethoscope placed over the artery. When the artery is compressed, there will be no blood flow distal to the site of compression. As the pressure compressing the artery is released, blood will begin to flow through the partially collapsed vessel in a turbulent fashion. Turbulent flow of blood through the artery can be heard with a stethoscope placed over the artery distal to the blood pressure cuff. This sound is called the first Korotkoff sound, and the pressure applied to the artery at which this sound becomes audible is the SBP. As pressure applied to the artery is decreased, the Korotkoff sound will become louder as turbulent flow increases before becoming quiter then disappearing altogether. Disappearance of the Korotkoff sound occurs when turbulent flow ceases and blood flow becomes laminar within the now completely open, unobstructed artery. The pressure applied to the artery at which the last Korotkoff sound is heard is the DBP. Palpation of pulse distal to the blood pressure cuff can also be used in place of auscultation; however, only the SBP can be determined with this method.
Modern blood pressure cuffs currently used in the operating room are oscillometric. They not only measure the pressure applied to inflate the cuff but also include a sensing mechanism that measures the mechanical energy applied to the cuff by the artery (Fig. 5.7). Following inflation and compression of the artery, the blood pressure cuff deflates in a stepwise manner. As it does so, the distortion of the cuff by the return of arterial blood flow through the artery is detected. The pressure at which maximal amplitude of the distortion of the cuff occurs is the MAP. The MAP is then used to calculate the SBP and the DBP using a proprietary algorithm.
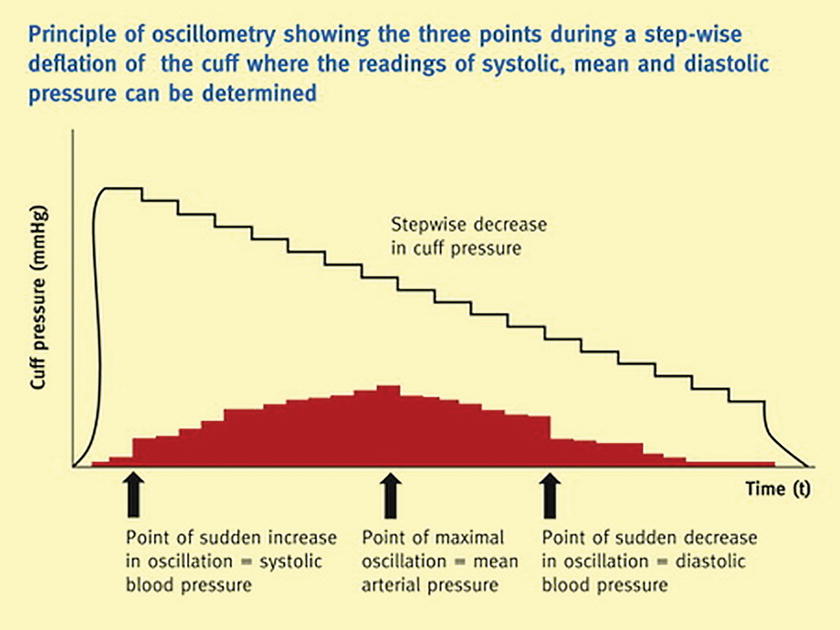
FIGURE 5.7. Oscillometric blood pressure measurement. (From Thomas G, Duffin-Jones V. Monitoring arterial blood pressure. Anaesth Inten Care Med. 2015;16(3):124-127.)
Patient pathology can become a source for error. Oscillometric systems may have difficulty with extremes of arteriosclerosis, irregular heart rates, and slow heart rates. They also have difficulty with extrinsic pressure (such as a surgeon leaning on a cuff) or with patient movement during measurement.
Invasive Arterial Blood Pressure Monitoring
Invasive blood pressure monitoring refers to direct measurement of the arterial blood pressure through use of a pressure transducer in-line with the patient’s arterial blood circulation. A full description of arterial catheter placement can be found in Chapter 36 and 37. Here, the principles allowing continuous measurement of arterial blood pressure following placement of an arterial catheter will be discussed.
Technology
Once an arterial catheter (or any other invasive pressure catheter) has been placed, it is connected to a system of specialized pressure tubing and a pressure transducer. The system itself is flushed with normal saline with or without the addition of heparin. The source for saline is pressurized often to approximately 300 mm Hg, which is high enough to allow the system to “flush” saline against the arterial blood when the high pressure source is opened. The saline serves two purposes: first, it prevents the tubing from filling with the patient’s blood while establishing a continuous column of fluid throughout the system; second, it allows for delivery of small amounts of fluid, usually a continuous flow at 3-5 mL/h, through the catheter and into the patient’s arterial blood circulation, thus preventing blood clot formation at the tip of the catheter.
The pressure transducer is in-line with the column of saline within the tubing. This transducer measures and continuously reports mechanical force within the whole system and converts it to an electrical signal, which can be interpreted by the monitoring equipment and is displayed as a wave form. This mechanical force is a combination of the weight of the column of saline within the tubing and the patient’s blood pressure. To accurately report the patient’s blood pressure alone, the transducer must be zeroed such that the weight of the column of saline above the transducer is removed. This is accomplished by opening the system to the atmosphere with the transducer at a predefined height. This is referenced as “zero” pressure. Once zeroed, any change in pressure on the transducer will be reported as a nonzero pressure. The system is then closed to atmospheric air and opened to the patient. The pressure applied by the patient’s arterial blood pressure to the column of saline within the tubing will be detected by the transducer and reported.
The height of the pressure transducer when it is zeroed relative to the patient influences the accuracy of the monitor. Customarily, the transducer is zeroed at the level of the patient’s right atrium when lying supine, and you should assume a transducer will be zeroed here. Occasionally, when the perfusion of another location (such as the brain) is of critical interest, the system will be zeroed there, so that the measured pressure reflects that perfusion pressure most accurately. For example, during sitting craniotomies, the transducer may be zeroed at the level of the patient’s earlobe so that the blood pressure within the brain is measured directly.
The transducer continuously measures and reports pressure. The time-dependent change in pressure gives rise to a waveform that is reflective of the time-dependent changes in the patient’s arterial blood pressure (Fig. 5.8). By measuring the pressure at the peak and trough of this waveform, the SBP and DBP are determined and displayed automatically. Mean arterial blood pressure is then calculated. Recall that the systolic pressure is the pressure in the left ventricle at its maximum point of work and ejection. This is the highest pressure the heart, the aorta, and the other blood vessels are subject to. The diastolic pressure is the pressure in the aorta at its point of maximum relaxation, just before the next ejection begins: interestingly, this time of relaxation is the only time that the heart muscle itself can fill with blood. By the time the blood reaches the end of the small arterial branches, these pressures have flattened together into the mean arterial pressure: this is the pressure at which blood, oxygen, and nutrients are supplied to the tissues. Depending on the clinical status of the patient, any one of these (SBP, DBP, or MAP) may be the most critical part of the arterial pressure to measure.
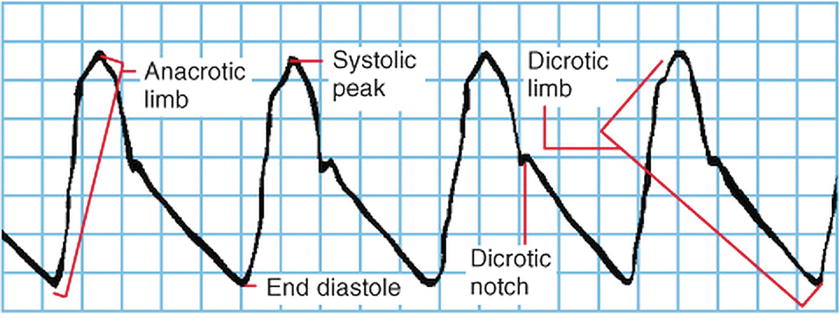
FIGURE 5.8. Normal arterial waveform.
In addition to SBP, DBP, and MAP, additional hemodynamic information can be obtained from continuous measurement of the arterial blood pressure waveform. Pulse pressure variation throughout the respiratory cycle is often used as a surrogate indicator of intravascular volume status (Fig. 5.9). During the respiratory cycle, the amount of blood return to the right atrium varies due to changes in intrathoracic pressure. When a patient who is being mechanically ventilated receives a positive pressure breath, it is harder for blood entering passively from the body to enter the chest: when the mechanical breath is let off and passive exhalation begins, venous return can enter again. When intravascular volume depletion occurs, these changes are exaggerated, as so little blood is available, and the cardiac output primarily and the arterial blood pressure secondarily become very sensitive to changes in the volume of blood returning to the right atrium. When the absolute magnitude of the pulse pressure variation is > 12% of the mean pulse pressure, intravascular volume depletion should be suspected. This qualitative variation can be seen visually on the arterial waveform but can also be analyzed by many standard monitors and displayed as numeric “PPV.” Waveform analysis has also been used to develop surrogate measures of additional hemodynamic parameters utilizing specialized commercial monitors, which measure the shape of the waveform and the area under its curve, and calculate (using proprietary algorithms) stroke volume, cardiac contractility, and cardiac output.
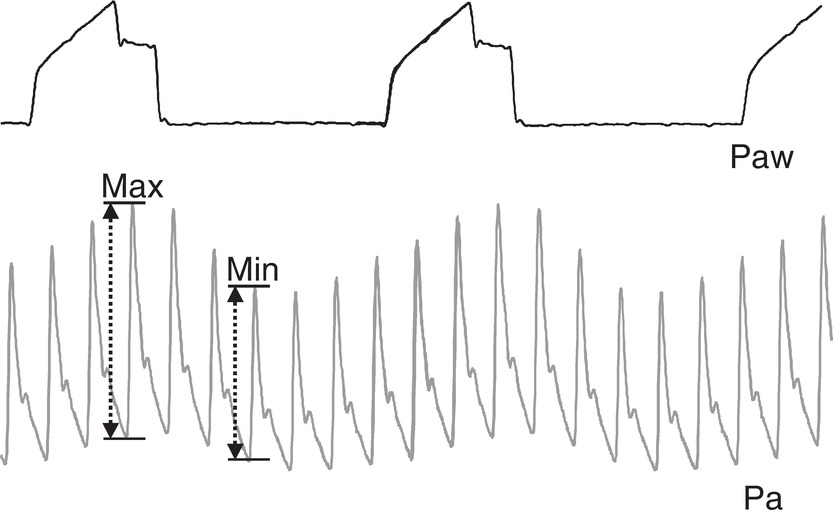
FIGURE 5.9. Pulse pressure variation. Paw, airway pressure; Pa, arterial pressure. Pulse pressure is the difference between arterial systolic and diastolic pressure. Maximum pulse pressure is seen during the expiratory phase of mechanical ventilation, when the chest is not under pressure, and blood can easily enter the chest; that is, when cardiac preload is highest. Pulse pressure is lowest during positive pressure inspiration, when high pressure in the chest makes it harder for the heart to fill. The difference between Max PP and Min PP is PPV. A PPV greater than 12 suggests that blood pressure is excessively responsive to changes in cardiac filling pressures; this happens in hypovolemia.
Equipment
Specialized tubing flushed with saline and appropriate zeroing of the pressure transducer are necessary for accurate measurement of arterial blood pressure. The anesthesia technologist is regularly asked to assemble and zero this system well before the patient enters the operating room. The tubing used for invasive arterial blood pressure monitoring is specialized for that purpose. It must be made of material with known compliance characteristics such that mechanical force is transmitted by the column of saline within the tubing rather than dissipated by stretch of the tubing walls.
When assembling the tubing and flushing with saline, care should be taken to ensure that no air bubbles are present. If not removed, air bubbles within the tubing system or saline reservoir could possibly migrate into the patient’s arterial circulation and occlude blood flow through small diameter vessels, causing injury. Air bubbles also cause artifact in the tracing, as they increase compliance of the system and cause dampening (flattening) of the waveform.
Often central venous pressure (CVP), described further below, will be monitored at the same time as arterial blood pressure, and a single saline source can be used to flush both systems.
Sources of Error
Changes in the height of the transducer relative to the patient following zeroing influence the accuracy of the reported pressure. For every 1 cm of height change in the column of saline in the tubing relative to the transducer, there is a 0.74 mm Hg change in measured pressure due to the weight of the column of saline. The two most common causes of this error are movement of the height of the bed and patient when the transducer is fixed to a pole and accidental dropping of the transducer. Unrecognized dropping of the transducer is particularly problematic, as blood pressure may then be overestimated by 30 mm Hg or more. The transducer should always be moved with the patient.
In addition to potentially causing injury as discussed above, air bubbles within the pressure tubing system interfere with the accuracy of the pressure monitored by the transducer. Saline is, practically speaking, noncompressible. When a continuous column of saline is present within the pressure tubing leading from the arterial catheter to the pressure transducer, it directly transmits the mechanical force arising from the patient’s blood pressure. If present, air bubbles within the tubing will compress rather than transmit the mechanical force. This compression blunts or dampens the signal monitored by the transducer. Dampening of the signal can also occur due to loose connections between components of the tubing, kinks within the tubing, or use of inappropriate tubing that is too compliant. Dampening of the signal can lead to underestimation of SBP and overestimation of DBP. If dampening is suspected, it can be investigated by performing a fast flush test wherein a quick flush with saline from the source pressurized at 300 mm Hg is applied to the system; the signal oscillations at the end of the flush are observed. An ideal system will display 1 to 2 artifact oscillations following the flush before the arterial blood pressure waveform returns (Fig. 5.10). Fewer than two artifact oscillations suggests dampening. Tubing should not be flushed until it is confirmed that no air is present in the line.
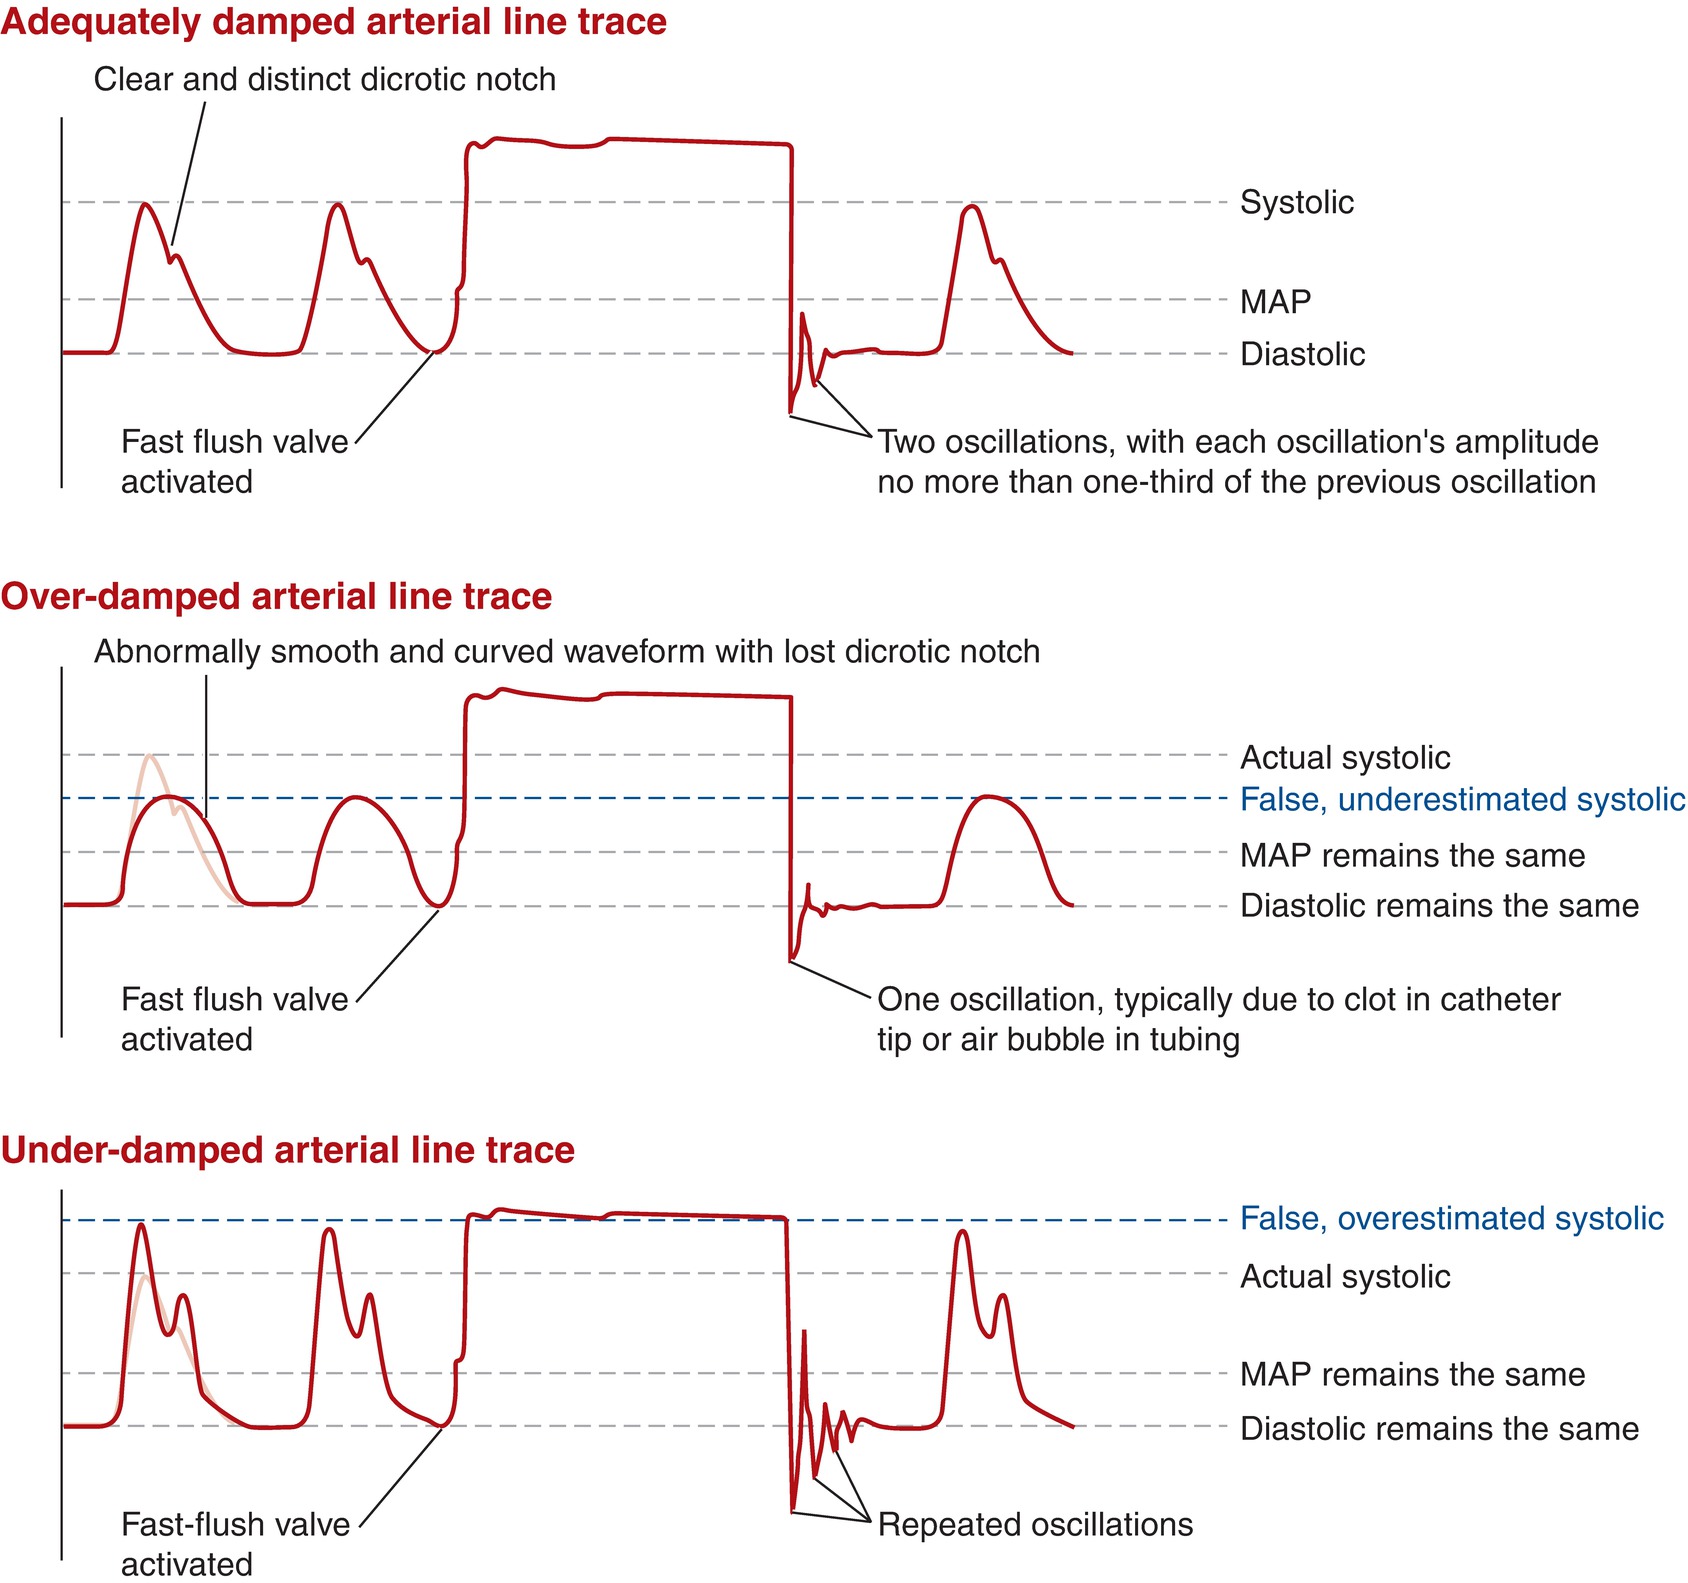
FIGURE 5.10. Arterial line tracings.
Central Venous Pressure Monitor
Central venous pressure is the pressure within the large veins of the body. This pressure can be measured using a system consisting of a catheter within the lumen of the large veins, saline-filled pressure tubing, and a pressure transducer. Placement of a central venous catheter is described in Chapter 36. Here, the principles allowing direct measurement of CVP will be discussed.
Physiologic Significance
CVP is measured in the superior vena cava or inferior vena cava, just prior to their entrance into the right atrium of the heart. As these vessels lack thick, elastic, muscular walls, this pressure arises primarily from the mass of fluid within the venous system. In the past, CVP has been interpreted to reflect the overall amount of fluid volume returning to the right heart. As such, elevation of CVP has previously been used as an indication of either an abnormal accumulation of fluid or failure of the right heart to pump blood. However, this interpretation of CVP has proved to be insufficient to measure volume status and when used as the sole data point to guide treatment can result in harm. It is now recognized that CVP must be integrated with the overall clinical condition of the patient and data available from multiple other sources, including other monitors such as PAC (pulmonary artery catheter) or TEE (transesophageal echocardiography), to guide diagnosis.
In general, the normal range for CVP will be 3-8 mm Hg. Time-dependent changes in CVP or the waveform arise due to altering forces applied to the large veins during the cardiac cycle. The CVP waveform characteristics, a series of peaks and valleys, arise from pressure generated by the heart during the cardiac cycle that is propagated back into the venous system (Fig. 5.11). At the end of ventricular diastole, right atrial contraction raises the pressure in the large vessels and is visible in the CVP wave form as the “a wave.” During early ventricular systole, the tricuspid valve bulges into the right atrium, giving rise to the “c wave.” The “x descent” occurs as the right atrium relaxes and the right ventricle empties. During early ventricular diastole, blood entering the right atrium prior to opening of the tricuspid valve raises the pressure in the large vessels resulting in the “v wave,” which is followed by opening of the tricuspid valve and the “y descent.” Alteration of normal CVP waveform characteristics occurs with many pathologic states. However, CVP waveform analysis is subject to error and difficult to use as a sole source of information.
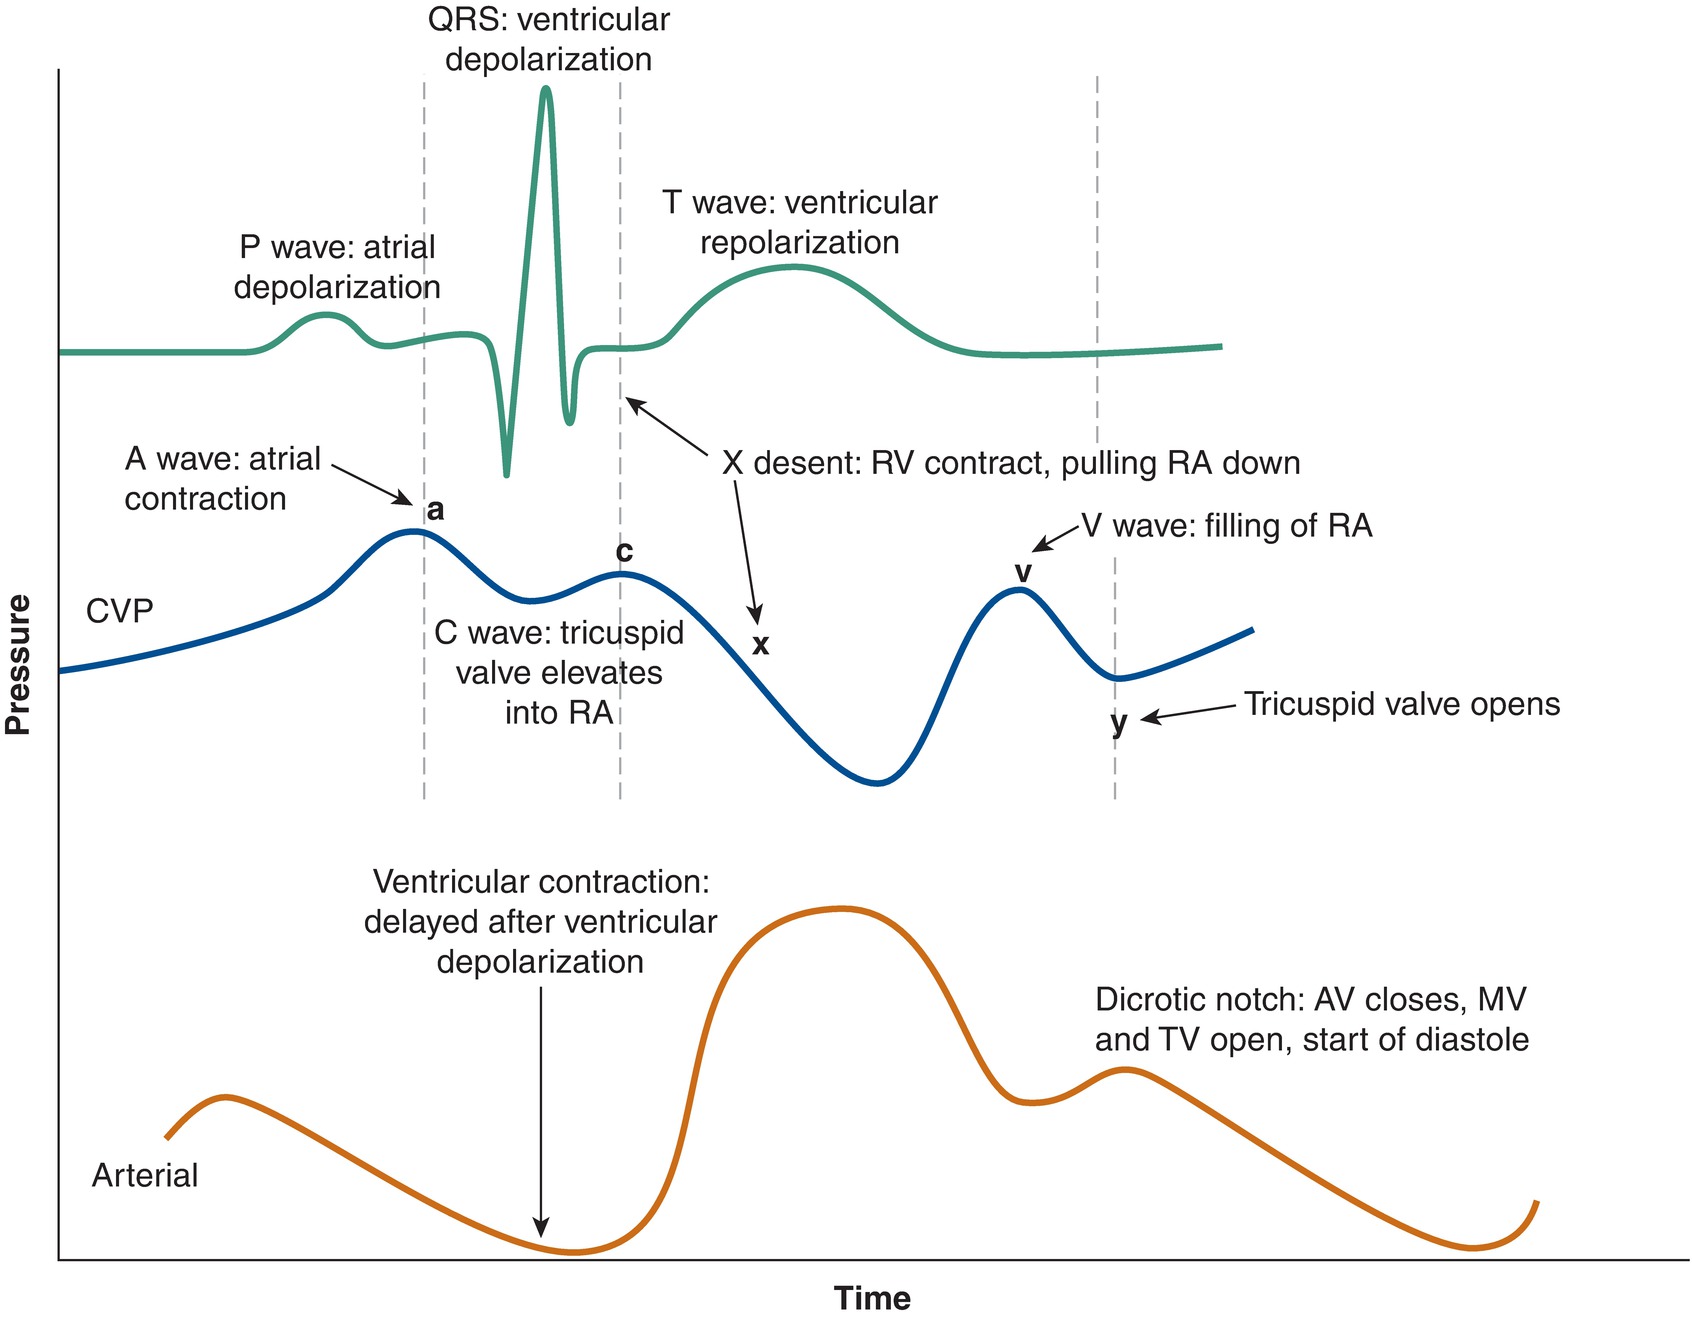
FIGURE 5.11. Central venous pressure (CVP) and arterial tracings, and relationship with EKG
Technology
The system for measuring CVP is identical to that described for invasive measurement of arterial blood pressure. A pressure transducer is in-line with a column of saline within specialized pressure tubing that is connected to the central venous catheter. The ideal position for the tip of the central venous catheter is at the junction of the vena cava and the right atrium, also referred to as the cavoatrial junction. This provides a combination of accurate pressures and low risk of injury. The pressure transducer is zeroed at a predefined height estimated to be level with the patient’s right atrium when lying supine.
Pressure is monitored continuously and displayed both as a time-dependent wave form and a numerical value. The numerical CVP is reported continually as the average pressure monitored over a period of time, generally 5 seconds. Because the CVP is a constantly changing waveform dependent on both the cardiac cycle and the filling and emptying of the chest with ventilation, the actual CVP is defined as the end of the “x” descent (i.e., at the end of ventricular systole, with a relaxed atrium) and the end of a negative pressure exhalation, or the end of a positive pressure inhalation (i.e., when the blood is maximally emptied from the chest). You will occasionally see providers take this precise measurement using a cursor on the monitor.
Equipment
As described for invasive blood pressure monitoring above, CVP monitoring requires specialized tubing flushed with saline, an in-line pressure transducer, and a saline source under pressure. Often a single saline source can be used for multiple systems. The anesthesia technologist will often be asked to assemble this system prior to patient arrival in the operating room.
Sources of Error
The CVP monitor is even more sensitive to height changes than the arterial line. As CVP is a very low pressure system, relatively small movements of the patient relative to the height of the pressure transducer can drastically alter the measured CVP. Air bubbles within the tubing, loose connections, use of inappropriate tubing, and tubing kinks can also be sources of error.
Pulmonary Artery Catheter
The pulmonary artery catheter, also called the Swan-Ganz catheter, is a specialized monitor used to directly interrogate the function of the heart and measure pressures generated by the right side of the heart. Additionally, the dynamic nature of this monitor following placement allows for status of the left heart to be inferred. While it is a source for a tremendous amount of information regarding the integrity of the cardiovascular system, the use of PACs has not been associated with improved patient outcomes; they provide sophisticated information but also carry risk. For this reason, its use is often limited to special circumstances such as cardiac surgery, procedures on large vessels, and liver transplantation. The PAC is placed through an introducer type central venous catheter. This process of PAC placement is described and presented with video in Chapter 37 (Intravascular Monitoring Equipment), and the reader is directed there for a full discussion. It should be noted that proper placement of the PAC requires the coordinated effort of the both the primary operator (the anesthetist) and an assistant (often the anesthesia technologist.) As such, the anesthesia technologist should be familiar with the equipment and its purpose to function as an effective assistant.
Pulmonary Artery Pressure
Pulmonary artery pressure (PAP) is measured following “floating” of the distal lumen of the PAC into the pulmonary artery. It is a function of the pressure generated by the right ventricle during systole and the elastic recoil of the pulmonary artery during diastole. Normal pulmonary artery pressure is 8-20 mm Hg. Pulmonary artery pressure lower than 8 mm Hg indicates that insufficient pressure is being generated by the right ventricle either as a result of low blood volume returning to the ventricle or weak contractile force generated by the ventricle. Values of pulmonary artery pressure greater than 20 mm Hg indicates resistance to flow of blood through the pulmonary capillaries, a state referred to as pulmonary hypertension. Values of pulmonary artery pressure greater than 25-30 mm Hg are particularly concerning, as this level of hydrostatic pressure can result in movement of the fluid components of blood through the pulmonary capillaries into the alveoli and the formation of pulmonary edema.
Pulmonary Capillary Wedge Pressure
Pulmonary capillary wedge pressure (PCWP) is measured when the PAC is advanced into a small caliber pulmonary artery while the balloon is inflated, “wedged” into the small artery. Pressure is then measured at the tip of the catheter, distal to the balloon. The balloon isolates the catheter tip from the right ventricle, so that the downstream vasculature becomes a continuous fluid column with the left atrium. The PCWP is used to infer the pressure in the left atrium and represents the filling pressure of the left side of the heart.
A normal PCWP is 2-15 mm Hg. A PCWP is measured intermittently rather than continuously as it is hazardous to leave the balloon inflated; one of the feared complications of PA catheter placement is rupture of the pulmonary artery.
Cardiac Output
Cardiac output (CO) measures how much blood the heart pumps every minute or overall cardiac function. It requires measurement of the volume of blood moved by each heartbeat. Since the blood moving through the right and left side of heart are continuous, measurement of cardiac output for the right ventricle is equal to the left ventricle. Report of cardiac function can be better understood by normalizing the measured cardiac output to a patient’s size using the cardiac index. A cardiac output of 3 L per minute might be adequate for a tiny woman but critically low for a large man. Normal cardiac output is 4-8 L per minute, and normal cardiac index is 2.5-4 (the units are liters per minute per square meter). The PAC is able to measure CO through a technique called thermodilution; cardiac index is then calculated using the patient’s height and weight.
Knowledge of cardiac output assists in determining the cause of low blood pressure. If a patient has low blood pressure, and is found to have low cardiac output, this may be because of poor heart function, leading to inadequate tissue perfusion. Another name for this would be cardiogenic shock: failure of the pump action of the heart, resulting in decreased cardiac output, resulting in reduced end-organ perfusion. This leads to acute hypoperfusion and hypoxia of the tissues and organs, despite the presence of an adequate intravascular volume.
Systemic Vascular Resistance
Systemic vascular resistance (SVR) is a measure of the total resistance to flow of blood leaving the left ventricle.
SVR can be calculated using parameters determined by a PAC, because of its relationship to the CO, the MAP, and the CVP.

You may also hear anesthesia providers refer to vascular resistance as “vascular tone,” as it represents the tonic (“all the time”) contraction of the smooth muscles of the vascular wall. When SVR is low, it can result in low MAP, hypoperfusion, and hypoxia of the tissues and organs; this describes a state of “distributive” shock.
Technology
The PAC consists of a catheter approximately 100 cm in length with multiple lumens (Fig. 5.12). Often, there are three ports flushed with saline: a port at the distal tip of the catheter (the pulmonary artery port), a port at approximately 30 cm (the CVP port), and a port at approximately 31 cm (the venous infusion port [VIP]). Additionally, a port and lumen connected to an elastic balloon at the distal tip is present; this port is used to inflate the elastic balloon with 1.5 mL of air. Details of placement of the PA catheter are found in Chapter 37. An understanding of principles of cardiac physiology and monitoring is integral to PA catheter placement, as the catheter is monitored while it is being placed. The inflated balloon at the distal tip of the catheter helps to guide or “float” the catheter tip into the correct position. The primary operator observes the pressure waveform from the distal port. The magnitude of the pressure and the character of the waveform reflect the location of the distal tip of the catheter (Fig. 5.13). The first structure that the catheter tip enters is the central vein. This will display low pressure, low amplitude pressure signal changes. Next, the catheter tip enters the right atrium; this is also a low pressure system; however, a higher-amplitude systolic peak and prominent diastolic valley will be visible. Continued advancement leads to the catheter traversing the tricuspid valve and entering the right ventricle, which is reflected by measurement of larger amplitude systolic pressure peaks. Ventricular dysrhythmias may occur while the tip of the catheter is in the RV. Additional advancement of approximately 10 cm should result in the catheter “floating” into the pulmonary artery. Arrival in the pulmonary artery is reflected by a “step-up” of 5-10 mm Hg in the measured diastolic pressure. Movement into the pulmonary artery can often become the most difficult part of the procedure and require multiple attempts; if the catheter is withdrawn at any point, the balloon must be deflated, and deflation should be verbally confirmed by the assistant prior to withdrawal of the catheter. Once the catheter tip is within the pulmonary artery, additional advancement with the balloon up will result in balloon occlusion of a pulmonary artery branch as its caliber reduces. This is referred to as “wedging” the PAC. The pressure measured here is the PCWP. Once wedging has been achieved, after a pressure reading is taken, usually the balloon will be deflated and the catheter withdrawn approximately 2 cm and locked in this final position.
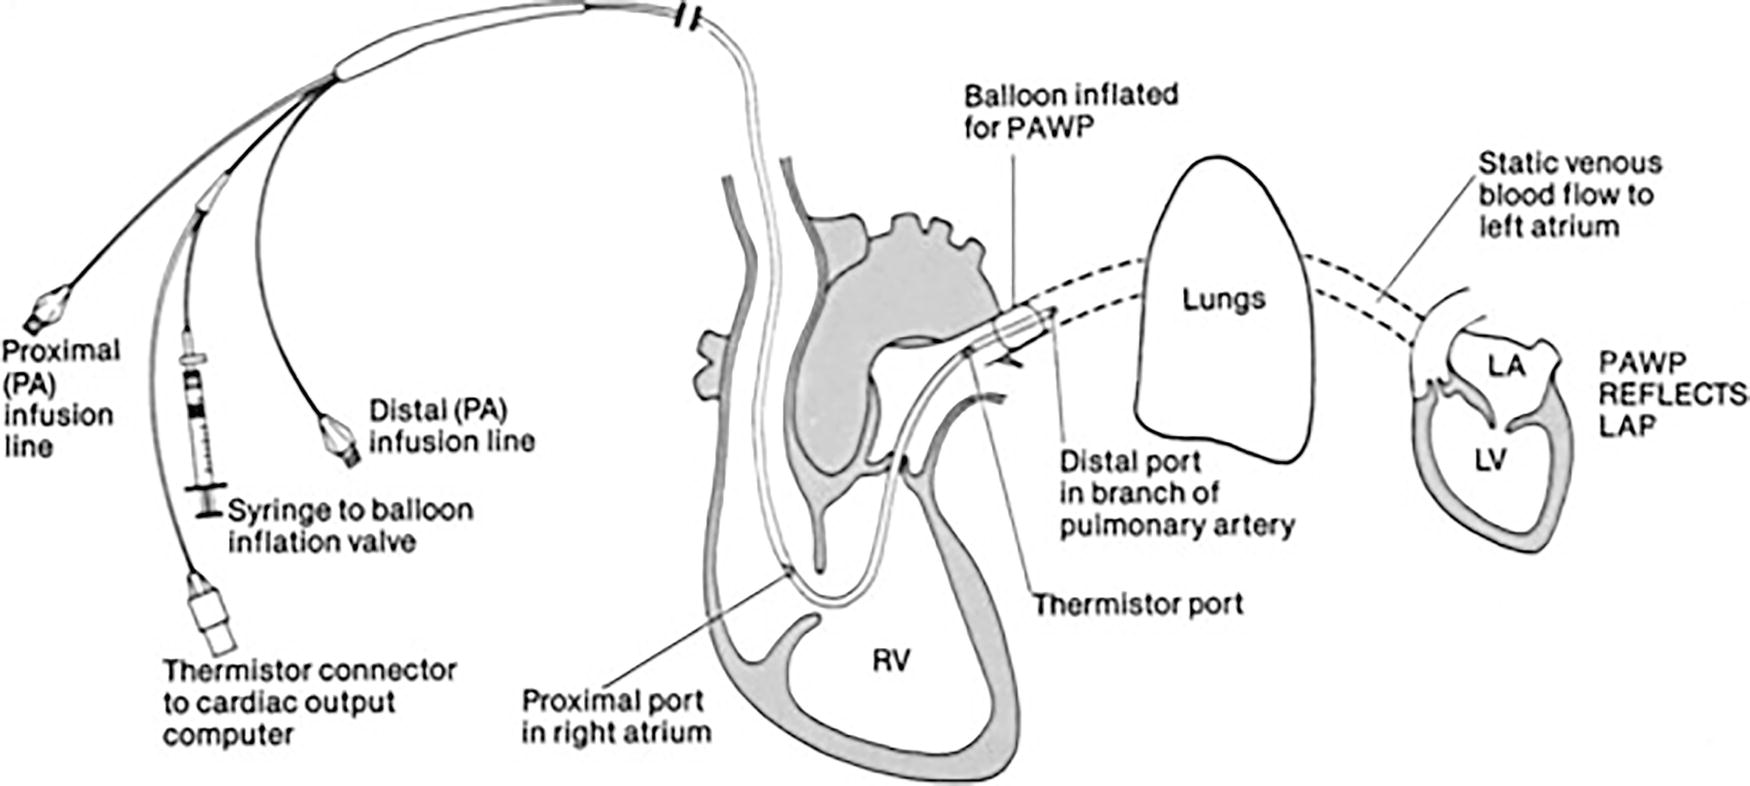
FIGURE 5.12. Pulmonary artery catheter. (Reprinted from Kersten LD. Comprehensive Respiratory Nursing. 1st ed. Philadelphia, PA: Saunders; 1989. Copyright © 1989 Elsevier, with permission.)
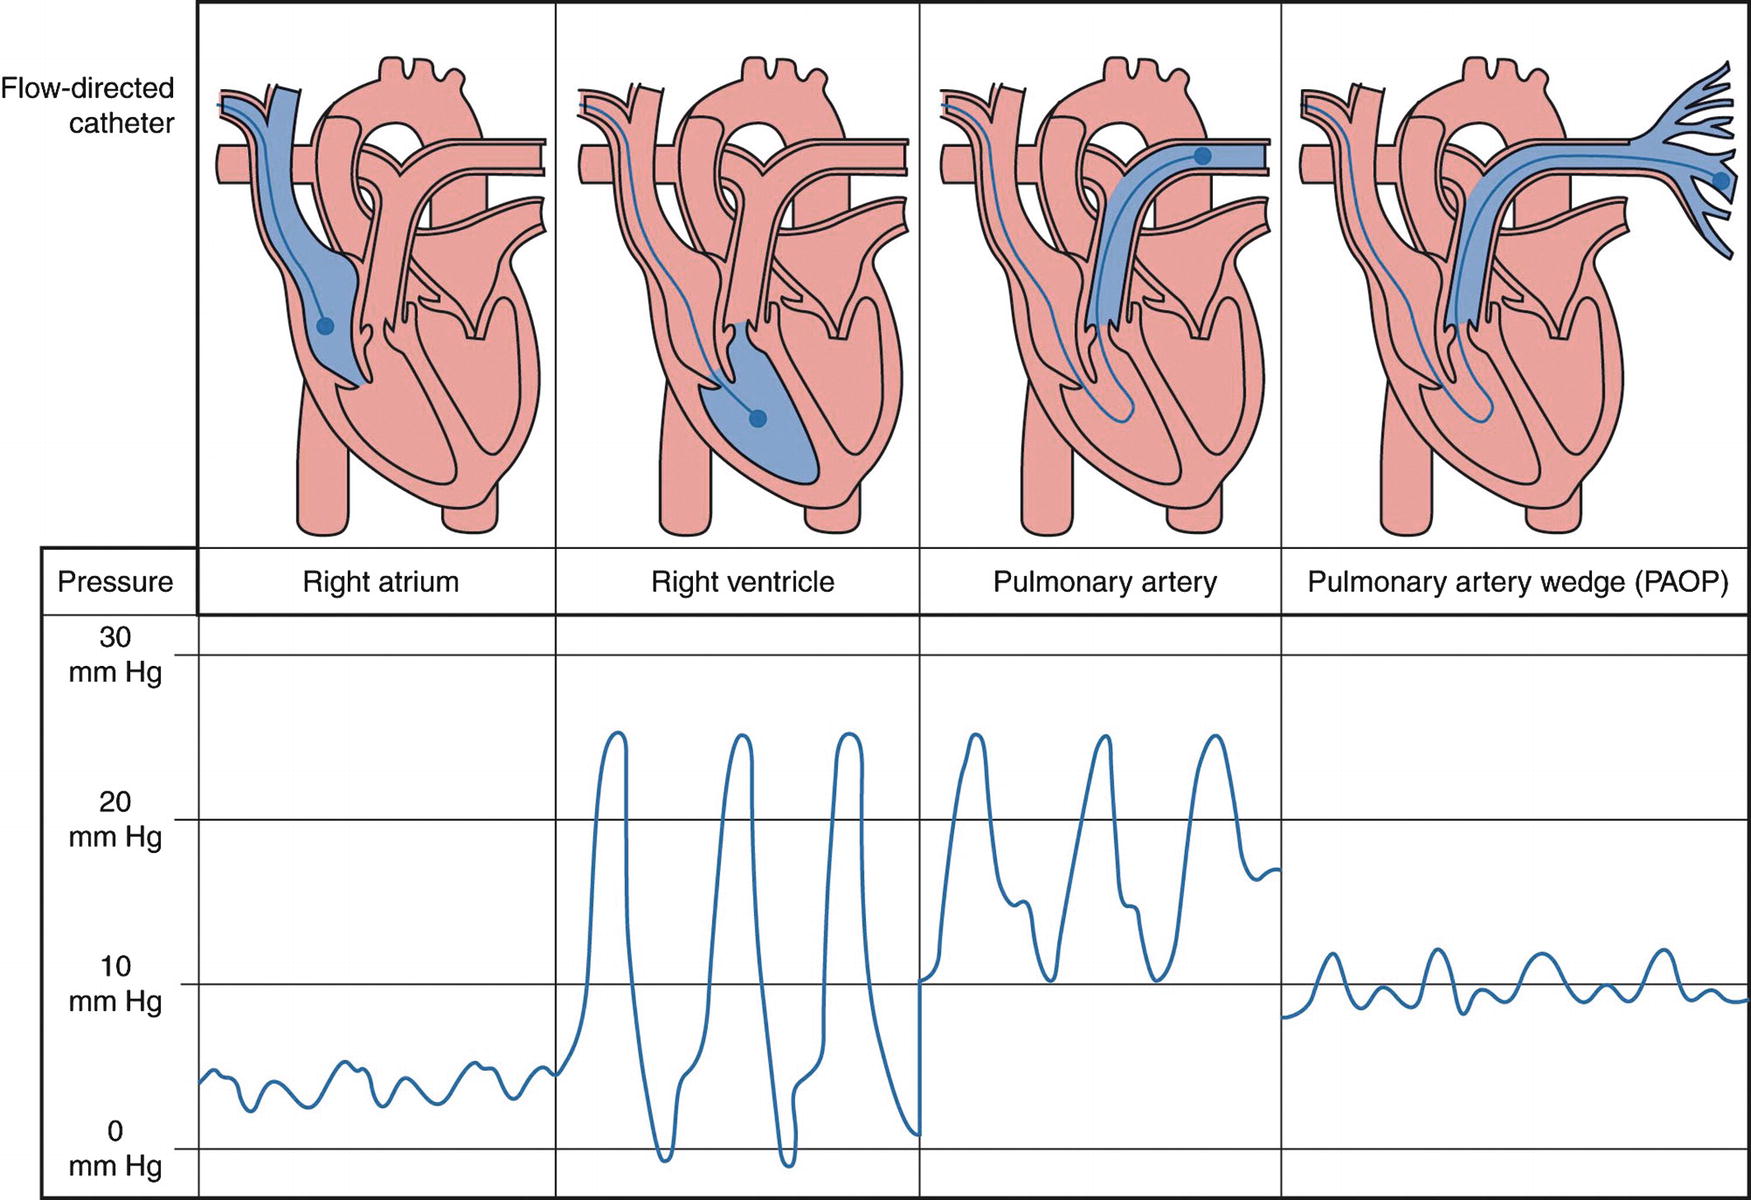
FIGURE 5.13. Pressures in the pulmonary artery catheter during placement.
In addition to the ports for measurement of pressure and infusion of medications, the PAC contains a small thermistor (a temperature-sensitive electrical resistor), which allows for measurement of temperature at the distal tip of the PAC. The thermistor measures core body temperature. This device can also be used to measure heart function, specifically CO, using a process called thermodilution. To perform thermodilution, a known volume of cold or room temperature saline, generally 10 mL, is injected into the patient through the CVP port of the PAC. As this saline moves into the pulmonary artery, it cools the thermistor on the tip of the PAC. By measuring the time between injection of saline and when the temperature measured by the PAC thermistor returns to the patient’s core body temperature, cardiac output can be calculated. The specifics of the calculation are beyond the scope of this discussion. It is worth noting that reliable data depend on a consistent rate of saline injection, volume of saline injected, and position of the PAC in the pulmonary artery; often two or three measures are taken for averaging and precision.
Some manufacturers have included a fiberoptic cable within the catheter, an oximetric PAC, to allow for continuous measurement of mixed venous oxygen saturation (SvO2). The oximetric monitor should be calibrated when connected to the monitoring station and prior to insertion of the PAC within the patient. This can be accomplished without removing the PAC from the sterile packaging. The tip of the catheter is housed in a specialized device specially made to allow for initial calibration of the oximetric monitor to a known reference value, which is a function of the material of the specialized housing. The oximetric monitor can also be calibrated after being placed in the patient; however, this process requires measurement of mixed venous oxygen saturation by blood gas analysis. Continuous measurement of SvO2 allows for monitoring of oxygen utilization by the patient.
Sources for Error
Just as for arterial line and CVP transduction, PA line pressure transducers must be properly zeroed and set to the proper height relative to the patient. They must use appropriate pressure tubing, which is tightly connected, without bubbles or kinks. The oximetric function of the PAC must be calibrated in order to perform SvO2 measurement. Erroneous SvO2 can be confirmed by drawing blood out of the pulmonary artery port and subjecting it to blood gas analysis. Not only will this process reveal an erroneous SvO2 measured by oximetry, it will provide the reference value needed to recalibrate the oximetric monitor in situ. Thermodilution requires consistent technique for accuracy.
Transesophageal Echocardiography
Transesophageal echocardiography (TEE) is commonly deployed by cardiac anesthesiologists to assist in patient management during cardiac surgery. Recently, intraoperative TEE has been more widely deployed when patient comorbidity suggests that direct and continuous monitoring of cardiac function and heart valve integrity would be useful. TEE is described fully in Chapter 42.
Summary
Numerous monitors are devoted to understanding the cardiovascular system. Some are standard anytime general anesthesia or sedation are delivered; these include the pulse oximeter, measurement of noninvasive blood pressure, and ECG. Use of others, such as invasive blood pressure monitoring, CVP monitoring, and the PAC, are more limited in their application. The anesthesia technologist is a key member of the team responsible for deploying these monitors and ensuring their fidelity. In-depth knowledge of how these monitors reflect the physiology of the cardiovascular system will help you understand the principles behind the technologies you use every day, and equip you with the skills necessary to provide optimal support for anesthesia providers and for patients.
Review Questions
1. Select the TRUE statement regarding pulse oximetry.
A) SpO2 is a direct measurement of the oxygen content in arterial blood.
B) The pulse oximeter continuously reports peripheral capillary blood oxygen saturation, heart rate, and heart rhythm regularity.
C) Environmental light in the operating room never interferes with the pulse oximeter because the pulse oximeter only detects light in the infrared region.
D) All of the above statements are true.
Answer: B
SpO2 is related to SaO2, but neither are direct measurements of the oxygen content of arterial blood. Environmental light in the operating room can interfere with pulse oximeters, as infrared light is also present, especially if infrared-guided stereotactic instrumentation is being used.
2. What is the true mean arterial blood pressure if the pressure transducer for arterial blood pressure monitoring is zeroed at the level of the patient’s right atrium when laying supine, then raised 10 cm?
A) 10 mm Hg less than the reported mean arterial blood pressure
B) 10 mm Hg more than the reported mean arterial blood pressure
C) 7.4 mm Hg less than the reported mean arterial blood pressure
D) 7.4 mm Hg more than the reported mean arterial blood pressure
E) Additional information is needed to answer this question
Answer: D
Every 1 cm of height of a column of saline is equivalent to 0.74 mm Hg. A pressure transducer zeroed 10 cm above the patient’s right atrium will underestimate the patient’s blood pressure by 7.4 mm Hg.
3. The pulmonary artery catheter balloon should be DOWN when
A) Withdrawing the balloon from the RV into the RA
B) Advancing the balloon from the RV into the PA
C) Advancing the balloon from the SVC into the RV
D) Wedging the balloon to read the PAWP
Answer: A
The balloon should always be down whenever the catheter is being withdrawn. The balloon should be up when advancing the catheter to permit it to “float” forward in the circulation, and it must be up in order to “wedge” into a distal branch of the PA.
4. Select the TRUE statement.
A) ASA guidelines mandate use of a pulse oximeter, noninvasive blood pressure, and central venous pressure monitoring during delivery of anesthesia.
B) The standard EKG lead setup in the operating room can demonstrate good function of the SA node of the heart.
C) Standard IV tubing can be connected to a pressure transducer and central venous catheter to measure central venous pressure.
D) Automated oscillometric blood pressure cuffs measure the systolic and diastolic blood pressure.
Answer: B
When the SA node is driving the rhythm of the heart, the EKG will display a “P” wave before the QRS. This is usually most clearly seen in lead II of the EKG, which is customarily set up as one of the default leads on the OR monitor. Operating room monitors are ASA guidelines that do not require monitoring of central venous pressure during delivery of anesthesia. Most automated oscillometric blood pressure cuffs measure MAP directly and report a calculated SBP and DBP. Specialized tubing with correct compliance characteristics is needed for use with all types of pressure transducer systems regardless of the absolute pressure of the physiologic system being monitored.
5. Which of the following statements regarding central venous pressure monitoring is TRUE?
A) The “a wave” is generated during contraction of the ventricles.
B) CVP monitoring is necessary for calculation of CO by thermodilution.
C) CVP monitors are properly placed with the tip at the junction between the superior vena cava and the right atrium.
D) CVP reflects fluid status and is the best guide for fluid therapy.
Answer: C
CVP lines are most appropriately placed at the cavoatrial junction. CVP monitoring is one of many pieces of data, but not the only one, integrated into the understanding of a patient’s fluid status. CVP measurement is not necessary for measurement of cardiac output, though it is necessary for calculation of SVR. The “a” wave is generated by contraction of the atrium.
6. Which monitor provides direct information on cardiac output?
A) Pulse oximeter
B) EKG
C) PA catheter
D) Invasive arterial pressure
E) None of the above
Answer: C
The PA catheter permits use of the thermodilution method of measurement of cardiac output. This directly measures flow, by measuring the temperature of cool liquid as it passes the thermistor. Invasive arterial blood pressure provides indirect information on cardiac output with integration of the area under the waveform curve, but this is derived, indirect information that is poorly validated. The pulse oximeter, likewise, provides indirect evidence on tissue perfusion that suggests adequacy or inadequacy of cardiac output. The EKG suggests only a cardiac rhythm that would permit perfusion.
SUGGESTED READINGS
American Society of Anesthesiologists. Standards for Basic Anesthesia Monitoring 2015. Available from: http://www.asahq.org/quality-and-practice-management/practice-guidance-resource-documents/standards-for-basic-anesthetic-monitoring. Accessed October 10, 2017.
Bellomo R, Uchino S. Cardiovascular monitoring tools: use and misuse. Curr Opin Crit Care. 2003;9:225-229.
Casabianca AB, Becker DE. Cardiovascular monitoring: physiological and technical considerations. Anesth Prog. 2009;56:53-59.
Leach RM, Treacher DF. Oxygen transport-2. Tissue hypoxia. BMJ. 1998;317:1370-1373.
McGhee BH, Bridges EJ. Monitoring arterial blood pressure: what you may not know. Crit Care Nurse. 2002;22:60-79.
Pinsky MR. Rationale for cardiovascular monitoring. Curr Opin Crit Care. 2003;9:222-224.
Valdez-Lowe C, Ghareeb SA, Artinian NT. Pulse oximetry in adults. Am J Nurs. 2009;109:52-59.