4
HOW STARS RADIATE
ENERGY (I)
NEIL DEGRASSE TYSON
We now attempt to understand the distances to the stars. We’ve already seen that the distance from the Sun to Earth, 150 million km (or 1 AU), is about 100 times the diameter of the Sun itself. Imagine that we scale the Earth–Sun distance down to 1 meter; the Sun itself is then 1 centimeter across. The nearest stars are about 200,000 AU away, so to scale, that is 200 km. The space between stars is enormous compared to their size. We will find it convenient to refer to these distances not in kilometers or centimeters, but in terms of the time it takes light to traverse them.
The speed of light, which we refer to with the letter c, is 3 × 10⁸ meters/sec, another number worth keeping in mind. In chapter 17, we will see in great detail why this speed represents the cosmic speed limit. It’s as fast as anything can go. Since we observe stars by their light, it provides the most natural distance units. One light-second is the distance that light travels in 1 second: 3 × 10⁸ meters, or 300,000 km—about seven times Earth’s circumference. The Moon is 384,000 km away, and light travels that distance in 1.3 seconds. We say the Moon is about 1.3 light-seconds away. The distance from Earth to the Sun (1 AU) is about 8 light-minutes; taking light about 8 minutes to travel that distance. The nearest stars are about 4 light-years away. A light-year is thus a measure of distance, not of time—the distance light travels in 1 year. One light-year is about 10 trillion km. The light we see today from the nearest stars left them 4 years ago. In the universe, we’re always looking back in time. We are seeing these nearby stars, not as they are at the present moment, but as they were 4 years ago.
This is true in everyday life as well. The speed of light, expressed in other units, is about 1 foot per nanosecond, so two people sitting at a table are seeing each other with a delay of a few nanoseconds. Of course, this is much too small for us to notice, but all our visual contact has a time delay built into it.
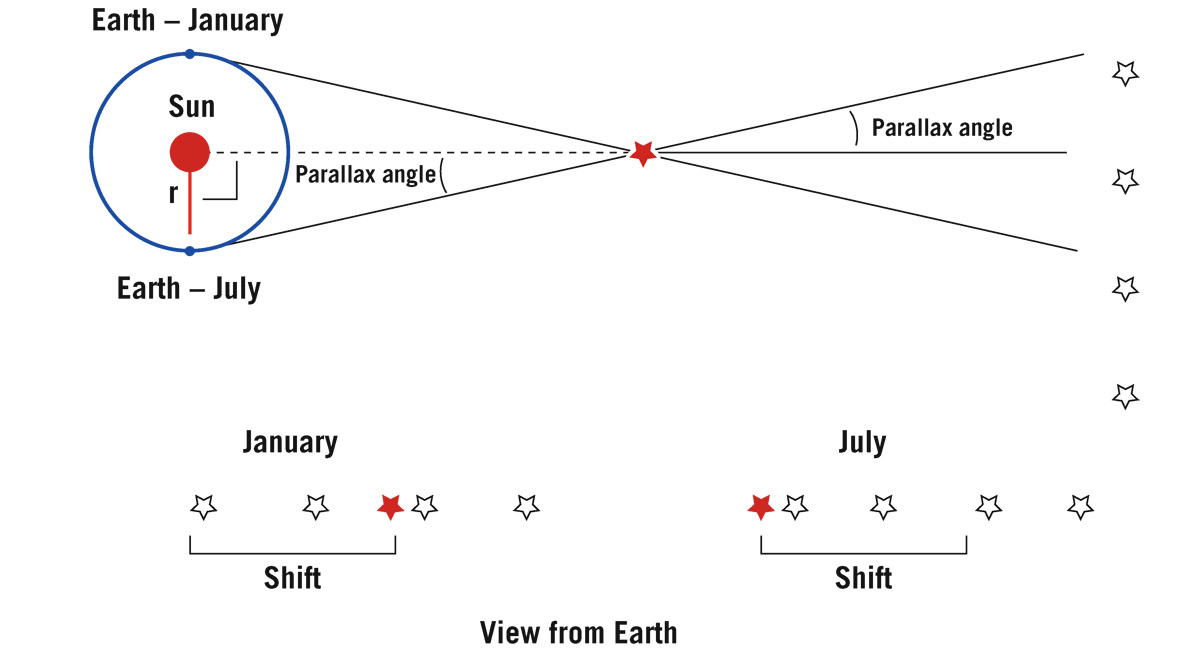
FIGURE 4.1. Parallax. As Earth circles the Sun, a nearby star shifts position in the sky relative to distant stars.
Credit: J. Richard Gott
How can we measure the distances to the nearest stars? Four light-years is enormous. We can’t simply stretch a tape measure between here and a star. In that effort, we need to introduce the concept of parallax. Earth orbits around the Sun (see figure 4.1). Earth is on one side of the Sun in January and 6 months later, in July, Earth is on the other side of the Sun. Toward Earth’s right in the figure there’s a nearby star, and then way out on the right is a field of more distant stars. They’re so far away that I am going to stick all of them way off to the right. Then imagine that I take a picture of the nearby star in January. I am going to see all kinds of stars on that photograph, and one of them will be the star in question (filled in). See the view from Earth in January in figure 4.1. Alone, this picture tells us nothing, of course. Remember, I don’t know which stars are close and which ones are far away—I don’t know anything about this yet. But we wait 6 months, and we take that picture again from the opposite side of Earth’s orbit in July, when Earth has moved to a new position. Now we see all that identical background, but our (filled-in) star has appeared to move from where it once was, to its new location as viewed from Earth in July. It has shifted. Everything else basically stays in the same place. What will happen in another 6 months? It shifts back, from whence it came. That shifting just repeats itself, back and forth, depending on when in the year we observe the star.
Flash the two pictures back and forth, one after the other. If you are flashing them and the two photographs are identical except for one star that moves, then that star is the one that is closer than all the others. If this star were even closer, then this shift on the picture would be bigger. Closer stars “shift” more. I put “shift” in quotes because the star is just sitting there—we are the ones moving back and forth around the Sun; the shift is really due to a change of our perspective.
INSTRUCTIONS FOR SEEING STEREOSCOPIC ART IN THREE DIMENSIONS
Given that we sense depth in the real world when our two eyes see things from slightly different perspectives, we can trick ourselves into seeing a three-dimensional scene even in the flat pages of a book—all we need is to present two images side by side, one as seen by the point of view of the right eye and one as seen by the point of view of the left eye. In this stereo pair (see figure 4.2), the image for the right eye is on the left and the image for the left eye is on the right, so you will be looking at this cross-eyed. It is easier than you think. Hold the book with one hand about 15 inches in front of your eyes. Hold the index finger of your other hand straight up about half-way between your eyes and the page. Look at the page. You will also see two blurry transparent images of your finger (one as seen by the right eye and one seen by the left eye). Move your finger back and forth until these two transparent images of your finger are perfectly centered at the bottom of each image on the page. You might have to tilt your head left or right to get the two images of your finger level with each other. Now focus your attention on your finger. You should see one image of your finger and three blurry versions of the pictures on the page. Carefully shift your attention to the middle picture, without uncrossing your eyes. It should come into focus as a beautiful 3D image, with the bright foreground star Vega jumping right off the page in front of the other stars! You can see that different stars are at different distances. Your brain is automatically measuring the shifts and doing the parallax calculation. This, of course, is how we generate 3D vision. Our brain is constantly comparing the views from our two eyes and doing parallax calculations to determine the distances to the objects we see. Alternatively, start by just looking at your finger—your eyes will naturally cross to look at it. Behind it will appear the three blurry images, Shift your gaze to the center one, and it will appear in 3D. Keep trying—it takes a bit of practice. Not everyone can see it, but if you can, it is a spectacular effect, and worth the effort to master. We will use this technique later in the book once again in figure 18.1.
You can demonstrate this for yourself. Close your left eye and hold your thumb out at arm’s length. Line your thumb up with an object in the distance using your right eye only. Now wink to the other eye. What happens? Your thumb appears to move. Now take your thumb and position it only half an arm’s length from your eyes and repeat that exercise. Your thumb shifts even more. People discovered this effect and realized that it works for stars: the nearby star is your thumb, and the diameter of Earth’s orbit is the separation of your two eyes. Obviously, if you use your own eyes to try to measure the distance to a star, it will not be effective, because the couple of inches between your eyeballs is not enough to get nicely different angles on the star. But the diameter of Earth’s orbit is 300 million kilometers. That’s a nice broad distance for winking at the universe and deriving a measure of how close a star is to you.
In figure 4.2 we have a simulation of this showing the constellation Lyra. The stars in the two pictures have been shifted proportional to their observed parallax as if representing two photos taken at two times 6 months apart in Earth’s orbit. We have just exaggerated the amount of the shift so that you can see it easily.
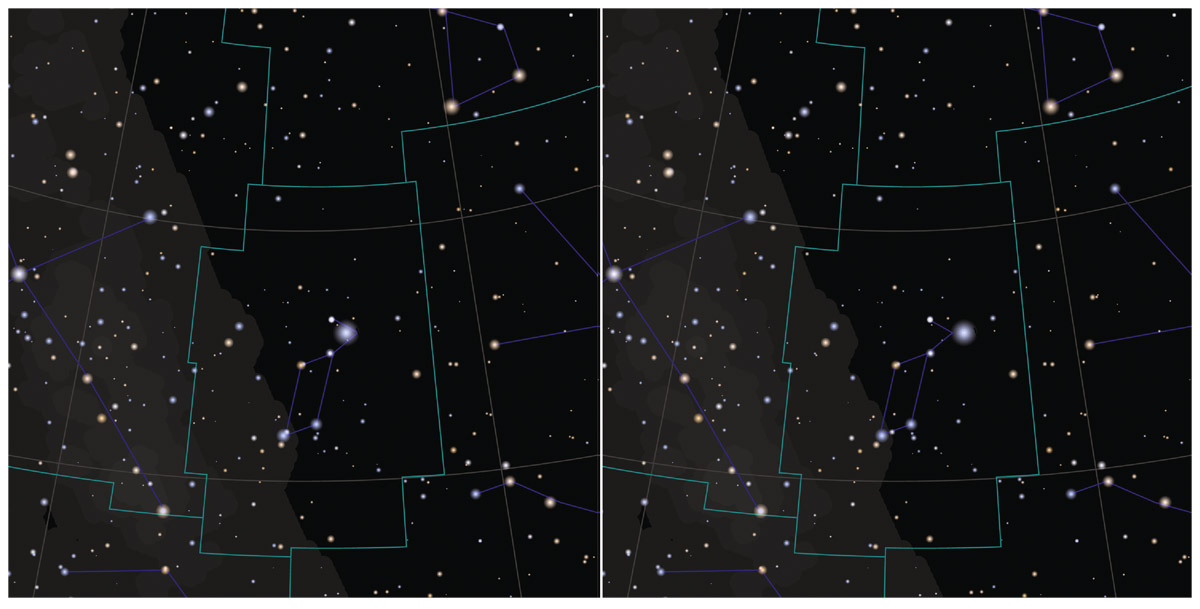
FIGURE 4.2. Parallax of Vega. Two simulated pictures of the constellation Lyra as if taken 6 months apart from Earth as it circles the Sun. Each of the stars in the picture has a parallax shift inversely proportional to its distance. (The parallax shifts have been exaggerated by a large factor to make them visible.) Vega (the brightest star in Lyra), a foreground star only 25 light-years away, shifts the most. You can see Vega’s parallax shift by comparing its position in the two images. You can also see this as a 3D image that jumps off the page by following instructions in the text to view the two pictures as a cross-eyed stereo pair. Photo credit: Robert J. Vanderbei and J. Richard Gott
The brightest star in the picture, Vega, is only 25 light-years away. It is much closer than its fellow stars in the constellation of Lyra in the center. If you compare the two pictures carefully, looking for differences, you will see that Vega has shifted more than the other stars.
The farther away a star is, the smaller the shift becomes. But for many relatively nearby stars, we can measure their distances using this technique. To do this, we need to apply a few basic facts of geometry. In figure 4.1, we saw the nearby star in front of one set of stars in January and then we saw the star shift in front of other stars in July. By convention, half of this shift is called the parallax angle, corresponding to the shift you would see if you moved only 1 AU instead of 2 AU. We know the radius of Earth’s orbit (1 AU) in kilometers. We can measure the parallax angle. Consider the triangle formed by Earth the Sun, and the star. It is a right triangle with its 90° angle at the Sun. The shift in angle you observe during the year when looking at the nearby star is exactly the same shift that an observer sitting on that nearby star would see, looking back at you along the same two lines of sight. That means that the parallax angle (half the total shift) you observe will be equal to the angle between the Sun and Earth (in July) as seen by an observer on the star (see figure 4.1 again). Thus, the Earth–Sun–Star triangle has a 90° angle (at the Sun), an angle equal to the parallax angle (at the star), and angle (at Earth) of 90° minus the parallax angle; this is true because, according to Euclidean geometry, the sum of angles in a triangle must equal 180°.
You know one leg of the triangle (the Earth–Sun distance), and if you know the angles in the triangle, you can determine the length of the leg of the triangle connecting the Sun and the star. That gives you a direct measure of the star’s distance. Let’s invent a new unit of distance. Let’s designate a distance such that a star at that distance would have a parallax angle of 1 arc second. One arc second is of course 1/60 of a minute of arc, which is itself 1/60 of a degree. An arc second is 1/3,600 of a degree. There exists a distance a star can have where the parallax angle is 1 arc second. That distance is called 1 parsec. Is that name cool or what? A parallax angle of 1 second of arc is 1/(360 × 60 × 60) of the circumference of a circle. If the star is at a distance d, the circumference of that circle is C = 2πd. The Earth–Sun distance r = 1 AU subtends 1/(360 × 60 × 60) of that circumference, making 1 AU/2πd = 1/(360 × 60 × 60). Therefore, for a parallax of 1 second of arc, d = 206,265 AU = 1 parsec. It’s all just Euclidean geometry.
If you watch Star Trek, you hear them use this unit of distance. What distance is that in light-years? It’s 3.26 light-years. The unit of parsec is cute and fun to say, but in this book we mostly stick to light-years. In case you ever encounter this term parsec, now you know where it comes from. Astronomers coined the word by combining those two other terms, parallax and arc second. A star that has a parallax of ½ arc second is 2 parsecs away. A star that has a parallax of 1/10 of an arc second is 10 parsecs away. Easy. We have several made-up terms in astronomy that get a lot of mileage—quasar, for instance. It comes from quasi-stellar radio source. Pulsar is from pulsating star—we made that one up, and people love it. There is a Pulsar watch.
What is the star nearest to Earth? The Sun. If you said Alpha Centauri, I tricked you. The star system nearest to the Sun is Alpha Centauri. Alpha says it’s the brightest star of its constellation, the southern constellation Centaurus, but it’s actually a three-star system, one of whose stars is closest to our solar system. A triple star system—very cool. There is Alpha Centauri A, a solar-type star, 123% the diameter of the Sun; Alpha Centauri B, 86.5% the diameter of the Sun; and Proxima Centauri, a dim red star, only 14% the diameter of the Sun. Of these 3 stars, the one closest to our Sun is Proxima Centauri. That’s why we call it Proxima. Its distance from us is about 4.1 light-years, giving a parallax of 0.8 arc seconds.
One arc second is really, really small. For most images you will ever see of the night sky taken from professional telescopes on Earth, the apparent size of a star on the image is typically one arc second. That’s typical for ground-based telescopes. The Hubble Space Telescope does ten times better than that. The atmosphere wreaks havoc and blurs the images when we use telescopes here on Earth. Starlight comes in as a sharp point of light, minding its own business, and then it hits the atmosphere, gets bounced and jiggled and smeared, and finally ends up being this blob. On Earth we say, “Oh, isn’t that pretty? The star is twinkling!” But twinkling is nasty to an astronomer trying to observe the star, and one arc second is a typical width of that twinkling image.
Notice that one parsec is less than the distance to the nearest star. That’s why it took thousands of years for the parallax to be measured. Not until 1838 did the German mathematician Friedrich Bessel measure our first stellar parallax. (If the atmosphere smears an image to a width of 1 second of arc, an observer looking through a telescope had to take many measurements to achieve an accuracy below 1 arc second.) In fact, arguments put forth by Aristarchus more than 2,000 years ago to say that Earth was in orbit around the Sun were squashed by the lack of observed parallax at that time. The Greeks were smart folks. “Okay,” they said, “you don’t like our geocentric universe with the Sun going around Earth? You want Earth to go around the Sun?” They knew that, if Earth indeed went around the Sun, you would have a different angle for viewing close stars when Earth was on one side of the Sun compared with the other. They said we ought to be able to see this parallax effect. Telescopes weren’t invented yet, so they just looked very carefully, and kept on looking. No matter how hard they squinted, they couldn’t find any difference. In fact, because this effect couldn’t be measured without telescopes, they used it as potent evidence against the Sun-centered, heliocentric universe. But absence of evidence isn’t always the same as evidence of absence.
Even after watching all those stars in the nighttime sky, and noticing that fuzzy nebulous objects lurked among them, we had no real sense of the universe until the early decades of the twentieth century. That’s when we obtained data by passing starlight through a prism and looked at the resulting features. From there we learned that some stars can be used as “standard candles.” Think about it. If every star in the night sky were exactly the same—if they were cut out with some cookie cutter, and flung into the universe—the dim ones would always be farther away than the bright ones. Then it would be simple. All the bright stars would be close. Dim stars would be far. But it’s just not the case. Among this zoo of stars, no matter where we find them, we search for and find stars of the same kind. So, if a star has some peculiar feature in its spectrum, and if a star of that same variety is close enough to observe its parallax, it’s a happy day. We can now calibrate the star’s luminosity and use it to find out whether other stars like it are one-fourth as bright or one-ninth as bright, and then we can calculate how far away they are. But we need that standard candle, that yardstick. And we didn’t have such yardsticks until the 1920s. Until then we were pretty ignorant about how far away things are in the universe. In fact, books from that period describe the universe as simply the extent of the stars, with no knowledge or account of a larger universe beyond.
When trying to understand stars, you need some additional mathematical tools for your utility belt. One tool is going to be distribution functions. They are powerful and useful mathematical ideas. I want to ease into them, so let’s introduce a simple version of a distribution function, something that USA Today might refer to as a bar chart, since they’re big on charts and graphs. For example, we could plot the number of people in a typical college classroom as a function of age (figure 4.3).
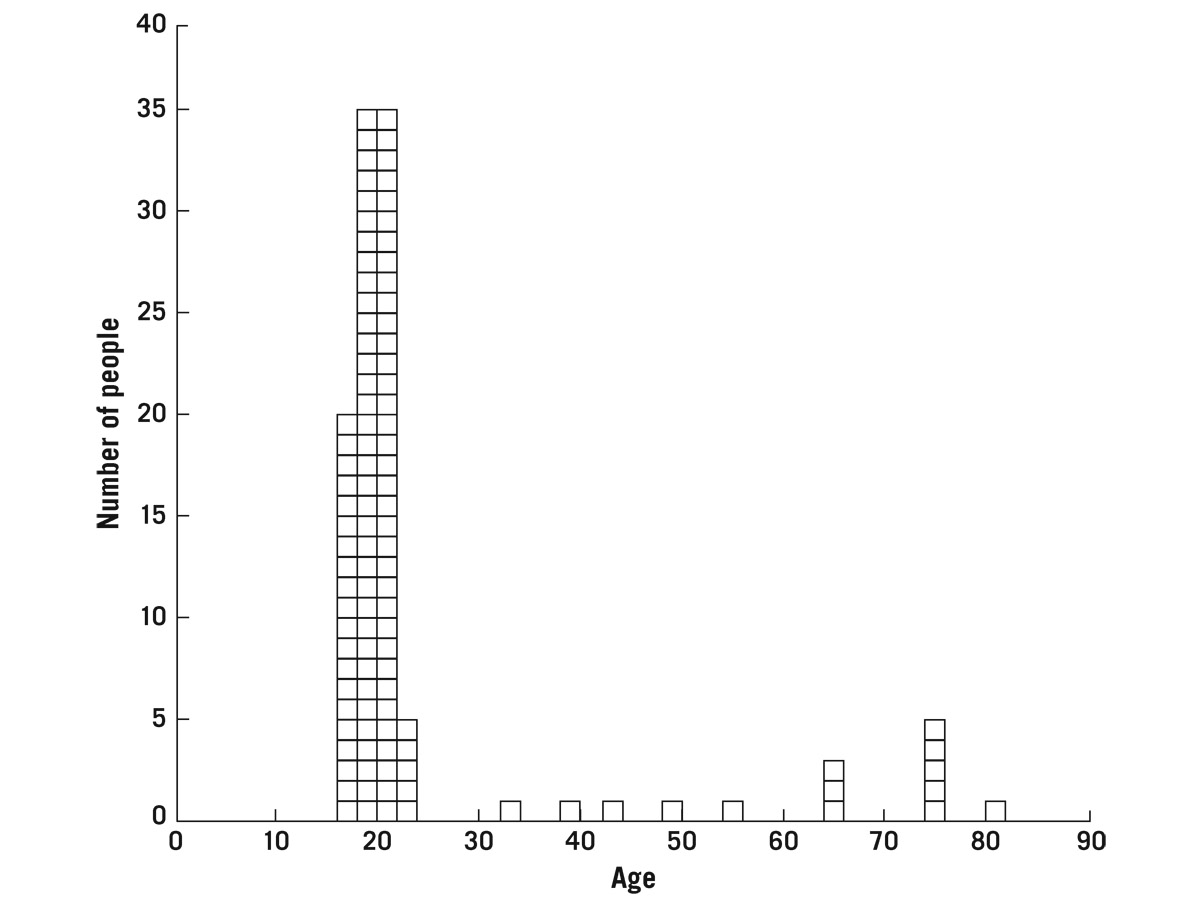
FIGURE 4.3. Bar chart of ages in a class.
Credit: J. Richard Gott
To make such a chart, one would start by asking the people in the class if anyone was 16 years old or younger. If no one answered, the chart would get a value of zero for those ages. Next, one would ask how many are 17–18 years old. Let’s say 20 people. Make the bar for 17–18 years exactly 20 units tall. And 19–20 years old? Thirty-five people. Keep going until all the people have been tallied.
Let’s take a step back and look at figure 4.3. There are things it can tell us about the distribution of people in this typical class. For example, most people cluster around age 20, which tells anyone looking at this chart that it’s probably a college class. Then there is a gap and a few stragglers and another bump in the mid-70s—we have two bumps, two modes. We would call this a bimodal distribution. Most individuals in this older group are not actually undergraduate students; they are probably auditors in the class, and because people who audit daytime college classes are not those who have to work 9 to 5 to pay the rent, they’re probably retired. You can gain insight into a population just by looking at this distribution. If we did this for the students in an entire college campus, then we would probably fill in some of the empty spots, but I bet it would take pretty much this same shape: mostly undergraduates, some older people, and occasionally you will find that precocious 14-year-old—maybe one in a thousand—because every freshman class seems to have one. This bar chart has bins 2 years wide. If I could increase the sample size enough, to include all college students in the country, I could make each bin only 1 day wide. I could collect so much data that I could fill this chart in and it would not be so jagged. With that much data, my bins would be so narrow that I could step back and put a smooth curve on it. If you go from a bar chart to a smooth curve and you can represent this with some mathematical form, your bar chart has become a distribution function.
What is the total number of people in the class? That’s easy—just step along the scale and add up the numbers. In this case, we get 109. If you have smooth functions, you can use integral calculus to add up the area under the curve and give you the total number of things represented in it. Isaac Newton invented differential and integral calculus by the time he was 26—and was in my opinion the smartest person ever to walk the face of Earth!
How does this apply to stars? Let’s look at the Sun. I’m going to say, “Sun, tell me something. I want to know how many particles of light you are emitting.” Isaac Newton also came up with the idea of corpuscles of light—particles—long before Einstein, I might add. I have a word for these particles, photons—not protons, but photons. Pho- as in photograph, as in “photon torpedoes.” Trekkies know that term.
Photons come in all flavors. Isaac Newton took white light and passed it through a prism. He listed the colors of the rainbow he saw: red, orange, yellow, green, blue, indigo (a big dye color back in Newton’s day, so he included it in the spectrum), and violet. Today we typically mention only six colors in the rainbow. But as an hommage to Isaac, I usually include indigo, plus you get to spell out “Roy G Biv”—a good way to remember the rainbow colors.
The English astronomer William Herschel discovered that another whole other branch of the spectrum—something today we call infrared, which our eyes are not sensitive to. On the scale of energy it falls “below” red. Herschel passed sunlight through a prism and noticed that a thermometer placed off the red end of the visible spectrum got hot. Off the other side of the visible spectrum, you can also go beyond violet to get ultraviolet, or UV. You’ve heard of these bands of light before, because they show up in everyday life. UV radiation gives you a suntan or a sunburn; infrared heaters in a restaurant keep your French fries warm until you buy them.
The spectrum is therefore much richer than what shows up in the visible part. Further beyond ultraviolet, we have X-rays. There are X-ray photons. Beyond X-rays, we have gamma rays. You’ve heard of all of these. Let’s go the other way, toward the infrared. Below infrared? Microwaves. Below them? Radio waves. Microwaves used to be considered a subset of radio waves, but now they’re treated as a separate part of the spectrum in their own right. These are all the parts of the spectrum for which we have words. There is nothing beyond gamma rays—we just continue to call them gamma rays—and nothing beyond radio waves.
A photon is a particle. We can also think of it as being a wave, a wave–particle duality. Well, you say, which is it? Is it a wave or a particle? That question has no meaning. We should instead be asking ourselves why our brains can’t wrap themselves around something that has a dual reality inherent in it. That’s the problem. We could make up a word such as “wavicle.” This term was introduced some time ago, but it never caught on because people still want to know which it is. The answer depends on how you measure it. We can think of it as a wave, and waves have wavelengths. Except we don’t use L to denote the length of the wave; we use the Greek letter that has the same sound as the L, lambda. We use lowercased lambda, which looks like this: λ, the preferred symbol for wavelength.
How big are radio waves? Think about them this way: in the old days, if you wanted to change the channel on your TV, you had to get off the couch, walk up to it, and turn a knob. This was so long ago. That same TV had a “rabbit-ear” antenna on it—two extendable wires that went up like a V—if the reception didn’t come in right, you moved the two wires of the antenna. These antennas had a certain length to them, about a meter. In fact, TV waves are about a meter in wavelength. The antennas received TV waves from the air. That’s why when you go to a TV studio, there is a sign that says “On the Air,” because it’s broadcasting through the air to your house. Of course, much of it now comes via cable, but the sign today doesn’t say “On the Cable.” And in any case, light (including radio waves) passes through the vacuum of space with no trouble. So the air is irrelevant, which always left me wanting to change the “On the Air” signs to “On the Space.”
How about mobile phones? How big are their antennas? Quite small. They use microwaves, which are only a centimeter in length. Nowadays, the antenna is built into the phone itself, but in the old days, you would extend a short, stubby antenna every time you used your mobile phone.
How big are the holes on the screen of your microwave oven? They have holes so you can see the food cooking inside. Maybe you didn’t notice, but these holes are only a couple of millimeters across. That’s smaller than the actual wavelength of the microwaves that heat your food. So the 1-centimeter microwave trying to get out of the oven sees a hole only a couple of millimeters wide, and it can’t get out. It can’t find any exit from the microwave oven. Do you know who else uses microwaves? Police do when they point a radar beam at drivers to measure their speed. Microwaves reflect off the metal of your car. Here’s one way to thwart that: you know those black canvas bug protectors that some people, usually guys with sports cars, put over the front end of their cars? They absorb microwaves very well, so if you beam microwaves at it, the signal that returns to the police radar gun is so weak that usually you can’t get a reading back. Of course a car’s windshield is transparent to microwaves. How do you know microwaves pass through glass? Where do people put their radar detector? Typically, inside the car on the dashboard. So obviously, microwaves pass through the glass. In the same way, you can cook food in a glass container in a microwave oven, because microwaves pass through unobstructed. Police use something called the Doppler shift to get your speed, which we’ll be discussing a bit later. For now, you just need to know that in this case, it’s a measure of the change in the wavelength of a signal reflected off a moving body. You get the most accurate reading if you take the measurement in the exact path of the object in motion. In practice, radar gun detectors do not measure the correct speed for your car, because to do so, the police officer would have to stand in the middle of the traffic lane, which they don’t tend to do. Instead, they stand to the side, which means the speed they get is always less (unfortunately) than your actual speed. So if they catch you speeding you have no argument. Just pay your ticket and move on.
The police radar gun sends a signal that reflects off your car. Imagine you are looking at your own reflection in a mirror that is 10 feet away, and the mirror is moving toward you at 1 foot per second. Your reflected image starts out 20 feet away from you (the light goes out 10 feet and back 10). But one second later, the mirror is only 9 feet from you and you see your reflected image only 18 feet away. You see your reflected image rushing toward you at 2 feet per second. Likewise, the policeman is observing the reflection of his own radar gun rushing toward him at twice your speed. Try explaining that to the judge! Of course, radar guns are calibrated to report half the Doppler shift they measure—to properly report the velocity of the mirror—your car. By the way, radar is an acronym of “radio detection and ranging,” from back when microwaves were considered part of the radio wave family.
Since we’re talking about microwaves, as it happens, the water molecule, H2O, is very responsive to microwaves; the microwaves in your microwave oven flip the molecule back and forth at the frequency of the wave itself. If you have a bunch of water molecules, they will all do it. Billions of trillions of them. Before long, the water gets hot because of the friction between the molecules as they undergo these flips. Anything you put in a microwave oven that has water in it will get hot. Everything you eat other than salt has water in it. That’s why microwave ovens are so effective at cooking your food, and why it doesn’t heat your glass plate if you don’t have food on it.
The human body reacts to infrared radiation. Your skin absorbs it, creating heat, and you feel warm. Visible light we know well. Depending on what shade of skin color you have, you will be more or less sensitive to ultraviolet light. It can damage the lower layers of your skin and give you skin cancer. Ozone in the atmosphere protects us from most of the Sun’s ultraviolet rays. The oxygen in the air is in molecular form: O2 plus some ozone O3 (molecules composed of two and three oxygen atoms, respectively). Ozone lives in the upper atmosphere and is just waiting to break apart. In comes an ultraviolet photon, which gets absorbed, breaking the ozone apart. The ultraviolet light is gone—it just got eaten by the ozone. If you take away the ozone, there will be nothing to consume the ultraviolet, and it will come straight down, sending skin cancer incidence up. Mars has no ozone, so the surface of Mars is constantly bathed by ultraviolet light from the Sun. That’s why we suspect, and I think correctly, that Mars has no life on its surface today, even if there may be life below the surface. Anything biological exposed to that much ultraviolet radiation would have decomposed.
Almost everyone has been X-rayed. Can you remember what the X-ray technician does before he or she turns the switch to expose you? The technician lays you out and says, “okay, hold still,” and then goes outside, behind some lead shielding, closes the door, and then turns the switch. Your technician doesn’t want X-ray exposure. You should take a hint that what’s about to happen is not good for you. But usually, not taking the X-rays is worse than taking them if you need the X-rays for a diagnosis—if your arm is broken the X-ray image can tell you. X-rays penetrate much deeper than your skin; they can trigger cancerous growths in your internal organs. But if the X-ray dose you receive is low, the risk is small.
Gamma rays are worse. They go right to your DNA and can mess you up. Even comic books know that gamma rays are bad for you. Remember the Incredible Hulk? How did he become the Hulk? What happened to him? Wasn’t he doing some experiment that exposed him to a high dose of gamma rays? And now when he gets angry, he gets big, ugly, and green. So watch out for gamma rays—we don’t want that happening to you. As you move along the spectrum to shorter wavelengths, from UV to X-rays to gamma rays, the energy contained in each photon goes up, and its capacity to do damage increases.
In modern times, radio waves are all around us. All the time. And there’s a simple experiment you can do to prove it. Turn on a radio, and tune into a station. Any station, at any time. They are all around you, constantly broadcasting. How do you know you are constantly bathed in microwaves—all the time? Your mobile phone can ring anytime while you are just sitting there. Presuming you never crawl into the high-intensity field of a microwave oven, microwaves are harmless compared to what is going on at the high-energy part of the spectrum.
All these photons travel at one speed through empty space. The speed of light. It’s not just a good idea—it’s the law. Visible light, as we have defined it, sits in the middle part of the electromagnetic spectrum, but it is all light, traveling at 300,000 km/sec (299,792,458 meters/sec, to be exact). It’s one of the most important constants of nature that we know.
The photons of all bands of light move at the same speed, yet they have different wavelengths. As I stand watching them pass, their frequency is defined as the number of wave crests that go by per second. If the waves are of shorter wavelength, many more crests will go by in a second. So high frequency corresponds to short wavelengths, and conversely, low frequencies correspond to longer wavelengths. It’s a perfect situation for an equation: the speed of light (c) equals frequency times wavelength (λ). For frequency, we use the Greek letter nu: ν. Our equation becomes
Suppose we had radio waves with a wavelength of 1 meter. The speed of light is approximately 300,000,000 meters/sec, which is equal to ν times 1 meter, making the frequency 300,000,000 crests or (cycles) per second (or 300 megacycles).
In fact, frequency and the energy in a photon are bound in an equation, too. The energy E of a photon is equal to hν:
E = hν.
Einstein discovered this equation. The equation uses Planck’s constant h, named for the German physicist Max Planck. It serves as a proportionality constant in the equation, telling us how the frequency and energy of a photon are related. The higher its frequency is, the higher the energy of an individual photon will be. While X-ray photons pack a large punch, radio wave photons each carry only a tiny amount of energy.
Time to query the Sun. How many photons of each of these wavelengths are you giving me? How many green photons are coming from your surface, how many red ones, how many infrared, microwave, radio wave, and gamma ray photons? I want to know. So many photons emerge from the Sun that I can do much better than a simple bar chart, because I am flooded with data. I can make a smooth curve, and when I do, I will plot intensity versus wavelength. In this case, intensity, plotted vertically, represents the number of photons per second coming out of the Sun per square meter of the Sun’s surface, per unit wavelength interval, at the wavelength of interest, times the energy each photon carries. We could have just counted photons, but in the end, we’re typically interested in the energy they carry. This vertical axis gives us the power (energy per unit time) emerging from the Sun’s surface per unit area per unit wavelength. Horizontally, I have wavelength increasing to the right. So let’s put in X-rays, UV, visible (the rainbow-colored band), infrared (IR), and microwaves (labeled μwave). Figure 4.4 shows the distribution function of intensity from the Sun.
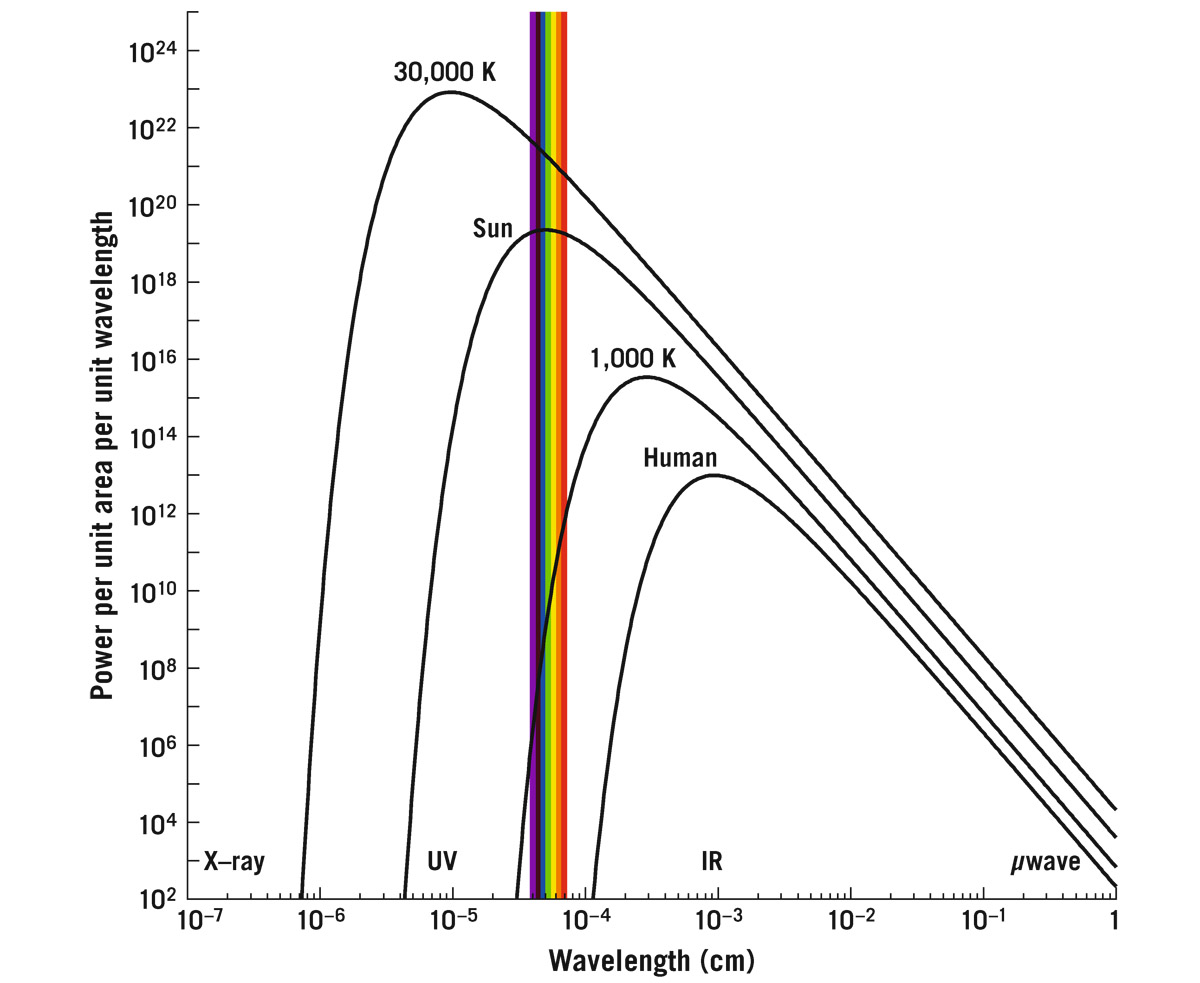
FIGURE 4.4. Radiation from stars and humans. The vertical coordinate plots energy per unit time (i.e., power) emitted by various objects per unit wavelength per unit surface area. The horizontal coordinate is wavelength. We show a 30,000 K star, the Sun (5,800 K), a 1,000 K brown dwarf star, and a human (310 K). Wavelengths corresponding to X-rays, UV, visible light (rainbow-colored bar), infrared, and microwaves (μwaves) are shown.
Photo credit: Michael A. Strauss
The hot Sun emits radiation at a temperature of about 5,800 K. The distribution was figured out by Max Planck. It peaks in the visible part of the spectrum, and that’s no accident—our eyes have evolved to detect the maximum amount of sunlight out there. To compare with other stars, let’s pick an average square meter to use as an example. The actual size of the patch doesn’t matter, as long as we use the same size patch from one example to the next. Sometimes people say we have a yellow Sun, but it’s not yellow. If you want to call it yellow because it peaks near yellow, you could justifiably argue that it peaks at green, but no one says we have a green star. Besides the yellow, you must add in as much violet, indigo, blue, green, and red light as the curve shows the Sun is emitting. Add them all together, and you have about equal amounts of every one of these colors. Think back to Isaac Newton. What is this? White light. If you pass equal amounts of the colors of the visible spectrum back through a prism, what will emerge is white light. Newton actually did this experiment. Therefore, the Sun, radiating roughly equal amounts of all these colors, gives us white light. No matter how the Sun is drawn in a textbook, no matter what people in the street tell you, we have a white star—it’s just that simple. By the way, if the Sun were truly yellow, then white surfaces would look yellow in full sunshine, and snow would look yellow (whether or not you were near a fire hydrant).
The Sun’s surface temperature is about 5,800 K. Temperature on the Kelvin scale (K) is Celsius (C) plus 273. Ice freezes at 0° C (or 273 K). Water boils at 100° C (or 373 K). Celsius and K values are separated by only 273, and as we get to higher and higher temperatures, tracking that difference becomes less and less meaningful. In any case, 5,800 K is very hot. It will vaporize you. And to round things out, 0 K (you may have heard it called absolute zero) is the coldest possible temperature. Molecular motion stops at 0 K.
Let’s find another star. Here is a “cool” one that checks in at a mere 1,000 K (see figure 4.4). Where does the 1,000 K star peak? In the infrared. Can your eyes see infrared? No. Is this star invisible? No. A small part of the star’s radiation emerges in the visible spectrum. The intensity is falling sharply in the visible part of the spectrum as one goes from red to blue—it is emitting much more red light than blue light. This star will look red to our eyes. Now let’s look at a star with a temperature of 30,000 K. As a reminder, I am asking the same kind of questions about its light distribution that we asked about the age distribution for students in a college class. Where does that star peak? In the ultraviolet. It gives off more UV than any other kind of light. We can’t see ultraviolet, but can you see this star? Of course you can. It’s got a lot of energy coming out in the visible part of the spectrum, too, with more energy emerging in the visible part of the spectrum per square meter of its surface than the Sun emits. Unlike the Sun, however, its mixture of colors isn’t equal, but rather it’s tipped toward the blue. If I add its colors together, I will get blue. Blue hot is in fact the hottest of hots. All astrophysicists know that the coolest glowing temperature is red, and the hottest glowing temperature is blue. If romance novels were astrophysically accurate they would describe “Blue-Hot Lovers,” not “Red-Hot Lovers.”
Our 30,000 K star peaks in the UV. If I picked an even hotter star, its color would also be blue. A blue color just means that the blue receptors in your eye are getting more radiation than your green or red receptors. A 30,000 K star is blue, a 5,800 K star is white, and a 1,000 K star is red.
How about the human body? What temperature are you? Unless you have a fever, you are 98.6° F, or about 310 K. The spectrum of your emission peaks in the infrared. How much visible light do you give off normally? You can see other people with your eyes, only because they reflect visible light. But if you turn off all the lights in a room, everything goes black. You can’t see the people. You’ll notice that if the lights are off, the curve for 310 K tells us that humans give off virtually no radiation in the visible. But they, being at a temperature of 310 K, are still emitting infrared light. Bring out an infrared camera, or infrared night goggles, and you can see the people, radiating strongly in the infrared. We put the whole universe on such a chart in the next chapter.