1
The Opportunity
1.1 Introduction
Data awareness has swept across economic, political, occupational, social and personal life. Making sense of the fabulous opportunities afforded by such an abundance of data is the challenge of every business and each individual. The journey starts with understanding what data is, where it comes from, what insight it can give and how to extract it. These activities are sometimes referred to as descriptive analytics and predictive analytics. In descriptive analytics data is explored by looking at summary statistics and graphics, and the results are highly accessible and informative. Predictive analytics takes the analysis further and involves statistical approaches that utilise the full richness of the data and lead to predictive models to aid decision making.
This introductory chapter discusses the rise in data, changes in attitude to data and the advantages of getting to grips with accessing, analysing and utilising data. Definitions of concepts such as open data and big data are followed by guidance for reading the rest of the book.
1.2 The Rise of Data
There is much more data available and accessible than ever before.
Increasingly data is discussed in the popular press and, rather than shying away from figures, statistics and mathematics, advertisers are using these words more and more often. People are becoming more comfortable with data. This is clear from the increase in the use of self‐measurement and mapping facilities on personal devices such as mobile phones and tablets; people have a thirst for measuring everything in their daily life and like to try and control things to keep their life in good shape. Many people choose vehicles that are fitted with advanced digital measurement devices that manage engine performance and record fuel usage and location. All this is in addition to the increased automation of production lines and machinery, which have resulted in copious measurements being a familiar concept. A major contributor to the rise in importance of data is the impact of cheap data storage. For example, an external hard drive with terabytes of memory can be bought for the price of a visit to the hairdresser.
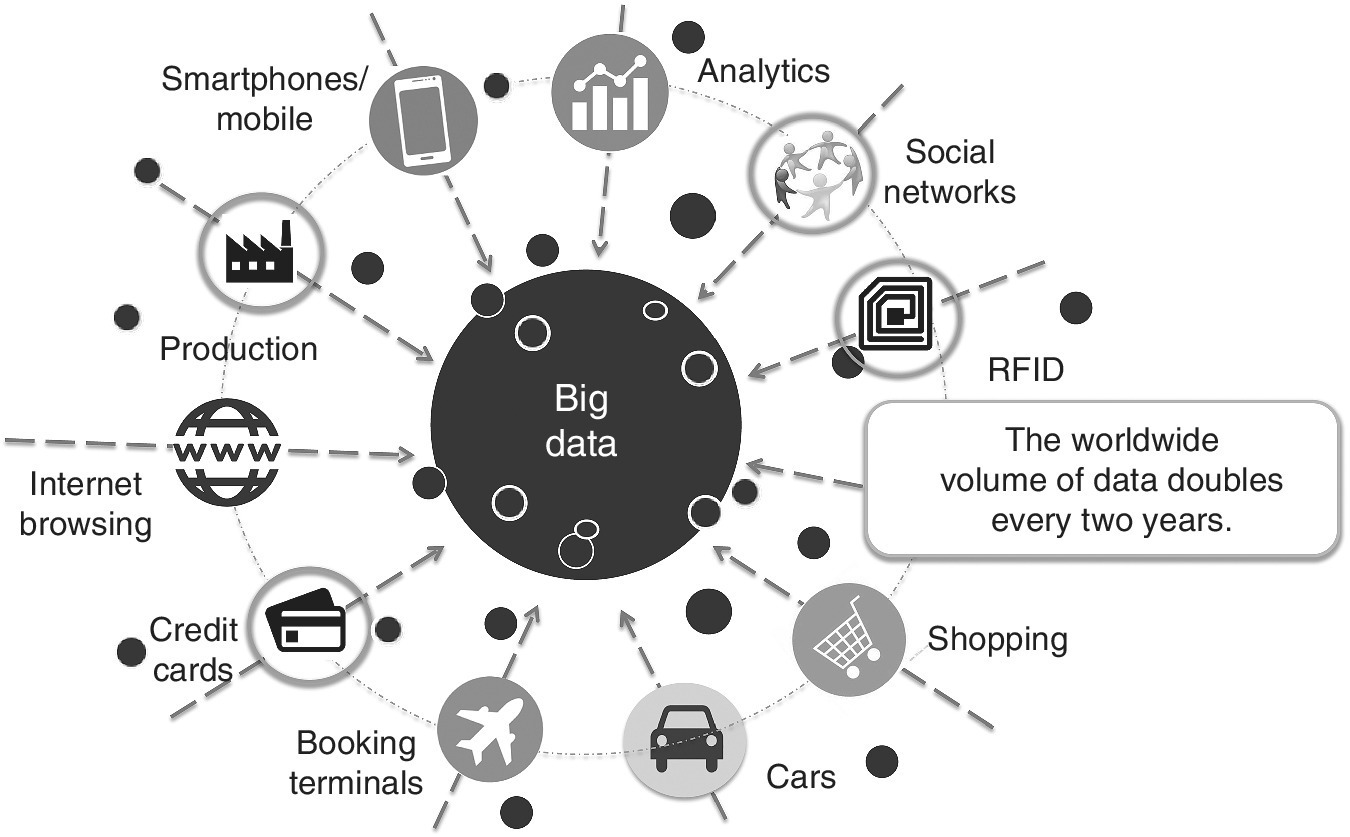
The common phrase to describe this changed world is ‘big data’ (Figure 1.1). A book on monetising data is inevitably about big data. We will interpret the term big data as data that is of a volume, variability and velocity that means common methods of appraisal are not appropriate. We need analytical methods to see the valuable patterns in it.

Figure 1.1 Where does big data come from?.
Since the early 2000s there has been a drive to make data more available, giving rise to the open data movement. This promotes sharing of data gathered with the benefit of public funding and includes most official statistics, academic research output and some market, product and service evaluation data. The opening up of data has led to a steep increase in requests for access to even more data; the result is a burgeoning interest in action learning and enthusiasm to understand the potential waiting to be uncovered from the data. The profession of data scientist has evolved and now encapsulates the skills and knowledge to handle and generate insights from this information.
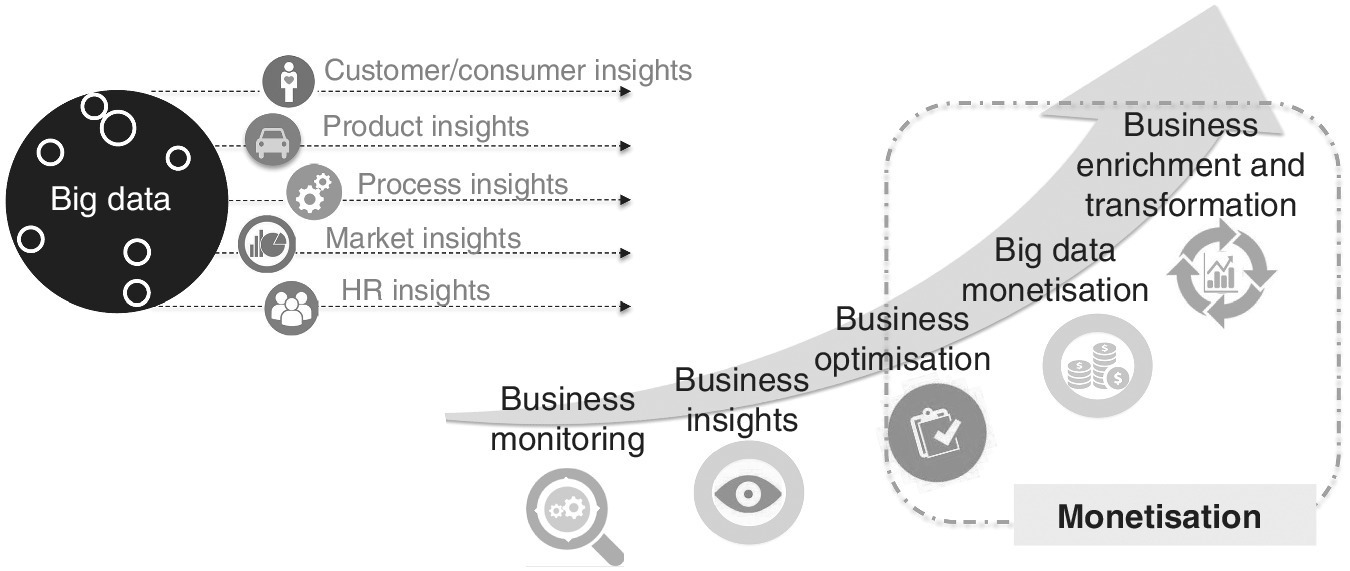
Figure 1.2 shows how big data combined with analytics might empower different areas of any business. The aim of this book is to encourage people to use their big data to work out exciting business opportunities, make major changes and optimise the way things are run.

Figure 1.2 Big data empowers business.
1.3 Realising Data as an Opportunity
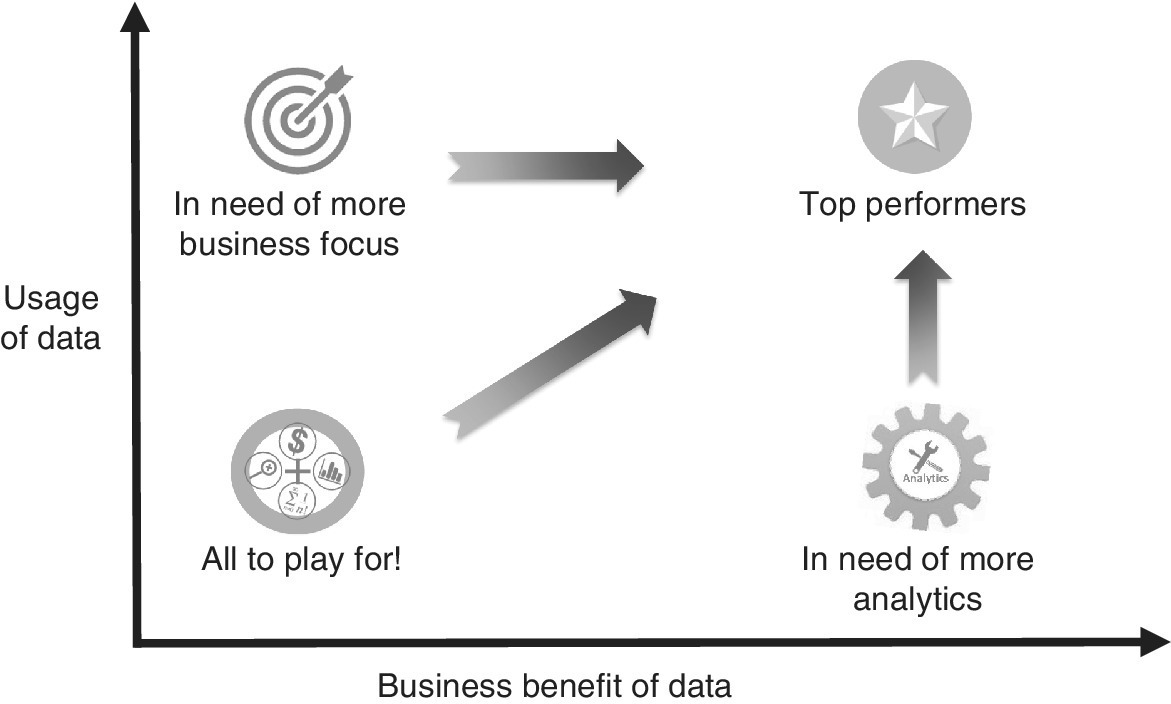
One of the key motivations for this book on monetising data is the sheer amount of under‐utilised data around. Hardly less important is the under‐achievement in terms of business benefit derived among those who do use their data. This suggests a two‐dimensional representation of the state of organisations, with one axis representing the usage of business data and the other axis representing the business benefit derived from it. Needless to say, the star performers are at the top right‐hand side of the resulting diagram in Figure 1.3. Being in the top and right‐hand corner is better than being at the top or at the right‐hand side of the axes because the two factors reinforce each other in a synergistic manner, giving greater benefits than either alone.

Figure 1.3 Roadmap to success.
The marketplace is highly heterogeneous, with companies and institutions (all referred to as ‘organisations’ henceforth) differentiated in many ways, including:
- sector
- size of turnover
- size in numbers of employees
- maturity
- research focus
- product or service development.
The baseline against which organisations can benchmark themselves in Figure 1.3 is different for different types of organisation.
Familiar players using big data include retail, finance, automotive manufacturers, health providers and process industries. In addition, the following are some of the less familiar organisations likely to be in possession of big data:
- Sports societies: these may have larger turnover than expected and hold vast data banks of members’ details and their sporting activities.
- Museums and galleries: these may have loyalty cards and multiple entry passes that yield customer details, frequency of visits, distance travelled, inclination and time spent at the venue.
- Theatres and entertainment venues: these have names, addresses and frequency of attendance of attendees, and can study their catchment area and the popularity of different acts.
- Libraries: these have names and addresses and members’ interests and usage.
- Small retailers: these have records of itemised sales by day of week, time of day and season plus amount spent.
- Craft and niche experts: who are first aware of trends and may have a global outlook.
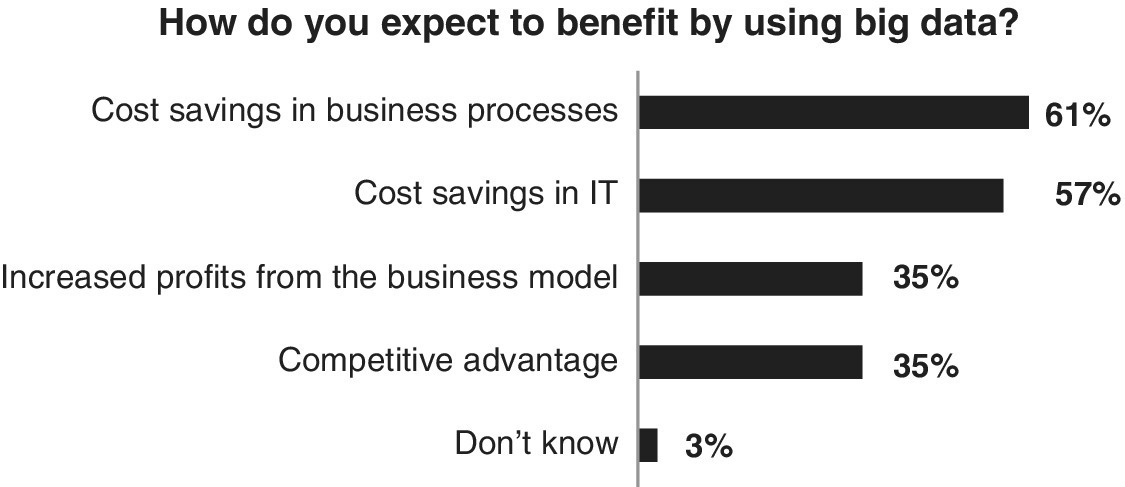
All these organisations can take advantage of their data but they start from different points with different resources and capabilities; with good ideas they may have the opportunity to become winners in their own areas. Experience suggests that organisations have a secret wish list for generating money out of their data. Figure 1.4 shows the ranking we observed from our clients. However, this is just a snapshot and does not include business enrichment and transformation, which are also possible.

Figure 1.4 Wish list for generating money out of data.
Figure 1.5 shows a very generalised process for monetising data. Data comes into the process and is first used for business monitoring, leading to business insights; these might generate business optimisation and might lead to monetisation and potential business transformation.

Figure 1.5 Monetising data.
Despite differences in scale, the matrix in Figure 1.3 can help any organisation to map their current situation and plan their next steps to uplift their business.
1.4 Our Definition of Monetising Data
Data is the fundamental commodity, consisting of a representation of facts. However, when the data are summarised and illustrated they can lead to meaningful information, and assessing the meaningful information in context can lead to knowledge and wisdom.
Monetising data is more than just selling data and information. It includes everything where data is used in exchange for business advantage and supports business success. Large companies are often data rich and some have realised the advantage this gives them. Others consider themselves data rich but information poor because they have lots of data but it is not in a form that they can easily interpret or use to gain business insights. Statistical enthusiasm is a rare commodity but those businesses that pay attention to their data can find the answers to many of their policy and productivity questions. For example, scrutiny of data on sales easily yields information about seasonal trends: sales per customer might show shortfalls in maximising selling opportunities; total income might show overall success in attracting buyers, and so on.
Case studies and real data from our consulting practices are used throughout the book to illustrate the ideas, methods and techniques that are involved. As will be seen, most data can be monetised to bring benefit to the organisation. However, a lot of effort has to be expended to get the data into a suitable format for analysis. Data readiness can be assessed using tools that we will discuss. As analytics progresses, guidelines for data improvement become meaningful and we introduce the concept of the data improvement cycle to help organisations in continuous improvement and moving forward with their data analytics.
This book is aimed at managers in progressive organisations: managers who are keen to develop their own careers and who have the opportunity to suggest new ideas and innovative approaches for their organisation and influence how they are taken forward. The material requires background knowledge of dealing with numbers and spreadsheets and basic business principles. More specialised techniques, such as the use of decision tree analysis and predictive models, are fully explained. The main issue is the strength of desire to join the data revolution and hopefully after reading this book you will be an excited convert.
1.5 Guidance on the Rest of the Book
The rest of the book is planned as follows. Chapters 2 and 3 address data collection and preparation issues, including the use of mapping and meteorological data as well as official statistics. Chapter 4 looks at general issues around data mining: as a concept and a mechanism for gathering insights from data. Chapters 5 and 6 address technical methods; Chapter 5 looks at descriptive analytics, starting with statistical methods for summarising data and graphical presentations, and Chapter 6 moves on to statistical testing, modelling, segmentation, network analysis and predictive analytics.
Chapters 7 and 8 introduce the different strategies, motivations, modes and concepts for monetising data and examine barriers and enablers for organisations seeking to realise the full potential of their data, their valuable asset. Monetisation can be viewed strategically and operationally. Strategically we can look at new business directions, step changes in thinking, disruptive innovation and new income streams. Operationally we can consider optimising current business models, and making better use of customer targeting and segmentation. In Chapter 7 we focus on strategic issues, whilst operational improvements of the existing business will be explored in Chapter 8. In Chapter 9 we will consider the practicalities of implementation, such as issues of ethics, privacy and security; loss of cultural and technical learning due to staff turnover and the other dampers that have to be overcome before we can achieve strategic steps forward and improvement of the current situation.
The mutual importance of theory and practice has long been recognised. As Chebyshev, a founding father of much statistical theory, said back in the 19th century, ‘Progress in any discipline is most successful when theory and practice develop hand in hand’. Not only does practice benefit from theory but theory benefits from practice. So in Chapter 10 we describe a set of case studies in which monetisation has brought big gains and uplifted the business. Thus we will aim to end the book on a high note and provide inspiration to move forward.
If you locate yourself within the grid in Figure 1.3 you can see which parts of the book are most relevant for you. Those readers at the bottom left are probably at the beginning of their exploration of monetisation and could well jump to the case studies in Chapter 10 for motivation and then return to Chapter 2. Those at the bottom right have already gained substantial business advantages but could benefit from learning new statistical and data‐mining techniques to make deeper use of their data, as described in the more technical Chapters 3–6. Those at the top left already have experience of analysing data but need to realise a better business advantage and could go straight to Chapters 7–9. Those at the top right can read the whole book for revision purposes and further insights!
Note that we avoid naming specific companies. Instead we refer to them in a generic way and the reader is welcome to find example companies by searching online.