2
Globalization and Poverty
Introduction
The relationship between globalization and global poverty is complex. In chapter 1, we distinguished among three stages of modern globalization:
- the first stage between 1870 and 1914, ending with World War I
- the second stage following the end of World War II and continuing to the mid-1970s
- the third stage from the mid-1970s to the present.
Global poverty rose during the first stage of globalization, but it continued to rise during the retreat from globalization during World Wars I and II. During the third stage of globalization, there is some evidence that global poverty finally leveled off somewhat and that extreme global poverty is now slowly falling. Given these historical facts, it is difficult to make simple statements about globalization and poverty: accurate statements about this relationship are necessarily complex. In this chapter, we begin to unravel some of these complexities, setting the stage for our investigation of the relationship between globalization and poverty in the remainder of this book.
We begin by considering the developing world, where global poverty is concentrated. We then take on particular aspects of global poverty itself. Finally, we consider the five dimensions of globalization: trade, finance, aid, migration, and ideas. Since we take up each of these topics separately in chapters 3 through 6, we concentrate here on comparisons among them.
The Developing World
Global poverty is concentrated in what is commonly referred to as the developing world. The countries of the developing world became distinct by the 19th century as their per capita incomes began to lag significantly behind those of other parts of the world (figure 2.1). Although by 1820 per capita income in Western Europe was approximately double that of the rest of the world, subsequently the increases in incomes in Western Europe and Japan were far more rapid than they were in Latin American, Eastern Europe, and the former USSR, Asia (excluding Japan), or in Africa. The exact causes of these changes are still being debated and discussed by economic historians. Indeed, in considering the nexus of change in Western Europe—Great Britain in the late 18th century—Crafts (2001) notes
Figure 2.1 Per Capita Income by World Region (1990 international dollars)
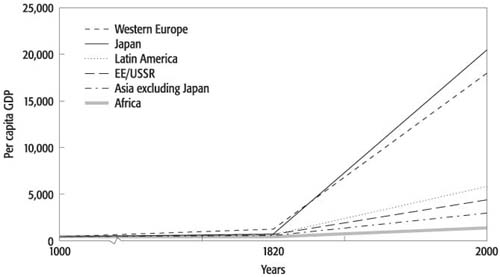
Note: EE/USSR refers to Eastern Europe and the former USSR.
Source: Maddison 2001, table 1-2.
This was still an economy which … had many limitations, including weak science and technology, small markets, and many attractive rent-seeking opportunities for the talented. Indeed, a World Bank economist, given a basic description of the late 18th century British economy without knowing to which country it applied, might well conclude that here was a case of very poor development prospects. (p. 313)
Maddison (2001) provides a contrasting perspective, noting Britain’s improvements in “banking, financial and fiscal institutions and agriculture” as well as a “surge in industrial productivity” (p. 21). Such varying interpretations of how Great Britain, the other countries of Western Europe, and Japan began their revolutionary economic changes leave the processes not fully explained. That the changes were indeed revolutionary, however, is not in doubt. The absence of these changes in the developing world became one of the main characteristics defining it.1
Key Terms and Concepts
extremely poor
headcount index
gross national income (GNI)
low-income countries
middle-income countries
overseas development assistance (ODA)
poor
purchasing power parity dollars
Standard International Trade Classification (SITC)
The early 19th century (the midpoint in figure 2.1) featured as a transition between two waves of colonial expansion, the first beginning in 1400 and the second ending with World War I in 1914. The concurrent second phase of colonial expansion and the first phase of modern globalization has been described as “the apex of … Western political, economic, military and cultural dominance”2 in which 80 percent of the surface of the earth came under various European powers. This colonial history, too, began to define the developing world.
The Impact of an Expanding Population
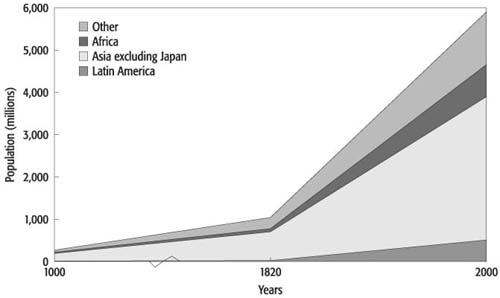
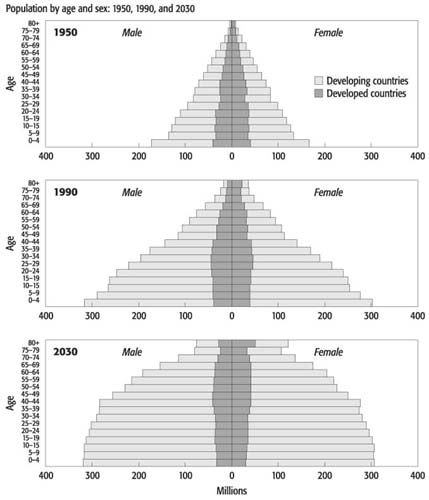
The movement of the world economy through these historic changes was also reflected in dramatic increases in population levels (figure 2.2). This involved an increase in the absolute size of the developing world’s population. From 1000 to 2000, the developing world added nearly 4.5 billion persons, while the rest of the world added slightly over 1 billion. What is most apparent here is the rapid expansion of the Asian region in total population. This took place even with Asia’s total share of world population declining from approximately 65 percent in the year 1000 to 57 percent in 2000. These large increases in the absolute numbers of people in the developing world are part of its long-term history and became apparent in the age structure of its population (figure 2.3). While populations of rich countries become older, those of the developing world become younger. Meeting the development and employment needs of these young people remains a great challenge.
GDP Figures of the Developing World
The increase in the size of the developing world is not confined to population. Large parts of the developing world are emerging in terms of gross domestic product (GDP) as well. Consider figure 2.4.3 This figure plots GDP for four regions as a percentage of total world GDP, both historically back to 1975 and projected forward to 2015. The developing region, consisting of the 12 largest developing countries, accounted for only one-tenth of world GDP in 1975. It is projected to account for one-fifth of world GDP in 2015, surpassing both Japan and the largest four countries of the European Union. Thus it is evident that at least some parts of the developing world are emerging as relatively economically significant.
Figure 2.4 Relative Economic Strength of Developing Countries, Historical and Projected (percent of world GDP in constant US dollars)
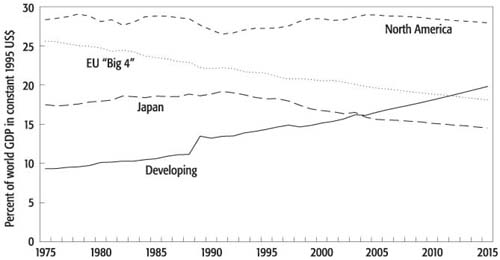
Notes: Developing refers to the top 12 largest developing economics: Argentina, Brazil, China, India, Indonesia, Mexico, Republic of Korea, Russian Federation, South Africa, Taiwan, Thailand, and Turkey; EU “Big 4” refers to France, Germany, Italy, and the United Kingdom.
Source: World Bank analysis.
Low- and Middle-Income Countries
Today the developing world is divided into two sets of countries for analytical and statistical convenience. These are the low-income countries and the middle-income countries. At the time of this writing and for data through 2002, low-income countries are those with a per capita income of less than US$735, and middle-income countries are those with a per capita income more than US$735 but less than US$9,076. The list of these two sets of countries is presented in the annex to this chapter.
Poverty
The goal of this book is to relate the globalization activities of trade, finance, aid, migration, and ideas to global poverty and its alleviation. Recall from chapter 1 that we can associate poverty with deprivations of income, health, education, and empowerment. Recall also that, although relative deprivations are important, we have chosen to focus in this book on the more crucial issue of absolute deprivations.4
Definition of “Poor”
The longest tracking of world poverty is provided by Bourguignon and Morrisson (2002). These estimates cover the 1820 to 1992 period and include both the “poor” and the “extremely poor” (figure 2.5). The poor are defined as those living on less than US$2 per day (in 1985 purchasing power parity dollars), and their numbers increase steadily from just under 1 billion persons in 1820 to 2.8 billion persons in 1992. The extremely poor are defined as those living on less than US$1 per day (in 1985 purchasing power parity dollars), and their numbers have increased and decreased over time, hovering over 1 billion persons for the entire 20th century up to 1992.5 An example of what poverty entails is given in box 2.1.
Figure 2.5 The Historical Evolution of World Poverty (millions of persons)
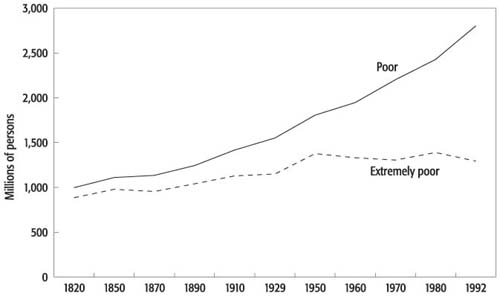
Source: Bourguignon and Morrisson 2002.
Box 2.1 The Experience of Being Poor
For approximately 45 years, until her recent retirement, Jayamma went every day to the brick kiln and spent eight hours a day carrying bricks on her head, 500 to 700 bricks a day…. Jayamma balanced a plank on her head, stacked twenty bricks at a time on the plank, and then walked rapidly, balancing the bricks by the strength of her neck, to the kiln, where she then had to unload the bricks without twisting her neck, handing them two by two to the man who loads the kiln. Men in the brick industry typically do this sort of heavy labor for a while, and then graduate to the skilled (but less arduous) tasks of brick molding and kiln loading, which they can continue into middle and advanced ages. Those jobs pay up to twice as much, though they are less dangerous and lighter. Women are never considered for these promotions and are never permitted to learn the skills involved…. Nonetheless, they cling to the work because it offers regular employment, unlike construction and agriculture; kilns also typically employ children workers, so Jayamma could take her children to work with her. She feels she has a bad deal, but she doesn’t see any way of changing it.
Source: Nussbaum 2000, pp. 18–19.
Poverty and Global Inequality
According to Bourguinon and Morrisson, the persistence of world poverty over the long term has been associated with an increase in global inequality, both within and among countries. They note
World economic growth since 1980 could have caused poverty to decline dramatically, despite population growth, had the world distribution of income remained unchanged. Had that been the case, the number of poor people would have been 650 million in 1992 rather than 2.8 billion and the number of extremely poor people 150 million instead of 1.3 billion. Likewise, the leveling off in the number of extremely poor people since 1970 can be attributed to the stabilization of their relative position since then. (p. 733)
More recent data on world poverty are provided by Chen and Ravallion (2004).6 These estimates cover the 1981 to 2001 period and again include both the poor and the extremely poor in terms of 1985 purchasing power parity dollars (figure 2.6). These data provide two pieces of good news. With regard to the number of poor, there has been a recent leveling off for the first time since the early 19th century at approximately 2.7 billion persons, a figure that nevertheless represents a policy challenge of enormous proportions. With regard to the number of extremely poor, there has finally been some downward movement to approximately 1.1 billion. As these authors note, most of this decline occurred in the early 1980s and can be primarily attributed to developments in China and, to a lesser extent, in India.7
Figure 2.6 The Recent Evolution of World Poverty (millions of persons)
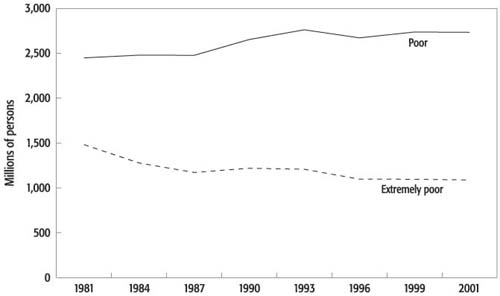
Source: Chen and Ravallion 2004.
The Composition of Poverty
The picture of poverty painted by figure 2.7 is improved somewhat when it is considered in terms of what development economists term the headcount index rather than the number of poor people. This is poverty as a percentage of population. For the poor, the headcount index has fallen from approximately two-thirds of the developing world population in 1981 to approximately half in 2001. For the extremely poor, it has fallen from approximately 40 percent to approximately 20 percent. Thus, relative to significantly expanding populations, poverty incidence as measured by the headcount index has been steadily falling. This does not imply, however, that the absolute numbers of poor and extremely poor people have fallen.
Figure 2.7 Regional Incidence of Extreme Poverty (millions of persons)
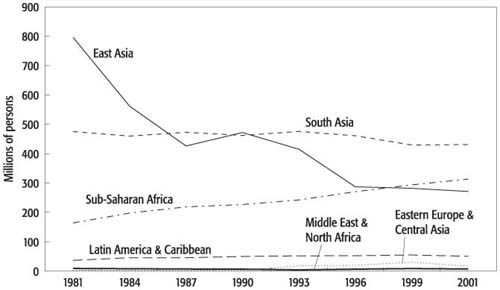
Source: Chen and Ravallion 2004.
As the case of China illustrates, the regional composition of extreme poverty matters. An examination of figure 2.7 reveals that extreme poverty is primarily a South Asian and African phenomenon. In East Asia, the number of extreme poor has been declining steadily and significantly since the early 1980s, primarily due to changes in China. In South Asia, the number of extreme poor has declined somewhat, with almost all of this smaller change being accounted for by India. In Africa, extreme poverty has been steadily increasing, with the number of people in this group increasing by over 100 million since the early 1980s.
Poverty Indicators: Life Expectancy
As the various regions of the world diverged in per capita incomes, so they diverged in life expectancy, low levels of which reflect deprivations in health (figure 2.8). It is important to note that the historical evidence suggests that these changes in life expectancies were not driven entirely by the changes in per capita incomes. Changes in science and public health had significant impacts in their own right.8 As with the gains in per capita incomes, the gains in life expectancies beginning in the early 19th century were historically unprecedented. For example, Maddison’s (2001) estimate of life expectancy in both Roman Egypt at the dawn of the Common Era and 14th century Great Britain are exactly the same: only 24 years.9 Even the slowest increases in life expectancy in Africa since 1820 have more than doubled that millennial norm. However, the substantial gap remaining between Africa and even the other developing regions is a cause for great concern, especially because it reflects high levels of infant and child mortality. Another major cause for concern is the recent reversal in African life expectancy caused by HIV/AIDS.
Figure 2.8 Life Expectancy by World Region (years)
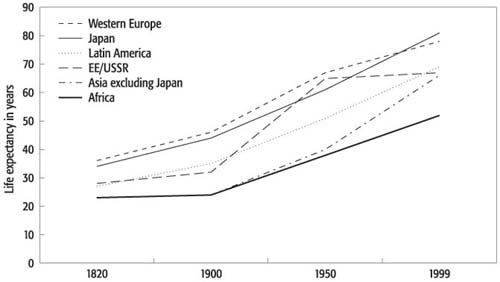
Note: EE/USSR refers to Eastern Europe and the former USSR.
Source: Maddison 2001, table 1-5a.
Poverty Indicators: Health
Perhaps the most important indicator of health poverty is infant mortality, a sad testament to the global failure to meet the most basic of needs.
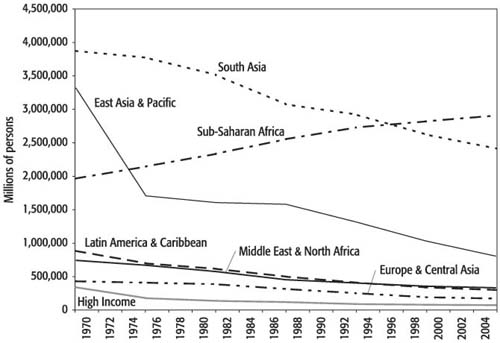
Health Deprivation: Infant Mortality
Total infant mortality in 2004 was approximately 7 million, representing an enormous annual tragedy. Examining recent trends in infant mortality (figure 2.9) leads to some important conclusions. First, as is evidenced by the case of South Asia where annual infant mortality has declined by a million since 1970, it is possible to reduce infant mortality significantly even without significantly reducing extreme income poverty. Second, as is evidenced by the case of Sub-Saharan Africa, where annual infant mortality has increased by nearly a million since 1970, increases in extreme income poverty can exacerbate infant mortality.10 Third, as is evidenced by the Middle East and North Africa, it is possible to have significant infant mortality in the near absence of extreme income poverty. Taken together, these cases indicate that the relationship between income poverty and health poverty is not as direct as one might first assume.
Health Deprivation: Malnutrition
Health deprivation is not by any means limited to infant mortality. For example, approximately 1 billion persons are malnourished; over 150 million of these people are children. Annually, approximately 12 million infants are born underweight, a condition that can have lifetime, deleterious consequences such as lower IQ, cognitive disabilities, and reduced immune function.11 As noted by Streeten (1995), “Prolonged malnutrition among babies and young children leads to decreased brain size and cell number, as well as altered brain chemistry…. Children who suffer from severe malnutrition show lags in motor activity, hearing, speech, social and personal behavior, problem-solving ability, eye-hand coordination and categorization behavior, even after rehabilitation” (p. 57). Health poverty, then, is both serious and pervasive.
Health Deprivation: Implications of Female Education
Substantial evidence suggests that female education is positively associated with infants’ and children’s abilities to escape mortality and malnourishment. The mediating factors include hygiene, nutrition, and child-care practices. This is a key reason for focusing attention and policy measures on female education in developing countries.12 Consider the data shown in figure 2.10. This figure plots female youth literacy as a percentage of male literacy using the dark bars. These range from slightly over 50 percent in the case of Niger to slightly over 100 percent in the case of Uruguay. There is thus a wide range of outcomes in the poorer countries with regard to female youth literacy. This is important in its own right but also has implications for infant and child health poverty. The chart also plots infant mortality for these seven countries using lighter bars, and we can see that infant mortality increases significantly as female youth literacy decreases. For reasons such as these, the gender aspects of health poverty matter a great deal.
Figure 2.10 Female Youth Literacy Relative to Male Youth Literacy and Infant Mortality, 2003

Source: United Nations Development Programme 2005.
A Global Imperative
Reducing extreme income poverty and extreme health poverty in the form of infant mortality is a global imperative. It is also an economic imperative, because, according to the research of the World Health Organization (2001b), lower rates of infant mortality are associated with higher rates of economic growth. Although the elements of globalization we consider in this book can have significant effects in reducing infant mortality, we do not want to claim too much for them, except perhaps to emphasize that ideas concerning the social roles of girls and women can be powerful in their effects in this area. Since the processes of globalization are both powerful and longstanding, it is important to explore the wide-ranging ways they can be better harnessed in the battle to improve poor people’s lives, at least in this area of infant mortality.
Trade and Foreign Direct Investment
Increases in international trade and foreign direct investment (FDI) are potentially vital means to alleviate global poverty.13 Examining this possibility requires an appreciation both of the kinds of trade and FDI the developing world engages in and of the way these activities have changed over time. FDI is distinct from other capital flows (portfolio equity investment, bond finance, and commercial bank lending, as well as aid and remittances) in that it primarily reflects managerial rather than portfolio behavior. Trade and FDI can be related to one another through what international economists and business strategists call intra-firm trade. This is trade that takes place within multinational enterprises (MNEs), and it accounts for approximately one-third of world trade.14 As developing countries integrate into the world economy, they typically become increasingly involved with global patterns of intra-firm trade. In addition, some FDI can generate exports when the MNEs engage in foreign investment to build export capacity abroad.
The Magnitude of Trade and FDI
For a sense of the magnitudes of trade and FDI consider figure 2.11, which points out a number of important features of both exports and FDI inflows for the developing world:
- First, the exports and FDI inflows of the middle-income countries are much larger than those of the low-income countries.
- Second, exports are substantially higher than FDI inflows for both the middle-income countries and the low-income countries.
- Third, with the exception of investments in extractive industries, low-income countries as a group receive practically no FDI inflows at all.
- Fourth, the exports of the middle-income countries have increased substantially faster than those of the low-income countries
Indeed, the increase of exports from the middle-income countries is one of the recent success stories of the developing world and is not unrelated to the recent improvements in poverty measures discussed above. Because nearly all of Sub-Saharan Africa is composed of low-income countries, there is a regional dimension to some of these trends: aside from petroleum and minerals, Africa is largely left out of global export growth and FDI inflows, although a few African countries have been able to break this mold and have benefited from rapid growth in both investment and trade.15
Figure 2.11 Trade and FDI for Low- and Middle-Income Countries (millions of current US dollars)
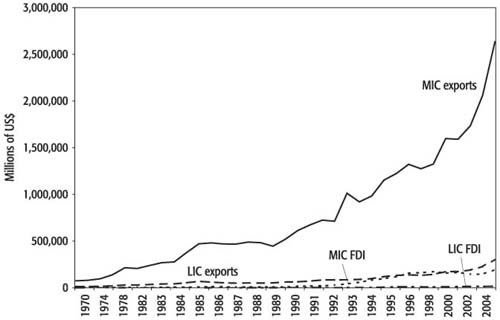
Note: LIC = low-income country; MIC = middle-income country.
Source: World Bank 2006a.
Sectoral Structure of Exports
Examining the sectoral structure of developing-world exports, we learn three things (figure 2.12).
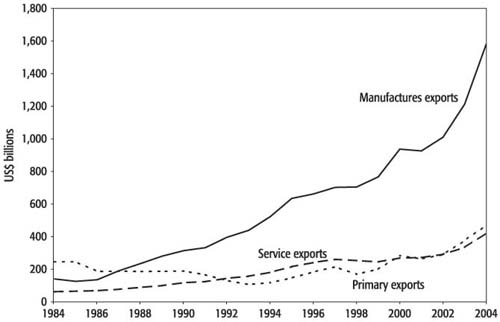
- First, increases in exports from the developing world have occurred primarily in manufactured goods. Indeed, despite a few temporary downturns, developing-country manufactured exports have been steadily increasing since the mid-1980s.
- Second, only relatively minor increases in primary (including agriculture) exports have occurred since the mid-1980s.
- Third, despite a common perception of developing countries as being in “pre-service” stages of development, exports of commercial services have increased faster than exports of primary goods.
Manufacturing Exports
The increases in developing country manufacturing exports and FDI inflows reflect to some degree the increased integration of developing countries into the flexible manufacturing systems of the third stage of modern globalization. As described by Ocampo and Martin (2003),
This was the first step toward the development of internationally integrated production systems, in which production can be divided into various stages (a process known as “the dismemberment of the value chain”). In such systems, the outsourcers in different countries can then specialize in the production of certain components, in particular phases of the production process, or in the assembly of specific models. (p. 4)
An increasing number of developing countries took this first step, despite continued protectionism in areas such as textiles, clothing, and food products. Indeed, the increased involvement of some developing countries in the global manufacturing system is perhaps the most important characteristic of the third stage of globalization. It increasingly involved trade within narrowly defined sectors (intra-industry trade) and, as mentioned above, even trade within multinational firms themselves (intra-firm trade).
Agricultural Exports
The stagnation of developing countries’ agricultural exports has had a number of causes. Among these causes are the bias against agriculture in most developing countries; the protection against developing-country agricultural exports in both developed and other developing countries; and the extensive subsidization of agriculture in the developed countries, which undercuts successful agricultural production in the developing world.16 This stagnation is an important explanation of the continued stubbornness of rural poverty and of the limitations to developing country participation in the world trading system.
Commercial Services Exports
Finally, the slow increase in commercial services represents the increased involvement of developing countries in transportation, tourism, and business services. Because the data on provision of these services are imperfectly collected, the actual increase in commercial services over time might be even larger than that illustrated in figure 2.12.
There is a tradition in development economics that emphasizes the role of manufacturing in successful development trajectories. From this perspective, the upward trajectory in the manufacturing exports of developing economies is encouraging. However, there is a less well known concern with the potential of agriculture to contribute positively to development trajectories, and there is some evidence to support this view in the case of East Asia.17 From this perspective, as well as from the perspective of the numerous rural poor, the stagnation of agricultural exports is less than encouraging. Rarely appreciated is the potential role for service exports to transform economies, a potential that can be significant.18 In light of this, it is important to recognize the fact that even the low-income countries are active in this area.
Capital, Aid, and Remittance Flows
Capital flows, aid, and remittances are important channels through which poorer countries can gain access to resources from abroad. Each of these activities is identified by international and development economists as an additional way to reduce global poverty, albeit with some disagreement.19 We consider each of these globalization dimensions to gain a sense of their relative magnitudes.
The Role of FDI
If we consider recent trends in capital flows, aid, and remittances for developing countries, a number of important characteristics become visible (figure 2.13). Since the early 1990s, FDI has emerged as the most important foreign resource flow for the developing world as a whole, surpassing foreign aid or official development assistance (ODA) by increasing amounts. Despite some volatility in the 2000 to 2003 period, the long-term growth and volume of these flows has been remarkable, inspiring much comment on the possibility of private capital replacing aid. Recent data demonstrate a recovery of FDI inflows in 2004. In part, these new flows are related to the increased manufacturing exports of the developing world, because FDI has been a vehicle for these countries to integrate into the global manufacturing system.20
Figure 2.13 Nominal Flows of Aid, FDI, Portfolio Investment, and Remittances to Developing Countries
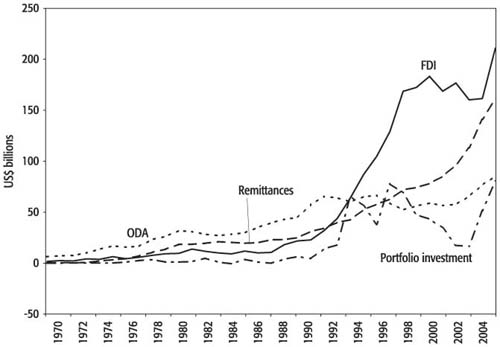
Source: World Bank 2006a.
The Role of Portfolio Flows
Along with FDI, portfolio flows such as equities and bonds began to increase significantly in the 1990s. In contrast to FDI, however, these flows have proved to be volatile, dropping precipitously between 1997 and 2003. They recovered significantly in 2003 and 2004, and recent data21 suggest that portfolio flows will hold up well at least through 2005. The volatile nature of portfolio flows gives rise to the cautionary approach we take toward portfolio capital in chapter 4 and is reflected in box 2.2 on “volatile widgets.”22
Box 2.2 Volatile Widgets in the 1990s
Imagine landing on a planet that runs on widgets. You are told that international trade in widgets is highly unpredictable and volatile on this planet, for reasons that are poorly understood. A small number of nations have access to imported widgets, while many others are completely shut out even when they impose no apparent obstacles to trade. With some regularity, those countries that have access to widgets get too much of a good thing, and their markets are flooded with imported widgets. This allows them to go on a widget binge, which makes everyone pretty happy for while. However, such binges are often interrupted by a sudden cutoff in supply, unrelated to any change in circumstances. The turnaround causes the affected economies to experience painful economic adjustments. For reasons equally poorly understood, when one country is hit by a supply cutback in this fashion, many other countries experience similar shocks in quick succession. Some years thereafter, a widget boom starts anew.
Substitute “international capital flows” for “widgets” above and the description fits today’s economy quite well. We have just gone through a lending boom-and-bust cycle in Asia that is astounding in its magnitude. In 1996, five Asian countries (Indonesia, Malaysia, the Philippines, the Republic of Korea, and Thailand) received net private capital inflows amounting to US$93 billion. One year later (in 1997), they experienced an estimated outflow of US$12.1 billion, a turnaround in a single year of US$105 billion, amounting to more than 10 percent of the combined GDP of these economies.
Source: Rodrik 1998a.
The Role of Foreign Aid
In contrast to both FDI and portfolio flows, foreign aid or ODA is a historically recent flow. Aid increased slowly from the 1960s until around 1990. Between 1990 and 2001, aid flows have stagnated, and as a share of rich countries incomes, or per capita requirements of poor people, declined precipitously: from around 0.32 percent of gross national income (GNI) or US$35 per African in 1990, to 0.22 percent of GNI or US$17 per African in 2000. More recently and as evident in Figure 2.13, the downward trend in aid has been reversed with a growing number of countries committing to double their aid budgets by 2010. Like other capital flows, aid has been concentrated in a relatively small number of countries, although since the end of the Cold War donors increasingly have directed their aid to countries that are more effective at using the aid and those where most poor people live. The UN Millennium Declaration in 2000 marked the beginning of a renewed push for increased aid and for greater aid effectiveness. Recent years have seen considerable progress toward increasing the impact of aid on the part of both the recipients and donors. As we emphasize in chapter 5, both the quality and the quantity of aid matter enormously for poor people, and the impact of aid is not limited to its monetary value—the associated flow of ideas and capacity building can also play a vital role.
The Role of Remittances
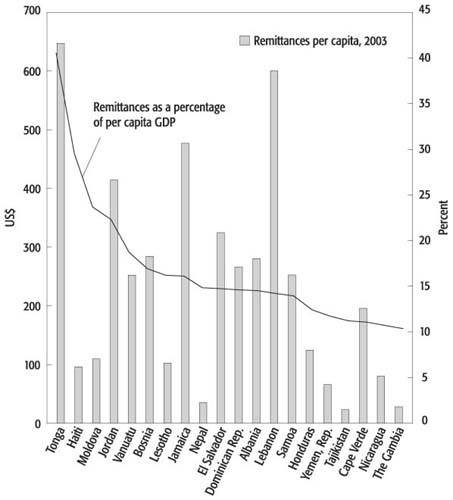
The remittance flows of global migrants have been characterized by a long-term upward trajectory almost as significant as that of FDI, and the rate of increase in remittances shifted upward even as FDI fell during the 2000 to 2003 period. Remittance flows to developing countries were approximately US$200 billion in 2006 and are more important than both aid and portfolio investments to the alleviation of poverty. They are the financial manifestation of the international movement of persons. Their increase reflects the fact that the world’s foreign-born population has more than doubled since 1965 and currently stands near 200 million persons.23 Increased remittance flows have also responded to declines in money transfer costs that accompany globalization.24 The rapid increase in recorded remittances since 2001 may also be due to increased scrutiny and recording of these flows and the inclusion of previously unrecorded flows in the official data.
The country-specific nature of remittances can be appreciated from figure 2.14. This figure plots two measures of remittances. It plots data on 2001 per capita remittances in US dollars measured on the upper axis and indicated with vertical bars. The countries are ranked by per capita remittances as a percentage of per capita GDP, which is measured on the lower axis and indicated with a line. Remittances can be significant from both perspectives. For example, per capita remittances are over US$300 for El Salvador, Jamaica, Jordan, Lebanon, and Tonga. Per capita remittances as a percentage of per capita GDP range from approximately 40 percent to 10 percent. For the countries toward the left end of the figure, remittances are a significant fraction of per capita GDP. This indicates that the money sent home by migrants from these countries is a significant source of income compared with domestic production, so it can have a significant impact on poverty.
Figure 2.14 Foreign Remittances Per Capita and as a Percentage of Per Capita GDP, 2003
Source: World Bank 2005b.
The Role of Trade
Finally, each of the above flows (FDI, portfolio investment, foreign aid or ODA, and remittances) is of a lesser order of magnitude than trade (see also figure 2.11). That does not make these flows unimportant; it makes the trade aspect of globalization especially important. Additionally, leveraging capital and aid flows in creative ways for effective poverty alleviation becomes crucial given their lower orders of magnitude.
Ideas
Ideas are the generation and transmission of distinctive intellectual constructs in any field that can affect production systems, organizational and management practices, governance practices, legal norms, and technological trends. By their very nature, it is difficult to accurately compare idea flows to the other kinds of flows considered here.
Ideas for Development
Given our concern with poverty, perhaps the most important set of ideas connected to globalization is what Meier (2001) calls “ideas for development.” Meier notes that “ideas are fundamental to the future progress of development” (p. 1). Ideas for development are always emerging, but if one looks hard enough, there is an apparent middle ground among past ideological divisions in development thinking.
Emerging Middle Ground
For example, there is now a better appreciation than in the past of the roles of institutions, history, the public sector, and human welfare in development processes. One recent idea in this realm is that of global public goods, described in box 2.3. This emerging middle ground does not offer any simple, one-size-fits-all prescriptions. In some ways, we have arrived at a stage in which “we know that we do not know” (Hoff and Stiglitz 2001), but there is no small measure of ironic comfort in this. There is now intellectual room for multiple, successful routes to development that involve large measures of local learning and experimentation.
Box 2.3 The Idea of Global Public Goods
One recent idea in international economic policy that is relevant to our investigation of globalization is that of global public goods. A public good is a desired object that has some particular features setting it apart from private goods. First, its consumption is “nonrival” in that more than one person can consume it at the same time. Second, its benefits are “nonexcludable” in that people cannot be easily prevented from claiming them. For example, road safety is a well-known local public good, evident from the fact that we do not privately purchase traffic lights.
A global public good is a public good the benefits of which accrue more or less globally, benefiting persons in most countries. Examples include the multilateral trading system, international peacekeeping, disarmament agreements, disease eradication, and measures to prevent global warming. As noted by Kaul, Grunberg, and Stern (1999), the “concept of global public goods is crucial to effective public policy under conditions of increasing economic openness and interdependence among countries” (p. 9).
Because the benefits of global public goods are spread around the world, no single nation has the incentive to provide them. Unlike local public goods, the absence of a global government leads to their underprovision. Consequently, international cooperation is crucial. As these authors remark, “In today’s rapidly globalizing world, peoples’ well-being depends on striking a careful balance not only between private and public goods but also between domestic, regional and global public goods” (p. 16). Achieving the cooperation among countries to provide global public goods is a significant and ongoing challenge.
Source: Kaul, Grunberg, and Stern 1999.
Human Rights
Another important idea relevant to reducing deprivation is that of human rights, which has influenced governance practices and legal norms in significant ways. This idea, which is coincident with the second and third stages of modern globalization, is a positive example of what Ocampo and Martin (2003) call the “globalization of values.”25 With its roots in the Universal Declaration of Human Rights (adopted 1948), it is perhaps the International Covenant on Civil and Political Rights (adopted 1966) that has been the most influential. This covenant prohibited torture, slavery, forced labor, and arbitrary arrest. The notion of human rights has been essential in promoting the place of human security (as opposed to national security) as a modern concept.26 It is also relevant to issues of global poverty in its focus on shortfalls in basic needs.27
Role of Ideas in Globalization
The flow of ideas can be closely related to other dimensions of globalization. For example, behind trade, finance, aid, and migration there can be important relationships that assist in learning, and in transmitting and adapting ideas. As will be discussed at various junctures in the chapters that follow, long-term poverty alleviation involves learning of various kinds. For example, learning is involved in the positive transmission of technological change from exporting and FDI inflows. Without the learning relationships for transmitting ideas, these technological changes cannot easily take place. In the case of aid, Pomerantz (2004) emphasizes that “the quality of the relationship may, in fact, be more important in influencing policy directions and ensuring successful outcomes, than the money itself” (p. 8).
Ways to Measure the Flow of Ideas
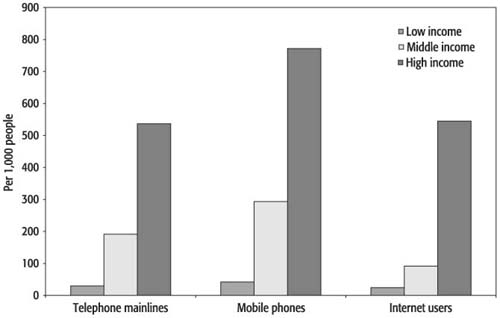
Ideas can be imagined as a current flowing through channels created by trade, capital flows, aid, and migration. However, it is not easy to accurately measure idea flows as we do the other globalization flows considered here. Instead, we can assess the capacity for global idea flows. One measure of capacity is telecommunications connectedness, depicted in figure 2.15. Whether measured in terms of telephone mainlines, mobile phones, or Internet usage, the low-income countries of the world are at a significant disadvantage compared with the middle-income countries, and at even more of a disadvantage compared with the high-income countries. For example, mobile phone usage in the low-income countries is less than 15 percent that of the middle-income countries. This lack of connectedness reflects a lack of infrastructure available to poor people that would enable them to share in the global exchange of ideas, methods, and technology.28
Summary
What do we learn from the information presented in this chapter?
- First, and most important, global poverty is a widespread phenomenon (even in its extreme form) that has finally shown some recent trend toward leveling off and even declining somewhat.
- Second, a ranking of the various dimensions of globalization in terms of US dollar value flow volumes appears to be trade, foreign direct investment, remittances (reflecting migration), other capital flows, and aid.
- Third, the impact of globalization as measured through our economic dimensions are highly uneven—the low-income countries are much less involved in trade and FDI activities, for example, than middle-income countries.
- Fourth, ideas permeate all the other globalization activities, supporting to greater and lesser degrees crucial learning processes that are important to long-run poverty reduction. In fact, poverty is, to an important extent, a poverty of learning, and any improvement in the way globalization benefits poor people will involve supporting poor peoples’ learning in multiple realms.
We will begin to examine in detail each of our globalization dimensions and their links to global poverty in chapters 3 through 7. These examinations, along with that of this and the previous chapter, will lead us to a set of policy recommendations we present in chapter 8. This last chapter recognizes that global poverty in all its dimensions requires adequate policy responses from national and world communities.
Annex: Low- and Middle-Income Countries, 2004
Low-Income Countries
Afghanistan, Angola, Bangladesh, Benin, Bhutan, Burkina Faso, Burundi, Cambodia, Cameroon, Central African Republic, Chad, Comoros, Democratic Republic of Congo, Republic of Congo, Côte d’Ivoire, Equatorial Guinea, Eritrea, Ethiopia, The Gambia, Ghana, Guinea, Guinea-Bissau, Haiti, India, Kenya, Democratic Republic of Korea, Kyrgyz Republic, the Lao People’s Democratic Republic, Lesotho, Liberia, Madagascar, Malawi, Mali, Mauritania, Moldova, Mongolia, Mozambique, Myanmar, Nepal, Nicaragua, Niger, Nigeria, Pakistan, Papua New Guinea, Rwanda, São Tomé and Principe, Senegal, Sierra Leone, Solomon Islands, Somalia, Sudan, Tajikistan, Tanzania, Timor-Leste, Togo, Uganda, Uzbekistan, Vietnam, the Republic of Yemen, Zambia, Zimbabwe.
Middle-Income Countries
Albania, Algeria, American Samoa, Antigua and Barbuda, Argentina, Armenia, Azerbaijan, Barbados, Belarus, Belize, Bolivia, Bosnia and Herzegovina, Botswana, Brazil, Bulgaria, Cape Verde, Chile, China, Colombia, Costa Rica, Croatia, Cuba, Czech Republic, Djibouti, Dominica, Dominican Republic, Ecuador, Arab Republic of Egypt, El Salvador, Estonia, Fiji, Gabon, Georgia, Grenada, Guatemala, Guyana, Honduras, Hungary, Indonesia, Islamic Republic of Iran, Iraq, Jamaica, Jordan, Kazakhstan, Kiribati, Latvia, Lebanon, Lithuania, FYR Macedonia, Malaysia, Maldives, Marshall Islands, Mauritius, Mayotte, Mexico, Federated States of Micronesia, Morocco, Northern Mariana Islands, Oman, Palau, Panama, Paraguay, Peru, Philippines, Poland, Romania, Russian Federation, Samoa, Saudi Arabia, Serbia and Montenegro, Seychelles, Slovak Republic, South Africa, Sri Lanka, St. Kitts and Nevis, St. Lucia, St. Vincent and the Grenadines, Suriname, Swaziland, Syrian Arab Republic, Thailand, Tonga, Trinidad and Tobago, Tunisia, Turkey, Turkmenistan, Ukraine, Uruguay, Vanuatu, Républica Bolivariana de Venezuela, West Bank and Gaza.
Notes
1. These revolutionary changes in economic development eventually gave rise to significant “reversals of fortune” over time. For example, in the mid-1950s, Southeast Asia and Africa had the same levels of per capita income. By the late 1990s, Southeast Asia’s per capita income was approximately five times that of Africa. See Francois (2000).
2. See Szirmai (2005, p. 51).
3. We are grateful to William Rex, Lead Corporate Strategy Officer, World Bank, Washington, DC, for assistance with the data in figure 2.4.
4. As Streeten (1995) notes, “Some authors regard all poverty as relative, but this is surely confusing inequality—an evil, but a different evil—with poverty. Everyone in a society can be equally starving, and we would not want to say that they are not poor” (pp. 32–33). Various measures of inequality or relative income deprivation are expertly reviewed by Ravallion (2004b). A historical view is given by O’Rourke (2002).
5. Recall from chapter 1 that purchasing power parity dollars adjust for differences in the cost of living among the countries of the world, and that this adjustment is especially important because nontraded services tend to be less expensive at low levels of income.
6. See also Chen and Ravallion (2001) for an earlier set of estimates.
7. Ravallion (2004b) notes that the sharp drop in poverty in China in the early 1980s was due to the de-collectivization of agriculture after Premier Deng’s reforms started in 1978 (p. 7).
8. As Crafts (2001) notes, “any index of living standards that gives substantial weight to life expectancy will make the developing countries of the recent past look much better in welfare comparisons with the leading countries of 1870 than does a judgment based simply on real GDP per capita” (p. 325). See also Preston (1975).
9. See table 1-4 of Maddison (2001).
10. As noted by Sen (1999), “the problem of premature mortality is enormously sharper in Africa than in India” (p. 102).
12. For example, in their study of parental education and health in Brazil, Kassouf and Senauer (1996) concluded, “Some 25% of preschool children with mothers who had less than 4 years of schooling suffered from severe or moderate stunting (of growth). This figure would fall to only 15% if these mothers had a primary education of at least 4 but less than 8 years, and only 3% if these mothers had a secondary education of at least 11 years of schooling. Although not as strong as the effect of maternal education, … improved paternal education would also lead to substantial reductions in child malnutrition” (p. 832). See also Schultz (2002).
13. See Dollar and Kraay (2004), for example. An alternative view is given in Rodríguez and Rodrik (2001).
14. An introduction to intra-firm trade is provided in chapter 10 of Reinert (2005).
15. A notable exception to this is South Africa.
16. See, for example, Krueger, Schiff, and Valdes (1988) and Schiff and Valdes (1995).
17. See Brown and Goldin (1992), Park and Johnston (1995), Reinert (1998), and Martin and Mitra (2001). From different perspectives, each of these sources treats the agricultural sector as potentially dynamic, something that has not always been well appreciated.
18. See Francois and Reinert (1996).
19. See, for example, World Bank (2002a and 2002b).
20. See Feenstra (1998), who referred to the integration of trade and disintegration of production in the global economy in an early article on out-sourcing. Less emphasized in this and other articles is the process of “in-sourcing.”
21. See, for example, Institute of International Finance (2005).
22. On the volatility of portfolio capital, see Obstfeld (1998) and Eichengreen (1999, 2004).
23. See World Bank (2005f).
24. For the case of migrants from Latin America, see Lapper (2004).
25. Negative or deleterious examples of the globalization of values certainly do exist as well, such as the undermining of diversity through blind, cultural homogenization.
26. See, for example, Axworthy (2001). He notes, “The international discourse on human security is beginning to effect change on the institutions and practice of global governance…. Globalization has made individual human suffering an irrevocable universal concern” (p. 20). The contention that the human rights idea is merely “Western” has been shown to be false. See, for example, chapter 10 of Sen (1999) and chapter 1 of Nussbaum (2000).
27. See, for example, Pogge (1999).
28. The World Bank’s World Development Indicators estimate a 2002 waiting list for telephone mainlines of over 4.5 million persons in the low-income countries, reflecting an unfilled demand for these services. Tom Friedman (2005) illustrates how communication, transport, and other technological advances have produced new opportunities for those countries or firms that are able to capture the benefits of these developments.