Fitness tools and apps are web-based software, hardware, or hardware/software combinations that can track and provide feedback on your fitness adventures. They are tools made in heaven for geeks, as they blend all kinds of workouts with the online and fitness worlds. Many of them are essentially wearable computers that generate reams of data and catchy, revealing web graphics. Most allow the downloading of the data so that you can do your own coding, as in GPS Exchange (GPX) XML files.
These tools often work through a cell phone app (such as Endomondo or RunKeeper), or they provide a little device or gadget that can connect with a website, as in the Fitbit Tracker. The website provides you with your own dashboard, a central place where you can view your personal stats, aggregated over the months and years, as well as digital maps of where you’ve been.
The place to go to find out about the latest tracking devices is Quantified Self (www.quantifiedself.com). This web group describes itself as “a place for people interested in self-tracking to gather, share knowledge and experiences, and discover resources.” It is an excellent resource for all kinds of tracking devices, posting information on the latest and greatest online web tools, beyond sports or health tracking.
For example, through Quantified Self I have found two other web tracking sites I’d like to check out in the future: FuelFrog for tracking your vehicle’s fuel use, and WattVision, which can help you increase the energy efficiency of your house. The master listing of tracking tools is here: http://quantifiedself.com/guide/.

Of course, in this book we’re primarily interested in sports and fitness trackers, often using the Global Positioning System (GPS) software of your smarthone or sports watch. We’ve also analyzed an extra flavoring of nutrition-oriented software.
The fitness-tracking tools, a subset of which are described in this chapter, seem to have these features in common:
They track fitness and nutrition with easy-to-record metrics and websites that automatically update colorful graphs and tables.
They motivate the users to set goals, monitor progress, and team up and share with other users to create a self-reinforcing network—a tribe, in other words.
In most of the cases, such as Endomondo and Garmin, the software allows the export of the data generated from fitness training (such as a GPS file), so it can be imported into another application or simply examined the way all of us geeks would read code.
For the sake of brevity, we cannot cover in detail all of the major web-based fitness tools (which include RunKeeper, Nike+, Training Peaks, and the MapMyFitness sites), but we think we’ve included an eclectic selection to get you started with fitness tracking apps. This chapter also describes a couple of online nutrition tools in more detail, including NutritionData and FitDay.
These visual displays of data, on cell phones, laptops, and PCs, allow you to initiate a little investigative work on your life. For example, you may want to manage your weight, aspire to athletic goals, deal with physical issues like lowering your blood pressure (e.g., “How does my blood pressure respond to time of day or certain dietary changes?”), or simply isolate patterns and correlations in the data that you would never have pinpointed before.
The personal metrics have another practical purpose, too. You can share the data with sports trainers or doctors, or you can take matters into your own hands rather than paying an expensive expert’s fees. After all, who’s more qualified to examine the feedback from your own body and mind than you?
Fitness tracking apps and devices can often connect and integrate each other’s data. We’ll get into this a bit when discussing the integration of GPS data from Endomondo or Garmin into Google Earth.
Fitness apps are fun and motivating, and they provide useful biofeedback, compile personal metrics in interesting ways, and are closely tied into the computer technology that you know well and love—but they are not strictly necessary for maintaining health. Our vigorous foraging ancestors did not have Fitbit or Endomondo. You can stay pretty darn healthy without fiddling with gear hanging off your belt and constantly consulting a web page.
On the other hand, many people swear by these apps for meeting new health and fitness goals, and they are, beyond a shadow of a doubt, nifty tools for analyzing personal data, playing with, and programming. They also seem to have a “tail wagging the dog” effect in terms of nudging you to accumulate more mileage and move about more.
Note
As Chapter 1 discussed, evolution has apparently coded us for more or less continuous motion—an oscillation of movement throughout the day. Far from being a moderately harmless lazy habit, “chair living” has scientifically documented negative health effects.
Let’s jump right in and examine some of these devices.
Fitbit is a San Francisco–based company that distributes a small motion-sensor device called the Fitbit Tracker (shown in Figure 2-1). You can clip the device to your belt, your sleeve, or wherever is handy. It has a 3D accelerometer that uses technology similar to the Nintendo Wii to analyze your motion throughout the day, compiling comprehensive statistics that you can ogle and digest later.
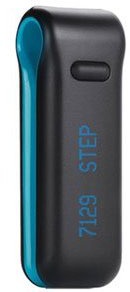
The device is like a pedometer on steroids. It connects with a small base station that plugs into the USB port of your computer, mainly to recharge the device, because the data can be wirelessly synced to the product’s companion web pages.
The handy little Tracker has its own display that will sequentially show the steps you’ve taken so far for the day, your accumulated mileage, an estimate of the calories burned, and a flower icon that is meant to indicate your activity level for the last three hours (you make it grow by becoming more active).
The Tracker will automatically sync its data whenever it is within 15 feet of any plugged-in base station (i.e., not just the base station plugged into your own computer).
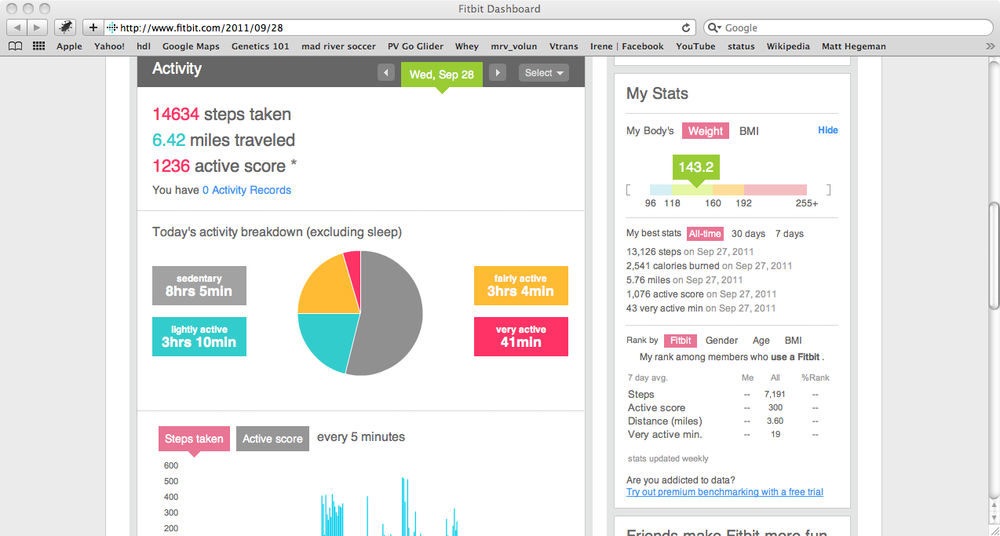
Fitbit really shines when you connect with its dashboard after logging in at www.fitbit.com. Figure 2-2 shows my dashboard for a day in late September. The dashboard shows how many steps you’ve taken (in the thousands, unless you’re bedridden with a broken leg from skiing), calories burned and eaten (if you’ve logged them), how many miles you covered, and an Active Score, which is a numerical indication of how active you have been throughout the day.
The Active Score is a reflection of your metabolic equivalent of task (MET), which is how much energy you’re expending by taking part in certain activities. Sitting all day is a MET equivalent of 1, for example. Running hard would be a MET of 9.5.1
Note
The Fitbit FAQ (www.fitbit.com/faq) states that you can roughly calculate the average metabolic equivalent for the day by using this equation: METs = Active Score * .001 + 1. See the discussion in Chapter 1 on MET.
For example, on this day, I took more than 14,000 steps (glad I wasn’t counting!) and strode about 6.4 miles. My Active Score was 1236, which added up to an average MET for the day of about 2.34 (Active Score x .001 + 1). This is the equivalent MET output of someone doing light construction work.
If you’re in a “generalized active state,” up and down and fidgety in a healthy way, it’s surprising how many miles you can amass by the end of the day. The Tracker provides a fairly accurate figure for striding (I tested it against my phone- and watch-based GPS gadgets during walks).
To provide even more precision, you can enter Fitbit’s settings and specify your step and running-stride lengths.
The key advantage of the Fitbit is that it measures, with a certain degree of accuracy, your generalized pattern of activity and movement.
Note
We seem to be designed for a steady “background noise” of movement throughout the day, rather than the “regularly scheduled workout” followed by long sedentary sits. (Think of a person hunting and gathering food.) Because it doesn’t just focus on individual workouts, the Fitbit often gives you a superior reflection of your health habits compared with other tools.
For example, the “miles traveled” reported on the dashboard represents an estimate of all the mileage accumulated through the day, including walking to get the mail and climbing the stairs to fetch your raincoat. It even seems to pick up the greater effort expended when you stand rather than sitting at your workstation.
According to recent research described in a cardiology journal,2 even people who work out most days do not benefit from this activity when they spend the rest of their time prone in front of screens (TVs, computers, video games, etc.).
Figure 2-3 shows a nice chart on the bottom left part of the dashboard indicating the activity patterns throughout the day.
Based on this chart, you could draw the simple conclusion that you needed to take short walks at the start and end of each day. Every step counts, and that’s valid from a metabolic-health standpoint. Figure 2-3 shows the pattern of spikes (the number of steps or equivalent exercise) during my day from an easy mountain-bike ride, a walk downtown for middle-of-the-day errands, and a basketball shoot with my son at dusk.
Note
The Fitbit does not capture non-step-related activities like biking or resistance training (beyond the general movement involved in getting on, off, and around a bike, for instance). But you can manually log these activities and thus include their caloric expenditure (the Fitbit will overwrite that segment of time with your own values for calories burned). See the sections on Endomondo and Fitocracy for discussions of capturing and logging certain sports like cycling and weightlifting.
As mentioned earlier, all of these tools have an odd but unmistakable “tail wagging the dog” effect—they tend to increase your movement and inclination to exercise, rather than solely recording and displaying your activities. You might find yourself thinking, “I’m going to walk to work today so I can bump up my Active Score. I’ll try to break my time record from yesterday.”
You can log many aspects of your lifestyle with Fitbit, thus adding to the benchmarks you set. You can also create your own variables to track (e.g., cups of coffee or beers consumed in a day). Figure 2-4 shows the tabs for food, activities (walking, biking, etc.), sleep, journal entries, and more.

The Food tab obviously allows you to keep track of calories burned and consumed, as well as a basic macronutrient ratio dealing with your percentages of carbs, protein, and fats (see Chapter 3 for more on food chemistry).
Logging all of these aspects is optional, but it gives you more ingredients for the tool’s rich interface. I actually think FitDay (www.fitday.com) is a better tool for logging food intake, which is generally a tedious and time-consuming, if often revealing, effort. See later in this chapter for a FitDay discussion.
Fitbit will give you an analysis of your sleep patterns if you wear the tracking device around your wrist while you sleep, using the provided wrist strap. I thought it might be useful to try this once, but the idea of the device tracking me while I slept gave me the heebie-jeebies, and since I already sleep well, regard that as an optional feature. It is neat, however, to look over a chart showing the patterns of your sleep.
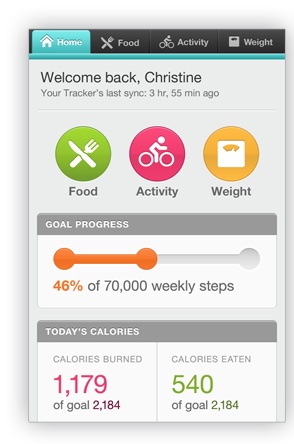
You can access Fitbit’s mobile version with your smartphone browser at m.fitbit.com. It’s not an app, but a mobile website: a manner of accessing the rich interface on a smaller screen, as shown in Figure 2-5.
The Fitbit interface has a Community tab that gives users access to various forums where they can interact with other users. The interactive features can be as simple as emailing a web page showing your dashboard or automatically posting the data to other sites like Twitter, Facebook, WordPress, or Microsoft HealthVault.
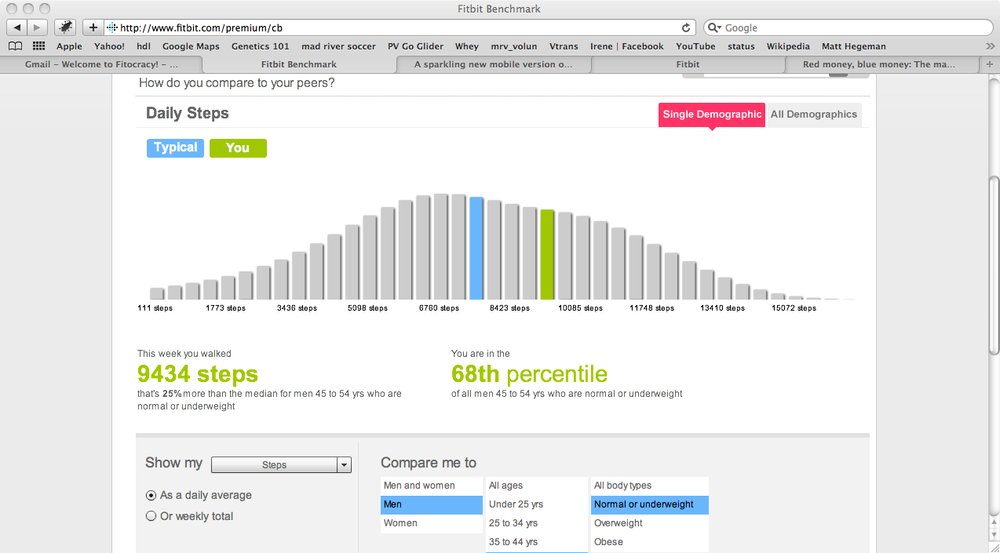
Like most of these web-based fitness services, Fitbit also has a paid premium service that provides views of your accomplishments against a benchmark of other users, using various demographics as a filter for the data. For example, I can compare my exercise patterns against those of other men my age. Figure 2-6 shows a Fitbit bar chart from the premium service.
Fitbit has an application programming interface (API) for outside developers or geeks who simply want to access their own data for coding: http://dev.fitbit.com.
This code uses a Java API called Fitbit4J, but it also includes APIs for PHP and .NET, for instance. Developers first have to register with Fitbit (at dev.fitbit.com), and they receive via email authentication codes to use with their applications.
The API design is a RESTful web service that uses an open source security protocol called oauth. This process involves making HTTP requests for the Fitbit data, after first satisfying an authorization step by sending along the credentials the developer obtained from the Fitbit developer site.
Note
You have a “consumer key” and a “consumer secret,” both long hexadecimal numbers that look like 0f92959d8bc4483cda7bce0074dc26bc.
There’s a good tutorial on using RESTful web services with oauths at http://developers.sun.com/identity/reference/techart/restwebservices.html.
One possible use for the API is grabbing your Fitbit data and mashing it up with data collected on another online fitness database, like Endomondo.
The Endomondo Sports Tracker is a free smartphone or Blackberry app that records your sports workouts and links the data to its website (www.endomondo.com).
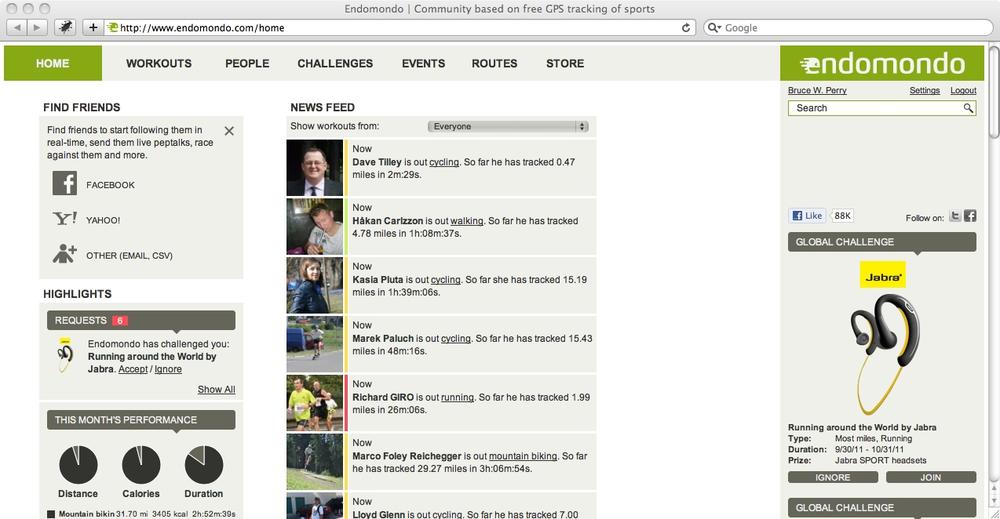
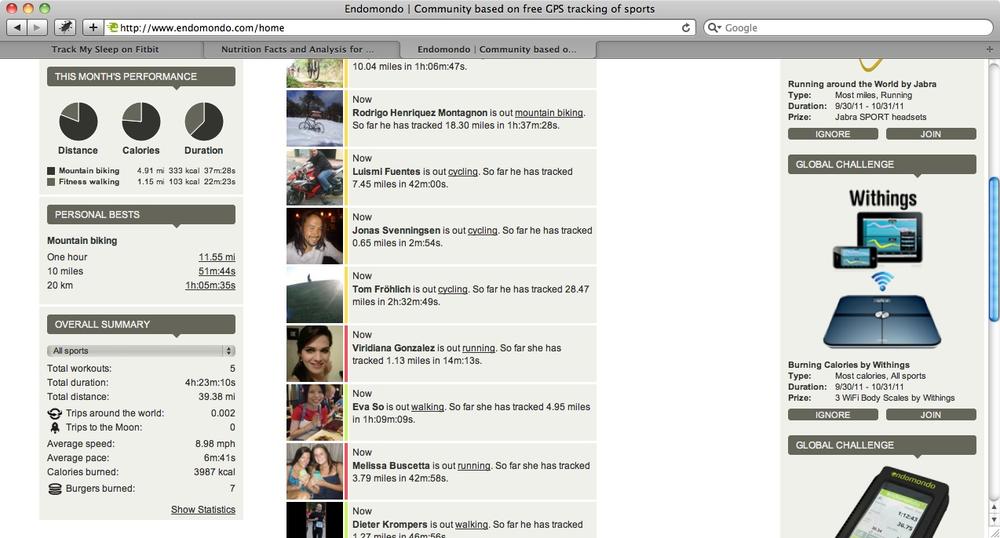
On the Endomondo website, you can share your data and interact with other users. Endomondo has its headquarters in Denmark. Figure 2-7 shows what the home page looks like once you’ve logged in.
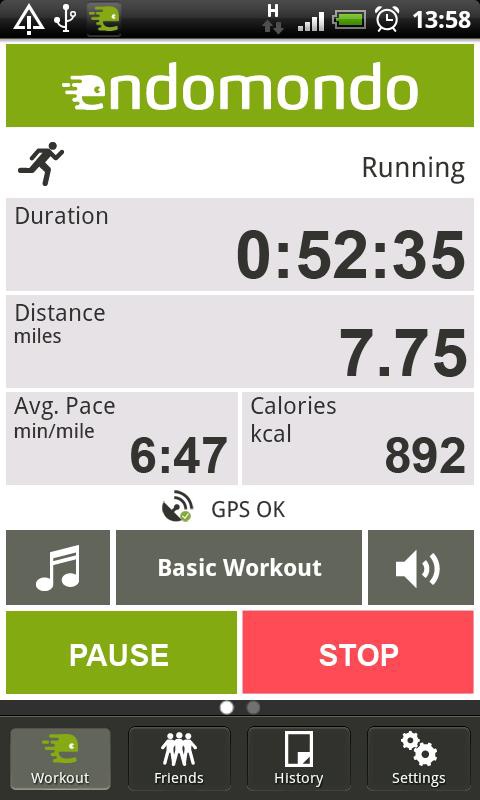
Here’s how the app works, using an example of a recent mountain-bike ride. You install the free or Pro version of the mobile app on your phone (it’s available for Android, Blackberry, and the iPhone). Before you begin your workout, you fire up the app on your device and, using its interface, choose the type of sport (e.g., running, fitness walking, cycling). Then you start the timer to log your workout. Figure 2-8 shows the phone app interface.
Off I go on my mountain bike, heading for the open road with a few dips into the forest.
Note
Hit the “countdown” button, and a voice counts down from five or however you set it, then says “Free your endorphins!” I like that amusing feature; during the countdown, I shove the phone into a coat pocket and step into the pedals. You can configure the length of the countdown in the app’s settings.
The Endomondo app uses your phone’s GPS capability to track the fitness event so that it can give you dynamic mileage updates and map the workout later. As you ride along, your phone emits a pleasant voice each mile: “You’ve reached mile 10 in 51 minutes; last mile five minutes nineteen seconds...”
If your phone is capable of immediately uploading the training session to Endomondo’s website, your friends and everyone else hooked into the site can see that you’ve hopped on a bike, pulled on your running shoes, or whatever, and headed out onto the trail or pavement.
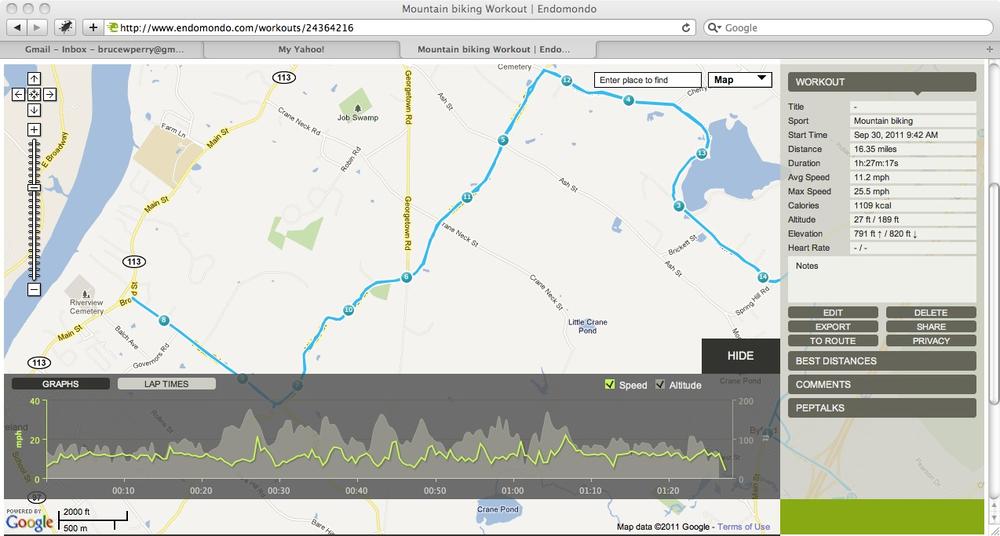
The statistics, along with the audio feedback during the workout (which can include “pep talks” from your friends), are handy and fun. Figure 2-9 shows the map and statistics from my bike ride. The app uses Google Maps with interactive features to show your pace at each mile.
You can export these workouts in the GPS Exchange format (.gpx files) and Garmin’s XML format, called TCX (.tcx files).
These formats represent different types of XML files that contain route, waypoint, and other GPS- and fitness-related data reflected by a mapped workout. The following site provides you with the XML schemas for several XML formats that are used by Garmin, Google Earth, and other tools (including GPX, TCX, and KML files): http://developer.garmin.com/schemas/.
To output an Endomondo workout as XML, click the Export button at the bottom right of the page, as shown in Figure 2-9.
What can you do with the data? Well, you can import it into another device or piece of software that supports the file type, or use XML-processing code to make additional kinds of software out of it (see the Import Your GPS File into Google Earth sidebar).
Here’s a chunk of XML code from a .gpx file, for instance. This code encapsulates a couple of track points, or latitude/longitude points with an elevation and timestamp, from a mountain-bike ride:
<trk>
    <src>http://www.endomondo.com/</src>
    <link href="http://www.endomondo.com/workouts/ipPaf00Cq48">
      <text>endomondo</text>
    </link>
    <type>MOUNTAIN_BIKING</type>
    <trkseg>
      <trkpt lat="44.138008" lon="-72.884608">
        <time>2011-10-02T16:19:59Z</time>
      </trkpt>
      <trkpt lat="44.138008" lon="-72.884608">
        <ele>478.1</ele>
        <time>2011-10-02T16:20:03Z</time>
      </trkpt>
    </trkseg>
</trk>Another spiffy region of the Endomondo home page is the lower-left hand corner, an ongoing aggregation of the highlights of your recorded workouts. It’ll tell you how many burgers you’ve burned, how many times you’ve circumnavigated the globe, and how many trips you’ve taken to the moon (since I’d just began with Endomondo, I had only traversed the equator the equivalent of 0.002 times). Figure 2-10 shows this portion of the screen.
Many fitness-tracking tools take a “more is better” approach (gotta get around the earth a second time!), but, as we’ll discuss in Chapter 9, overtraining is not necessary to get both strong and healthy. In fact, years of overtraining can lead to ill health.
Note
A common metaphor to use when representing strength training, for instance, is “digging a hole and filling it in.” When you task the muscles with hard, consecutive, high-intensity training sessions, you’re digging the hole deeper and deeper, but never giving your body the necessary rest to initiate the training adaptations, or the “filling in,” of the hole.
One of the strengths of Fitbit and similar tools is that you can choose to track anything, such as rest days and less intense sessions. Then you can assess how your strength gains and energy levels correspond with the number of rest days and/or easy sessions.
Fitocracy (www.fitocracy.com) is another sports-tracking tool, as well as a community with interactive features. It has the additional benefit of providing better support than others in the areas of resistance training and body-weight exercises.
Along with tracking your training data, Fitocracy is built around an award system where you earn points for each exercise bout and eventually work your way up to different levels. According to its own getting started guide, “Fitocracy is a game you play to improve your fitness.”
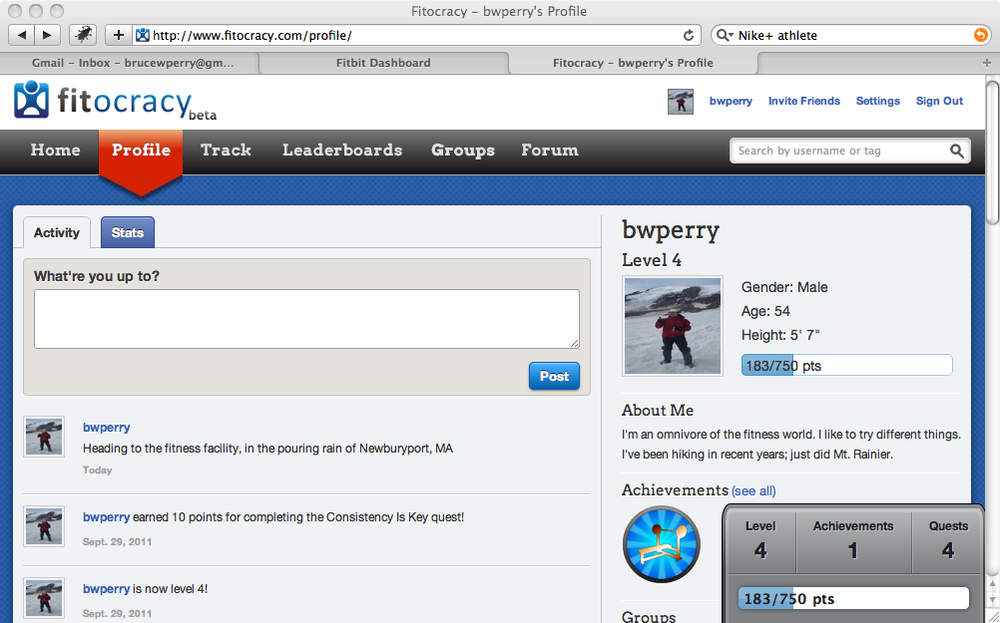
It seems to be designed to initiate friendly competition against your friends or yourself, similar to the model of computer gaming, but with a decidedly fitter result. Figure 2-11 shows a profile for a Fitocracy beginner.
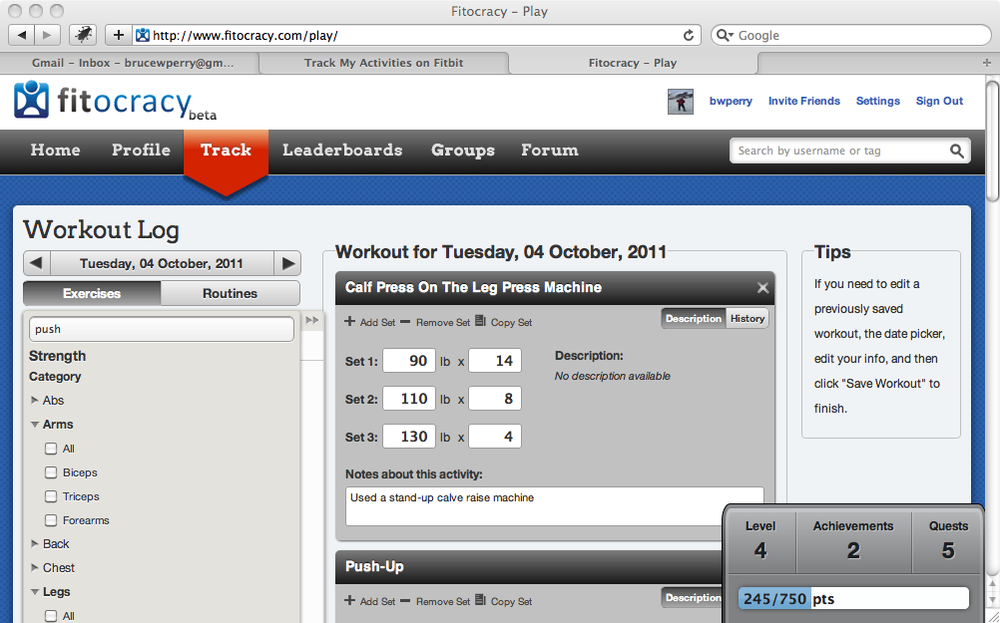
It is admittedly complex to input resistance-training sessions, with all the different techniques, sets, and repetitions. Fitocracy is one of the few online tools that has a rich interface for logging weightlifting, which should help the company down the line as resistance training becomes de rigeur for many athletes (more on this in Chapter 8).
Fitocracy’s rich interface includes handy tips for describing dozens of different resistance-training routines.
Figure 2-12 shows a screen for entering a weightlifting workout that includes body-weight exercises like pull-ups and push-ups.
You can click back and forth between training sessions on different days, as well as view a history showing when you did a particular routine before. You can log any kind of exercise activity, however, and Fitocracy autogenerates a window with suggestions, making it easy to pop up a logging window that’s customized for that particular sport.
Of course, none of these sites would be complete without community features. Fitocracy has groups, a forum, a “leaderboard” showing all the point-hoarding honchos, and a feature for following other people. It doesn’t seem to have a way of exporting the data yet, but it was still a beta version at the time of this writing. Fitocracy does have a mobile version, allowing you to produce a smartphone in the gym and instantly record your recent grappling with the barbells or free weights.
Note
See Chapter 8 for a bit more on the Fitocracy mobile app, as well as on weightlifting in general.
Garmin Connect (http://connect.garmin.com) is the web portal you will use for any Garmin GPS tracking tool. The Garmin device (in this case a Garmin Forerunner 301) connects to your computer via a USB connection cable, as Figure 2-13 shows.
You have to download and install the “Communicator Plug-in” software for your PC or laptop so that your plugged-in hardware device can talk to Garmin’s web-based software, which includes the dashboard showing your device’s captured activities. For details, see http://www8.garmin.com/fitness/getting_started_communicator.jsp.
Any one of the activities you have recorded on your Garmin watch or other device can be viewed in detail by navigating from the dashboard (at http://connect.garmin.com/dashboard). If you’re interested in the maps and stats for a particular workout, such as time, distance, elevation gain/loss, and pace, this data is available from the following link: http://connect.garmin.com/activities.
Figure 2-14 shows the stats for a hiking activity in the Alps, with all the juicy details (the screen capture does not show some additional graphics, which include separate charts describing pace and elevation over a timeline).

One of the niftier Garmin Connect features is the Player, which is one of the choices you can select when you are viewing the specifics of a fitness activity captured on your device. This Adobe Flash tool allows you to replay the workout from within the map embedded in your browser window. Figure 2-15 shows the Player tool.

Garmin Connect has many other features that help you manage the data from your devices, including the ability to export XML files describing the routes.
Note
Chapter 7 discusses the GPS Exchange Format(GPX), an XML language for outputting and saving routes from GPS-enabled devices.
We’ll cover a number of other sports-related apps in the fitness chapters, including GAIN Fitness (http://gainfitness.com) in Chapter 8 as well as the Backpacker GPS Trails pro app (http://backpacker.com) and Alpine Replay (www.alpinereplay.com) in Chapter 7.
The rest of this chapter introduces a couple of nutrition tools on the Web, as well as an example of a connected device—you use the device at home, and the data is sent to a website or to other software tools. It’s called the Withings body-composition scale. Yes, you heard that correctly—your bathroom scale (this one, on steroids) can capture your data and wirelessly send it to a website.
We looked at NutritionData (www.nutritiondata.com) a bit in Chapter 1. This section will point out a few more interesting aspects of this tool. If you’re already a NutritionData honcho, feel free to move on to the brief discussions of FitDay and the USDA Nutritional Database that follow.
For the sake of our discussion, initiate a search on mussels (the shellfish, not the ones you flex in front of a mirror): http://nutritiondata.self.com/facts/finfish-and-shellfish-products/4187/2. The screen in Figure 2-16 has a graphic for “Caloric Ratio” showing the macronutrient ratio for the food.
Note
NutritionData also gives values for “Glycemic Load” and “Inflammation.” You basically want to keep the number on the left down (as in, foods that tend to spike blood-glucose levels and thus the hormone insulin and are therefore high glycemic), and increase the right hand number (reduce inflammatory foods, which in this tool means avoiding negative numbers).
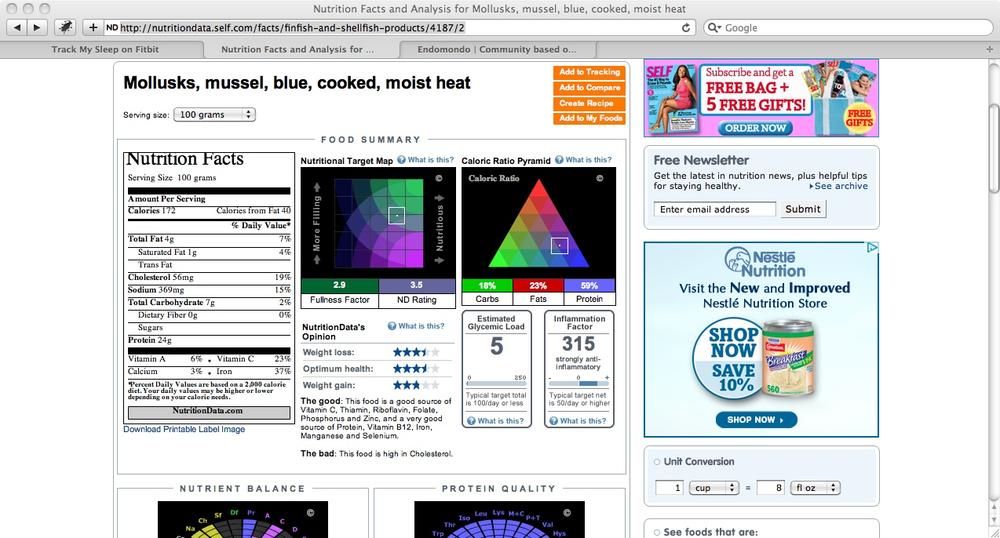
A macronutrient ratio represents how the food content is divided up by percent of calories into carbs, fats, and proteins. Mussels, for example, are 18 percent carbohydrates, 23 percent fats, and 59 percent protein.
This feature gives you a snapshot of the nutritional content of the food (along with the nutrition label showing about 24 grams of protein in a fairly small serving of mussels). So we know that mussels are a great source of protein, but what about fats or micronutrients?
If you scroll down to the regions representing fats, vitamins, and minerals (Figure 2-17), the data on mussels offers some pleasant surprises. This shellfish portion contains a lot of vitamin C for a protein-rich food (almost 14 grams; hey, more than enough to stop you getting scurvy!), as well as about four times as much vitamin B12 as you would need in a day.
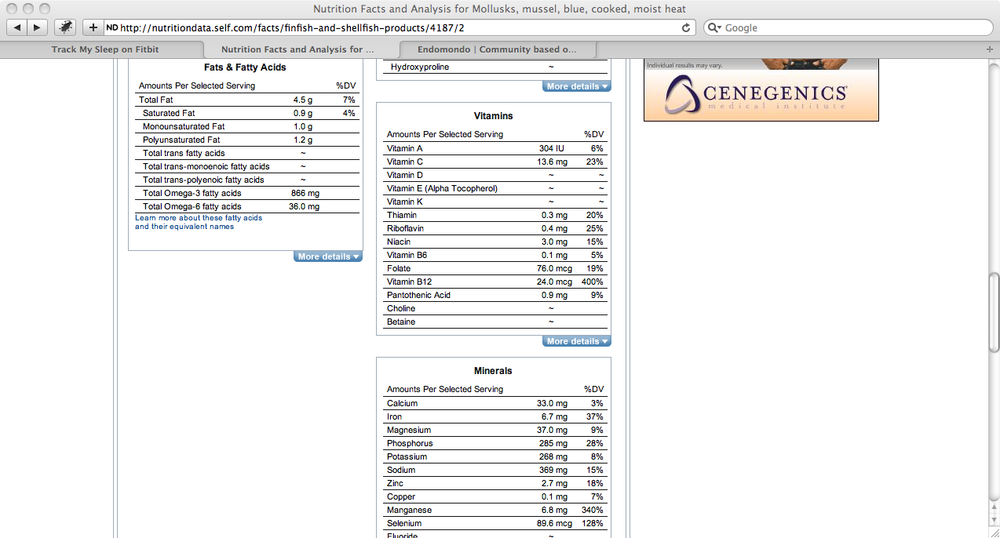
Mussels are also a great source of selenium, manganese, iron, and other minerals (see Chapter 4 on micronutrients). Check out the Fats & Fatty Acids box too; mussels have an Omega 3 to Omega 6 ratio of 866 mg to 36 mg, or about 24:1. This means that a small portion of mussels gives you almost a gram of Omega 3 essential fatty acids, which are generally considered a health food in moderate amounts. Our modern diet contains way too many Omega 6 fats compared to Omega 3s; see Chapter 3, for a discussion of these ratios.

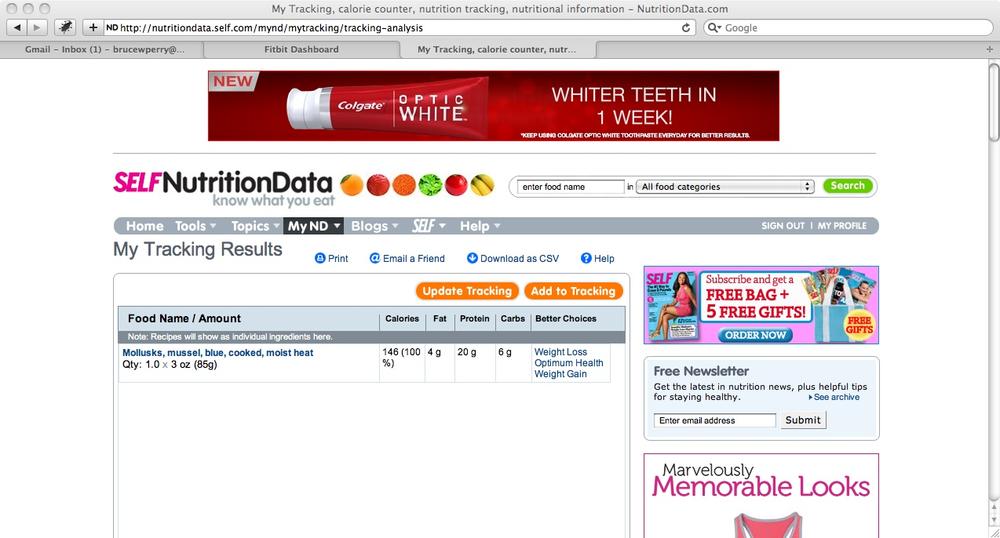
NutritionData also has a self-tracking feature under the MyND section of the site. After registering, you can track and analyze the nutritional content of certain foods, as shown in Figure 2-18. Let’s say you want to brag to your friends about how nutritious mussels are (thus increasing your weirdness quotient in their eyes). Tracking removes the need to continually search for the same food items.
FitDay (www.fitday.com) is one of the better tools around for tracking your diet and its underlying nutrition, or lack thereof. We’re going to look at FitDay again in Chapter 3 and Chapter 4, but this section serves as an introduction.
FitDay is useful for the periodic tracking of a whole or partial diet to get a snapshot of its macro- and micronutrient content.
Note
FitDay differs from NutritionData in this respect by analyzing numerous foods at once—an entire day’s worth of eating—rather than single portions or ingredients.
Conveniently, FitDay saves the foods you’ve entered before, which makes the otherwise tedious data entry go quicker the second time around. Figure 2-19 shows the table produced from a partial day’s food intake. Each day you enter your food intake is saved in a calendar for later retrieval.

This shows you exactly where all your carbs, fats, and proteins are coming from. “So what?” you might ask. Do we really have to obsess over our “macronutrient ratios”? In most cases, no. But an associated micronutrient profile can be very useful and revealing.
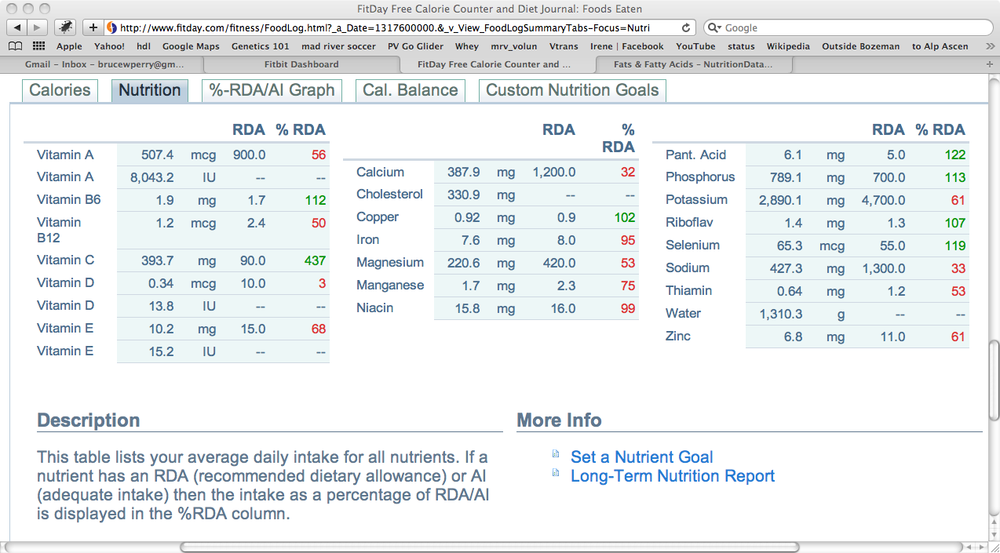
FitDay can drill down into a complete vitamin and mineral profile for the assemblage of food you just chowed down on and recorded, as depicted in Figure 2-20. Although bioavailability—how much of the consumed nutrient, like vitamin C or selenium, actually reached its target tissue—is a complex issue, it seems conceivable that this data will be reasonably accurate, given that you consumed the nutrients as food, not a pill.
This kind of data can make a recommendation such as “maintain a potassium:sodium (P:S) ratio of at least 4:1” more concrete and thus easier to grasp. You know the foods represented in Figure 2-19 gave you a P:S ratio of 2,890 to 427, or about 6.8 to 1.
What if you just want to know what a single serving like “bagel smeared with jelly and margarine” is doing for you? No sweat, as shown in the micronutrient profile depicted in Figure 2-21.

The figures in red mean that the food is beneath the Recommended Dietary Allowance (RDA) for that nutrient (see Chapter 4). We’ll give you the benefit of the doubt—you’ll make up those deficits with meals later in the day.
The dressed-up wheat bagel is high in sodium and fairly deficient in nutrients, for a 614-calorie snack (300 of those calories coming from the bagel and 188 from the 1.5 tablespoons of margarine and jelly—we promised “smeared”!). When you’re scarfing down that many calories, you usually want to get more bang for the buck in terms of nutrients.
Many of the nutrition tools on the Web use the data from the USDA National Nutrient Database: www.nal.usda.gov/fnic/foodcomp/search/. This is a no-frills website where you can initiate searches, as shown in Figure 2-22, and/or download the entire database.

Instead of searching this database, which is cut-and-dried, we’ll show another cool way of acquiring data from this site.
Let’s say you want to discover the best food sources of selenium, an important antioxidant mineral source (you’ll show more than a casual interest in minerals and antioxidants after reading Chapter 4!).
Go to this URL: www.ars.usda.gov/Services/docs.htm?docid=22114. Scroll down to selenium, then click on the “Sorted by Nutrient Content” option.
The application automatically generates a PDF file that lists, in descending order, the best food sources of selenium (Figure 2-23). Please pass the Brazil nuts!

You can download an updated version of the National Nutrient Database itself (in a ZIP file), then import the numerous data files into whatever database management system you’re using, such as MySQL.
Here’s the link for downloading the database: www.ars.usda.gov/Services/docs.htm?docid=22113.
If you’re in a very scholarly state of mind, you can search for the latest academic journal articles on PubMed (http://pubmed.com) or Google Scholar (http://scholar.google.com).
PubMed includes “21 million citations for biomedical literature from MEDLINE, life science journals, and online books.”
You can often access the entire article for free; at other times, free access is limited to the journal abstract. Figure 2-24 shows a result from searching on the Boolean expression “resistance training AND oxidative stress.” Typically, the upper-righthand corner of the page containing the abstract provides any available links to the full-text version.
It’s irritating, to say the least, to find an intriguing new journal article, then click on the link and discover that the publisher wants $30–$60 to read anything but the abstract. That makes it pretty hard for a student, or simply a health-conscious geek, to undertake interesting research. If you run into this problem, your college or town might have a library subscription, for instance, to an online journal-retrieval system like EBSCO that you can use for free.
Google Scholar provides similar access to scholarly and academic articles on nutrition and fitness studies. Sometimes you can search on an article title to determine if the full text of the study is available, as shown in Figure 2-25.
Note
You may want to bone up on the differences between good and bad science if you’re going to become a PubMed or Google Scholar geek. This article represents a good summary: http://news.yahoo.com/difference-between-good-bad-science-read-scientific-studies.html.

A mounting trend for geeks and techies in the sports world is the use of arrays of connected sports gear and websites. First the gadgets capture particular athletic-training events like running, biking, Nordic skiing, and hiking, then the service broadcasts the data to several places.
Note
In many ways, this integration represents the inclusion of your fitness or health routine in “the cloud.” Cloud computing in general lets you initiate more of your IT tasks, including saving and retrieving data, using devices such as smartphones and laptops that are all connected together and interrelated on the Internet.
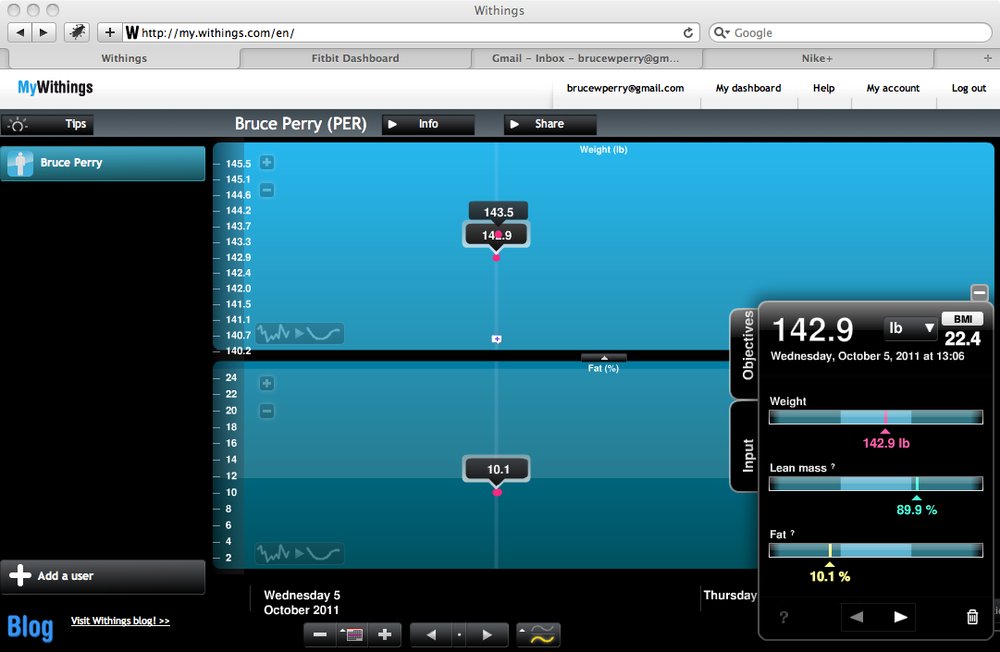
Many sports-gear manufacturers are taking this route, such as Garmin Connect and the Nike+ program (see http://nikerunning.nike.com/nikeos/p/nikeplus/en_US/plus/). We’ve already described Fitbit in great detail. Another device that has been integrated with Fitbit’s data is the Withings body-composition scale. This is a scale that wirelessly connects to a website and uploads the data from the scale. Withings also makes a blood-pressure monitor. I guess you would call this an example of “e-health.”
Figure 2-26 shows the Dashboard at http://my.withings.com/en/, once you have registered as a user and, of course, bought and configured the device.
Note
To get started, you’ll have to go to http://start.withings.com and download some pairing software (as in, pairing up your computer and the scale). You have to connect the scale to your computer using a USB cable. The scale then recognizes the wireless network your computer is using so it can independently connect with the Web later and wirelessly upload its data.
What’s more, Fitbit and other online communities such as Twitter, TrainingPeaks, and Google Health can also access the data from Withings and incorporate it into their own data and displays.
Note
All of this is configured within a Sharing preference on the Withings dashboard—your information isn’t just blindly sent out to the world.
A body-composition scale measures not just weight, but body fat percentage. Your lean mass is the nonfatty tissue part of your body—the bones, muscles, and organs.
Note
Muscles also contain fats in the membranes of cells, as well as a relatively large amount of fat that they can call upon for burning as fuel. In addition, internal organs have fats in their cell membranes, and are cushioned from body blows by adipose tissue.
Your body fat percentage defines the part of the body that is not lean mass. It is often a more relevant detail of your physical fitness than Body Mass Index (BMI), which is skewed in people who are more muscular—they have a higher BMI, but it’s reflective of more muscle than fat.
The Withings scale is pricey, at about $160. You can buy a Tanita body-composition analyzer, a device that also uses electrical impedance technology but without the web connections, for about half that amount, or you might choose to share one of these devices with your friends or teammates.
Note
I suppose it’s cool that you can do it, but do you really need to broadcast your weight, body composition, or blood pressure everywhere? Some might find it motivating, to know that others can track their progress; it builds in another level of accountability and motivation.
Electrical impedance technology sends a tiny electric current through your body when you stand on the scale (don’t worry, it’s not dangerous!). Using an algorithm, the scale measures the feedback from this electrical current to estimate muscle vs. fat tissue. It’s only a rough estimate of your body composition percentage. Numerous factors affect the results these devices spit out, including where you place the scale, how you stand on it (including whether you’re in the buff or not!), and even the time of day and whether you’ve recently exercised. Your body composition doesn’t change drastically week by week, so don’t obsess over wildly fluctuating numbers. Just aim for a general trend. It’s worth it to pay attention to your body composition; it’s a much better reflection of health than a static weight measurement.
Training Your Brain: Lumosity
Our roundup in this chapter wouldn’t be complete without a discussion of a brain-training tool. Recent neuroscience research has shown that the brain is not stuck as a static anatomical entity from birth and early development, as once thought. The brain can be strengthened and made more robust with exercise (of a cerebral nature, that is), similar to a muscle.
The fancy term for this is “neuroplasticity.” According to http://en.wikipedia.org/wiki/Neuroplasticity, neuroplasticity:
...is a nonspecific neuroscience term referring to the ability of the brain and nervous system in all species to change structurally and functionally as a result of input from the environment. Plasticity occurs on a variety of levels, ranging from cellular changes involved in learning to large-scale changes involved in cortical remapping in response to injury...
Lumosity (www.lumosity.com) is a popular online training tool that involves implementing exercises and games. The games are personalized based on the goals that you specify, e.g., improved memory, processing speed, or spatial recognition.
It’s fun to use and as you progress through your customized program, the site builds a Brain Performance Index (BPI). This score is a reflection of how well you do in the games and your cognitive strength as you pump it up over time.
As the company describes it:
Each time you play, we update your BPI to accurately reflect your current brain performance... Your Overall BPI is your average BPI across each of the five cognitive areas: attention, memory, speed, flexibility and problem solving” (www.lumosity.com/blog/bpi-brain-performance-index/).
With the “teaser” free trial, you can try out Lumosity games without the running tally of your BPI or the ability to compare it with that of other users. A fairly pricey premium version for brain games gives you these features and more. Or, you could just begin learning a new foreign language (Spanish, German, or Mandarin, anyone?).