The previous chapter showed that firms experience diminishing marginal product in the short run. This diminishing marginal product implies that the marginal cost of producing additional units of output is rising. An upward-sloping marginal cost curve is an important concept because it allows us to understand something called the law of supply.
CHAPTER OBJECTIVES
After completing this chapter, the student should be able to:
1. Explain how the upward-sloping marginal cost curve serves as the basis for the upward-sloping supply curve.
2. Understand how several determinants of supply can shift the supply curve outward or inward.
3. Compute and interpret the price elasticity of supply.
You might recall from Chapters 1 and 2 that economists assume that consumers make choices at the margin. On the consumer’s side, this means that if the marginal benefit of consuming the next unit is greater than or equal to the marginal cost of that unit, the person will consume it to increase his utility. The same kind of choice is available to the producer who is considering the production of the next unit. If the marginal benefit (for the supplier, that would be the price that it receives) of producing that unit is greater than or equal to the marginal cost of producing it, the firm will produce that unit, and the profits earned by the firm will rise.
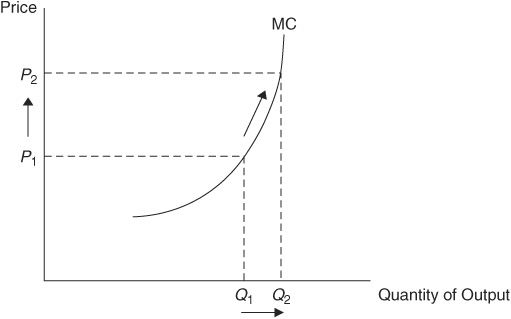
Figure 5-1 shows an upward-sloping marginal cost curve for a firm. At the current price P1, the firm has found it optimal to produce quantity Q1 because that is where the price equals the marginal cost. However, suppose the price rises to P2. The firm will then realize that, at the current production level Q1, the price is now greater than the marginal cost. In fact, this is true for all additional units up to Q2, so the firm will increase output upward along the marginal cost curve. Had the price fallen, the firm would have made the rational choice to produce fewer units by moving downward along the marginal cost curve. This behavior allows us to predict a positive relationship between the price of a product and the quantity of that product produced by firms.
FIGURE 5-1 • Upward-Sloping Supply Curve
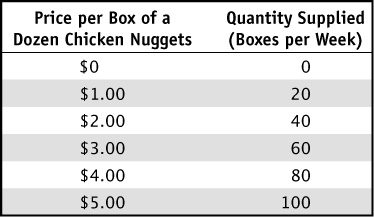
The law of supply says that if we hold all other factors constant (ceteris paribus), an increase in the price of a good will cause suppliers to increase their production of that good. Suppose that Margaret is a supplier of chicken nuggets who can produce boxes of nuggets that contain 12 nuggets in each box. Table 5-1 shows the quantity of nuggets that she will supply at a variety of prices. The law of supply is seen in the table because she chooses to increase her quantity supplied only at higher prices, and at lower prices she will reduce the quantity she supplies.
TABLE 5-1 Margaret’s Supply of Chicken Nuggets

When we convert the data seen in Table 5-1 into a graph, we create an upward-sloping supply curve. Figure 5-2 illustrates Margaret’s weekly supply of chicken nuggets, and again we see that when the price rises, her quantity of nuggets supplied rises along the supply curve.
FIGURE 5-2 • Margaret’s Supply of Chicken Nuggets
There are many factors (or determinants) that might affect Margaret’s supply of nuggets. The law of supply holds all other determinants constant and focuses on the impact of price on her production. When we allow the determinants to change, we see changes in the location of the supply curve.
In Chapter 3 we discussed how demand curves can shift rightward or leftward in a graph when certain demand determinants change. Supply curves can also shift to the right (an increase in supply) or to the left (a decrease in supply) as a result of a change in a small number of supply determinants. Figure 5-3 shows an increase in supply as a shift from curve S0 to S1. When this occurs, suppliers like Margaret will be willing to supply more units to the market at any price. A decrease in supply is shown as a shift from curve S0 to S2. In this case, the quantity that producers are willing to supply has fallen at all potential prices.
FIGURE 5-3 • Shifts in the Supply Curve
Economists usually describe the following as determinants of supply:
Producers must employ inputs (or factors of production) to supply their final products. When an input becomes more expensive to employ, it becomes more costly to produce each unit, and the supply curve will shift to the left, or decrease. If the price of an input decreases, the supply curve will shift to the right, or supply will increase. For example, if the price of chicken increased, Margaret’s supply curve would shift to the left because it would now be more costly to produce chicken nuggets.
Producers all use some level of technology to produce their goods and services. It may be rather simple, like that used to wash windows, or it may be quite complex technology, like that used in the development of Microsoft’s Windows software. If available production technology improves, perhaps through faster machinery or better communications, it makes it easier for firms to supply goods and services, and we will see supply curves shift to the right. For example, if Margaret had faster machines that could package more nuggets in a day, she would be able to supply more boxes at any price, and her supply curve would shift to the right.
Firms can often produce several different products for sale to consumers, and they will alter their production plans if one of these products becomes less lucrative than the others. For example, suppose that Margaret, in addition to chicken nuggets, can also produce fish sticks. If the price of fish sticks is rising, Margaret will earn more money if she decreases the supply of chicken nuggets and increases the quantity of fish sticks that she will supply. Graphically, the supply curve for chicken nuggets is shifting to the left, but the supply curve for fish sticks is not shifting; there is simply an upward movement along the supply curve at the higher price of fish sticks.
Producers, like consumers, respond to expectations of future prices. For example, the producers of lawn chairs know that demand for these items increases in the summer months. Consumers are willing to pay higher prices for lawn chairs in the summer, so producers decrease the supply of lawn chairs in the winter when demand, and price, is lower. If firms expect the future price of a product to be higher, they will decrease the supply of that product today.
When more firms are engaged in the production of a particular good, the total supply of that good begins to increase. The supply of chicken nuggets will be greater if several firms enter the market to compete with Margaret’s product. In this case, the market supply curve for chicken nuggets shifts to the right.
The law of supply tells us that, all else held constant, when the price of a product rises, firms increase the quantity of that product that they supply. The price elasticity of supply gives us more information by telling us how responsive quantity supplied is to that change in the price.
Mathematically, the price elasticity of supply is defined as the percentage change in quantity supplied divided by the percentage change in the price, or

For example, if the price of gasoline increases 10 percent and the quantity of gasoline supplied increases by 5 percent, the calculation is simply  . In this example, supply is inelastic because the increase in the quantity supplied is smaller than the increase in the price. Any elasticity that is less than 1 is an inelastic supply response to a change in price. The least elastic, or perfectly inelastic, supply curve is a vertical supply curve. In this special case, a change in price would have no effect on the quantity supplied and the price elasticity of supply is equal to zero.
If the price of chicken nuggets increases by 10 percent and the quantity of nuggets supplied increases by 20 percent, the price elasticity of supply is equal to 2. Any elasticity greater than 1 describes an elastic supply response. The most elastic, or perfectly elastic, supply curve is one that is drawn as horizontal. In this special case, any small change in price would cause a huge response in supply, and the elasticity would be infinitely large.
As in the analysis in Chapter 3, we can use two overlapping supply curves to show how different elasticities affect the shape of supply curves. Figure 5-4 shows curve Se as nearly horizontal and the curve Si as nearly vertical. Suppose that the price for both of these goods is initially at P0 and firms are producing the same quantity of each good, Q0. If the price increases by 10 percent, the quantity supplied rises by many more units along supply curve Se than it rises along supply curve Si. We can see that, all else equal, steeper supply curves will exhibit less elastic responses to a given price change.
FIGURE 5-4 • Effect of Elasticity on Quantity Supplied
In Chapter 3 we introduced the price elasticity of demand and the midpoint method of computing the elasticity between two points on the demand curve. The same thing can be done for the price elasticity of supply between two points on the supply curve. Using similar notation to that presented in Chapter 3, the midpoint formula would look like

Economists generally assume that price elasticity of supply is influenced by a couple of factors.
A firm can increase output quickly in response to a higher price if more inputs can be quickly employed. For example, suppose that Margaret’s chicken nuggets factory operates only one production shift, from 8 a.m. to 5 p.m. If the price of chicken nuggets begins to rise, Margaret doesn’t need to build a new factory; she can simply employ more workers to work a night shift. If she can do this easily, her price elasticity of supply may be large. If a firm cannot find more inputs easily, or if those inputs are quite expensive to employ, the price elasticity may be smaller. The same would be true if there were no good ways to substitute machines for those workers. For example, suppose that it was impossible to find enough workers, but it was possible to find nugget-making machines that could do the same job as those workers. In this case, Margaret’s elasticity of supply would be elastic and she could produce more nuggets at the higher price.
The price elasticity of supply is typically larger when firms have more time to respond to changes in the price of the product. For this reason, supply curves will be more elastic in the long run than they are in the short run. Suppose that Margaret’s chicken-nugget factory is already working 24 hours a day with three production shifts. If the price of nuggets continues to rise, she may be unable to increase the quantity supplied this week, so her short-run price elasticity of supply could be very low. A year from now, when she has built a new factory, she will be able to double her production and her price elasticity of supply will be much larger.
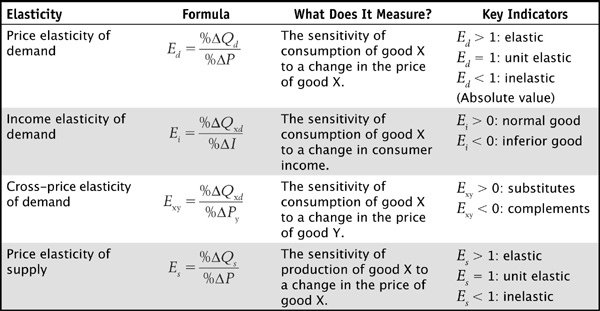
It seems like there are many elasticities to remember, so it might be helpful to review Table 5-2, which provides a quick summary of what each elasticity tells us. Keep in mind one similarity among all elasticities: they all measure the sensitivity of one variable (like quantity demanded or quantity supplied) to a change in some other variable (like a price or income). If the response is relatively big, we say that it is an elastic response, and if it is relatively small, we say that it is an inelastic response.
TABLE 5-2 Summary of Elasticities

This chapter began by demonstrating the key relationship between the upward-sloping marginal cost curve from the previous chapter, the upward-sloping supply curve, and the law of supply. As the price of a good rises, firms will see that they can profit by increasing the quantity of the good that they supply to consumers. There are also several supply determinants that, when changed, can shift the supply curve either to the right or to the left. Finally, we revisit the concept of elasticity by introducing the price elasticity of supply. In the next chapter we combine demand with supply to build the model of a competitive market.
Is each of the following statements true or false? Explain.
1. The law of supply is really a result of diminishing marginal returns to production.
2. If the price of corn chips falls, suppliers will increase the quantity of corn chips supplied.
3. An outward shift in the supply curve for soybeans means that, at any price, firms will increases the quantity of soybeans supplied.
4. As more time passes after a change in the price, supply curves become less elastic.
Give a short answer to the following questions.
5. When the price of a pound of bacon is $3, suppose that a local farmer will supply 300 pounds of bacon. If the price falls to $2 per pound, the farmer will supply 200 pounds of bacon. Using the midpoint formula, calculate the price elasticity of supply.
6. Consider the supply of automobiles. What will happen to the supply of automobiles if steel, a key production input, becomes less expensive? In a graph, show any movements of the supply curve for automobiles.
For each of the following, choose the answer that best fits.
7. Consider the supply of televisions. If the price of televisions increased, we would expect:
A. The supply of televisions to shift to the right.
B. The supply of televisions to shift to the left.
C. An increase in the quantity of televisions supplied along the fixed supply curve.
D. No change in the supply of televisions.
8. Consider the supply of apple pies. If the price of a pound of apples rises, we would expect:
A. The supply of apple pies to shift to the right.
B. The supply of apple pies to shift to the left.
C. A decrease in the quantity of apple pies supplied along the fixed supply curve.
D. No change in the supply of apple pies.
9. Suppose the marginal cost of producing textbooks is constant and always equal to $80. This would imply that the supply of textbooks is:
A. Horizontal at a price of $80.
B. Downward-sloping between the prices of $80 and $0.
C. Upward-sloping between the prices of $0 and $80.
D. Vertical at a quantity of 80 textbooks.
10. Which of the following might cause the supply of chocolate chip cookies to be less elastic after an increase in the price of the cookies?
A. Cookie producers are now operating in the long run.
B. Cookie producers can ask their employees to work overtime at the bakeries.
C. Chocolate chips are currently unavailable because of a shortage of cocoa beans.
D. Sugar cane growers currently have had a huge crop, and there is a surplus of sugar.