1. B. |
A nation’s land resource is more than just the area of the nation’s territory; it also includes natural resources such as timber harvested from the land, minerals mined from below the land, and fish and shellfish that are caught from the offshore waters. Food is not one of the four economic resources (land, labor, capital, and entrepreneurship/technology). |
2. A. |
If Kelly studies for two hours, the opportunity cost is the most valuable thing that she gave up in order to study. She couldn’t both work as a babysitter and work in the campus library, so the most valuable thing she gave up is 2 hours of babysitting at $10 per hour. |
3. C. |
A consumer must decide whether the additional (or marginal) benefit received from that activity is greater than the additional (or marginal) cost incurred from the activity. When the marginal benefit is weighed against the marginal cost, the consumer is engaged in marginal analysis. |
4. D. |
Macroeconomic topics are centered on the national or international economy. The Ford factory in Louisville and the Motorola product are both microeconomic topics because they discuss one producer of cars and one producer of cell phones. The market for gasoline is a microeconomic topic because it discusses the price of a single product. The nation’s unemployment rate is a macroeconomic topic. |
5. C. |
Each soda has a price, or marginal cost, of $1.50. Since Sherman will receive $3 of marginal benefit from the third soda, he should buy it. He will not buy the fourth soda because the marginal benefit of $1 falls below the marginal cost. Adding a new column to the table and adding the marginal cost of each soda is a useful way to solve this problem. |
6. A. |
The equation for the budget constraint states that income (I) is equal to the total spending on good  plus the total spending on good plus the total spending on good  . The equation given for Josh’s budget constraint, . The equation given for Josh’s budget constraint,  , tells us that the price of a can of soup is $4. Thus, with $100 to spend, he could buy at most 25 cans of soup. , tells us that the price of a can of soup is $4. Thus, with $100 to spend, he could buy at most 25 cans of soup. |
7. D. |
For a combination to lie on the budget constraint, it must add up to $100. At $4 per can, 10 cans of soup amount to $40 of Josh’s income. At $20 per video game, 3 games add up to the remaining $60 of income. |
8. B. |
Total utility from consuming 3 slices of pizza is the sum of the marginal utility from the first slice (18 utils), the second slice (15 more utils), and the third slice (12 more utils). Adding a column of total utility and doing a running total for each row is a useful way to solve this problem. |
9. C. |
If there is no price paid for a slice of pizza, the consumer will stop eating pizza at the point where the marginal utility is equal to zero. Because marginal utility declines, the eighth slice of pizza will provide negative marginal utility, which would lower the consumer’s total utility. Even though the seventh slice provides zero additional utility, the important point is that it will not reduce his utility. |
10. C. |
A consumer maximizes utility when the marginal utility per dollar is equal for all goods. In this case, the ratio (marginal utilitycoffee)/pricecoffee must equal (marginal utilitybagels)/pricebagels. The marginal utility per dollar is equal to 5 for both goods, so Brody has already found his utility-maximizing combination of coffee and bagels. |
11. C. |
Cars and trucks are complementary goods with gasoline. When the price of these vehicles goes up, fewer cars and trucks are purchased. And when fewer vehicles are purchased, the demand for gasoline to power them also falls. Choice A is incorrect because a higher price of gasoline does not cause the entire demand for gasoline to fall, it causes only a decrease in quantity demanded. This would be seen in a graph as an upward movement along a fixed demand curve. |
12. A. |
The law of demand states that, all else equal, when the price of a good rises, fewer units of that good will be demanded. When Stan reduces his driving in the face of rising gasoline prices, he is exhibiting the law of demand. |
13. B. |
The price elasticity of demand is the percentage change in quantity demanded divided by the percentage change in price. We can use the following formula, with the information that we know, to solve for the component that is unknown:

Multiplying 1.5 by 5 percent gives us the answer of 7.5 percent. |
14. D. |
The cross-price elasticity of demand for peas is equal to the percentage change in quantity of peas demanded divided by the percentage change in the price of carrots. If carrots increase in price and the quantity of peas demanded increases, they must be substitutes. Dividing 4 percent by 2 percent gives us the cross-price elasticity of 2. |
15. A. |
Total revenue is equal to price times quantity demanded. When the price falls, we know that quantity demanded will rise. For total revenue to rise after a price decrease, it must be the case that quantity demanded increased by a greater degree. This tells us that the demand for laptops is price-elastic. |
16. D. |
A fixed input is a short-run input that does not change when output changes. For example, when more pizzas are made, more tomato sauce, more labor, and more electricity are needed. However, the size of the kitchen and dining room cannot be changed to sell more pizzas in the short run. |
17. B. |
Total costs are the sum of fixed costs and variable costs:  The variable cost of producing 0 units, TVC(0), will always equal zero, so the total fixed cost is the only cost that is paid when zero units of output are produced. Thus the total fixed cost of $100 is the same cost at zero units as it is at 36 units of output. The variable cost of producing 0 units, TVC(0), will always equal zero, so the total fixed cost is the only cost that is paid when zero units of output are produced. Thus the total fixed cost of $100 is the same cost at zero units as it is at 36 units of output. |
18. B. |
Marginal cost is the change in total cost divided by the change in output. So when output rises from 8 units to 18 units, marginal cost is  . But when output rises from 36 to 38 units, marginal cost is . But when output rises from 36 to 38 units, marginal cost is  . This demonstrates that marginal cost is rising; it is an upward-sloping curve. . This demonstrates that marginal cost is rising; it is an upward-sloping curve. |
19. A. |
This equation is correct because TVC + TFC = TC. Choice B would have been correct if total product of labor had been divided by labor. Choice C would have been correct if the change in the total product of labor had been divided by the change in labor. Choice D would have been correct if the change in total cost had been divided by the change in output. |
20. D. |
If the marginal product of labor is falling but is still greater than zero, it simply means that the total product of labor is rising at a slower rate. The total product of labor will be falling only if the marginal product of labor is negative. |
21. C. |
Raw carrots are a key input in the production of carrot cake. When the carrots become less expensive, it becomes less costly to produce each carrot cake and the supply of carrot cake increases. Remember that the higher price of carrot cake (choice B) does not shift the supply curve, it causes only an upward movement along the supply curve (an increase in the quantity of cake supplied). |
22. A. |
The price elasticity of supply is the percentage change in quantity supplied divided by the percentage change in price. We can use the following formula, with the information that we know, to solve for the component that is unknown:

Dividing −6 percent by 2 gives us the answer of −3 percent. |
23. A. |
While supply curves are typically less elastic (steeper) in the short run than in the long run, the law of supply still describes them as upward-sloping in both cases. |
24. B. |
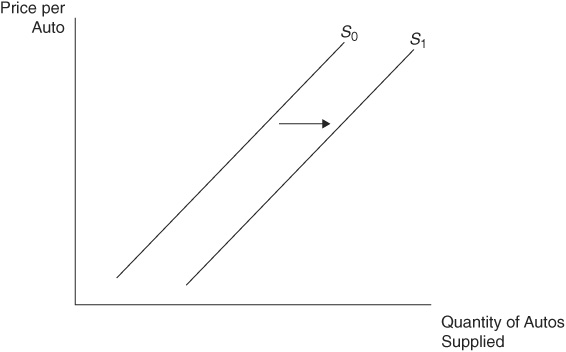
If the price has remained at $2 and more coffee is being produced, the supply curve must have shifted outward. |
25. D. |
As farmers see the alternative crop become less lucrative (the price of cabbage has fallen), more land will be devoted to lettuce production and the supply of lettuce will increase, as shown in Figure 1. |
26. B. |
Market equilibrium is found at the intersection of the supply and demand curves. The equilibrium price is on the vertical axis, and the equilibrium quantity is on the horizontal axis. |
27. A. |
Producer surplus is the area above the supply curve and below the price. This is the area of a triangle that is $6 high ($6 equilibrium price minus where the supply curve intersects the vertical axis, or $0) and 16 units wide. The area of  . It is important to remember that producer surplus (as well as consumer surplus) is the net value ($) of the output to the producers (or the consumers). . It is important to remember that producer surplus (as well as consumer surplus) is the net value ($) of the output to the producers (or the consumers). |
28. D. |
In order for both price and quantity to increase, demand must increase by itself (recall that if both supply and demand change, then we will be able to determine only the change in either equilibrium price or equilibrium quantity). For the price to be $8 and the quantity to be 20 units, demand must shift to the right. If this good is a normal good, more income would cause demand to increase. |
29. D. |
Price controls and excise taxes will all cause deadweight loss in a market by moving the market quantity away from the competitive equilibrium quantity. |
30. C. |
By itself, an increase in demand will increase price and increase quantity. By itself, a decrease in supply will increase price and decrease quantity. When these two shifts are combined, the price will certainly rise, but the change in quantity is uncertain because we don’t know whether the demand shift is stronger than the supply shift, or vice versa. |
31. D. |
If price is below average total cost, losses are occurring in the short run. Losses prompt the exit of firms, and this exit causes the supply curve in the market to shift leftward. As the market price begins to rise, the firms that remain increase their output along their upward-sloping marginal cost curve. |
32. A. |
Profit is found by multiplying the profit-maximizing output by the difference between price and average total cost. The formula for profit is  . Since . Since  , ,  . Since . Since  and and  , ,  . Therefore . Therefore  . Another way you can state this is profit . Another way you can state this is profit  . . |
33. B. |
The long-run outcome in perfect competition is that the price is equal to average total cost. This creates a situation in which economic profit is zero and thus there is no incentive for new firms to enter or existing firms to exit. |
34. C. |
The competitive outcome is efficient, which means that no other outcome can increase one person’s welfare without also hurting someone else’s. When this outcome is achieved, deadweight loss does not exist. |
35. A. |
The profit-maximizing choice of quantity will be where the price is equal to the marginal cost, so at a price of $7.50, we need to find where marginal cost is $7.50. Total cost (or total variable cost) increases by $7.50 from 2 units of output to 3. so the third unit would be produced provided the firm is above the shutdown point. The total variable cost at three units is $13.50 and the total revenue at three units is  , so the firm will not shut down. However, profits are negative: , so the firm will not shut down. However, profits are negative:  . . |
36. C. |
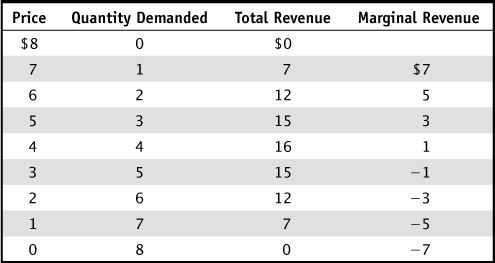
The demand curve for the monopolist is downward-sloping, so in order to sell more units of output, the price must be lowered on all units. When the price is lowered, revenue is lost on the units that previously sold at a higher price, so the marginal revenue from the additional units sold is less than the price. The marginal revenue curve therefore lies below the demand curve. |
37. B. |
The monopolist produces where  , and it’s also the case that , and it’s also the case that  because the demand curve lies above the marginal revenue curve. because the demand curve lies above the marginal revenue curve. |
38. D. |
Perfect price discrimination occurs when each consumer pays a price equal to her willingness to pay. Thus no consumer surplus is earned; all surplus goes to the firm. |
39. C. |
Profit maximization occurs at the output where marginal revenue intersects marginal cost. The price, however, is found by going up to the demand curve. In Figure 4, the intersection of the marginal cost curve and the marginal revenue curve occurs at Q1, and the  . However, the demand curve indicates that the consumer is willing to pay P1 for Q1 units, so the price charged is P1. . However, the demand curve indicates that the consumer is willing to pay P1 for Q1 units, so the price charged is P1. |
40. D. |
If profit is equal to zero, the price must equal average total cost, and this occurs when demand intersects the ATC curve. |
41. D. |
Because there are short-run profits, new grocery stores will enter the market, thus decreasing the demand for Frannie’s product. As her demand curve shifts inward, price falls as she reduces her output. Once profits are equal to zero, no additional firms will enter or exit. |
42. A. |
One of the characteristics shared by monopolistic competition and perfect competition is a lack of barriers to entry. This is why firms in both market structures will break even in the long run. |
43. A. |
A dominant strategy is one that should always be played, no matter what the rival firm is doing. If Kroger expands, Safeway will expand and earn $5 million rather than $3 million from not expanding. If Kroger does not expand, Safeway will expand and earn $10 million rather than $4 million if it did not expand. If Safeway expands, Kroger will expand because it will earn $6 million rather than $3 million by not expanding. If Safeway does not expand, Kroger will still expand to earn $3 million rather than $1 million. So both firms will always expand, no matter what the rival does. |
44. B. |
Kroger has a dominant strategy to expand, but Safeway does not have a dominant strategy. However, given that Kroger will always expand, Safeway will choose to not expand. This decision allows Safeway to earn $3 million rather than $2 million. |
45. C. |
When two firms combine to sell more than 70 percent of the product in the market, this is very much an oligopoly. In fact, because these two firms are so dominant, one might even call it a duopoly. |
46. C. |
The value of the marginal product of labor is the price of the output multiplied by the marginal product of that worker. The marginal product of the fourth worker is 8 units. To calculate for the fourth worker,  . . |
47. A. |
The firm will hire where the wage is equal to the value of the marginal product. At 3 units, the marginal product of labor is 10 units, and the value of the marginal product of the third unit of labor is $30  . Therefore, profit is maximized when 3 workers are hired. . Therefore, profit is maximized when 3 workers are hired. |
48. D. |
To produce her output at the lowest possible cost, Rebecca must hire where the marginal product per dollar is equal for both labor and capital (MPL/wage = MPK/rental rate of capital). The marginal product of labor per dollar is 48 units divided by $12, or $4 per unit. The marginal product of capital per dollar is 125 units divided by $25, or $5 per unit. Since hiring another unit of capital will provide more “bang for the buck,” she should hire more capital and less labor. |
49. B. |
A housing boom will increase the demand for the resources, like carpenters, that are needed to build houses. If the demand for carpenters increases, both the wage and employment will increase as well. |
50. C. |
One of the foundations of our study of the factors of production (like labor) is that demand for a resource is a function of (derived from) the demand for the products being produced by that resource. For example, when the demand for healthcare increases, the demand for nurses increases. When the demand for autos decreases, the demand for autoworkers decreases. |
51. A. |
Gross domestic product (GDP) is the most widely used measure of the value of a nation’s output. Gross domestic product includes all production within the geographic borders of a nation. |
52. B. |
The circular flow diagram shows how factor markets and output markets facilitate the exchange of production inputs and goods and services between households and firms. Households buy goods and services in output markets and sell labor in factor markets. |
53. D. |
Recall that using the expenditures approach,  . When an American buys an imported product made in Japan, that spending is subtracted from U.S. GDP under imports (M) because those dollars actually “leak” out of the American economy and flow into the Japanese economy. This would be counted in the exports of Japan (X), which increases Japanese GDP. . When an American buys an imported product made in Japan, that spending is subtracted from U.S. GDP under imports (M) because those dollars actually “leak” out of the American economy and flow into the Japanese economy. This would be counted in the exports of Japan (X), which increases Japanese GDP. |
54. C. |
A nation’s GDP is the sum of domestic consumption spending (C), investment spending (I), government spending (G), and exports to other nations (X), minus the spending on goods imported from other nations (M). |
55. C. |
Consumption spending is the largest component of GDP. However, it is worth noting that, while it makes up a smaller proportion of GDP, investment spending is the most volatile. |
56. D. |
The unemployment rate is the ratio of those classified as unemployed (U) divided by the labor force (LF). The labor force is the sum of the employed (E) and the unemployed (U). So we calculate  . . |
57. B. |
If a person who is without a job is actively seeking work, she is classified as “unemployed.” If that person has not been actively seeking work, she is classified as “out of the labor force.” |
58. D. |
This theory may explain why some workers receive wages that exceed the market wage and possibly why unemployment exists. It is costly for firms to hire and train new workers, so paying a worker a higher wage may keep that worker at the firm for a longer period of time. If the higher wage induces higher productivity, and also reduces training and hiring costs, the employer may actually increase profits with this strategy. |
59. B. |
We need to focus only on those 1,000 citizens that are above the age of 16. Since 200 of them are out of the labor force and 600 are employed, there must be 200 unemployed (1,000 − 600 employed − 200 out of labor force = 200 unemployed). So we calculate  or 25 percent. or 25 percent. |
60. D. |
There are 1,000 citizens above the age of 16 who could be participating in the labor force. The labor force is 800 (600 employed and 200 unemployed), so the  or 80 percent. or 80 percent. |
61. B. |
While any price index can be used to measure an increase in price, the most widely used is the Consumer Price Index (CPI) because it includes many goods and services that are typically purchased by households. |
62. B. |
In the base year, no matter what year is actually used as the base year, a price index is equal to 100. So if the CPI is 113 in 2011, it has increased 13 percent since the base year. To find the percentage change, we calculate  percent. percent. |
63. D. |
When a salary rises by 3 percent from 2010 to 2011, we say that nominal salary increased by this amount. Nominal salary is the salary measured in current dollars, unadjusted for inflation. If the CPI has increased by 2 percent in that time period (from 100 to 102), the increase in nominal salary is reduced by the amount of inflation, and so purchasing power has increased by only about 1 percent. Therefore, Cartman’s real salary, in terms of what he can really buy with that salary, increased only 1 percent. |
64. D. |
Rapid, unexpected inflation hurts people receiving fixed income payments. This also means that any recipient of fixed money payments would be hurt by this unexpected inflation. But if you are a borrower, you are repaying money that was borrowed when inflation was low and repaying it when inflation is high. Remember that the nominal interest rate is equal to the sum of the real interest rate plus expected inflation. If actual inflation exceeds expected inflation, borrowers repaying their loans will gain some purchasing power. |
65. D. |
In the model of the Phillips curve, the long-run equilibrium is when the economy is at full employment. This occurs when the long-run Phillips curve is vertical and intersecting the short-run Phillips curve. |
66. A. |
An increase in consumer wealth causes consumption spending (C) to increase. If any of the components of AD increase (C, I, G, or  ) this will shift AD to the right. An increase in interest rates would make investment (I) more expensive and decrease investment. ) this will shift AD to the right. An increase in interest rates would make investment (I) more expensive and decrease investment. |
67. C. |
All three of these effects describe why the AD curve is downward-sloping. A drop in the price level will lead to a decrease in interest rates, which would increase aggregate demand. When the price level decreases, households feel wealthier and the amount of consumption they do will increase. When the price level in the United States increases, U.S. exports are relatively cheaper for other countries, and the amount of exports will increase. |
68. A. |
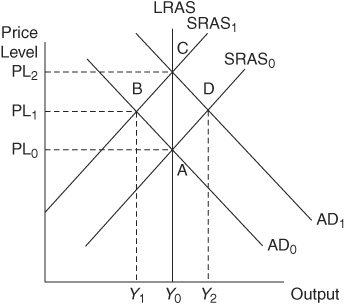
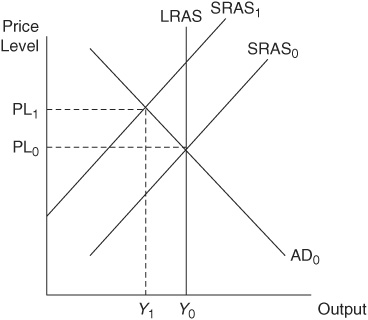
Higher consumer optimism increases consumption spending and shifts the AD curve to the right. The short-run impact of this shift is that the price level and real output (GDP) both increase along the SRAS curve. |
69. B. |
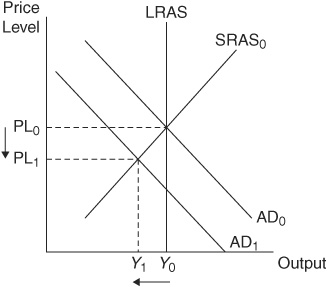
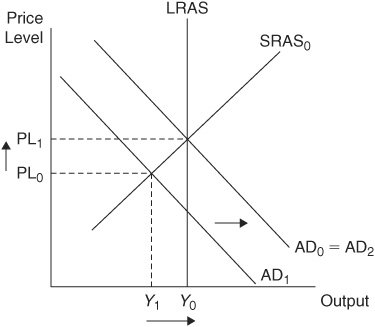
Because the SRAS and AD curves intersect to the left of the LRAS, the economy is operating with a recessionary gap. This means that real GDP is currently below full-employment GDP, and thus the unemployment rate exceeds the natural rate of unemployment. The economy would be at full employment if SRAS and AD intersected on the LRAS curve. |
70. B. |
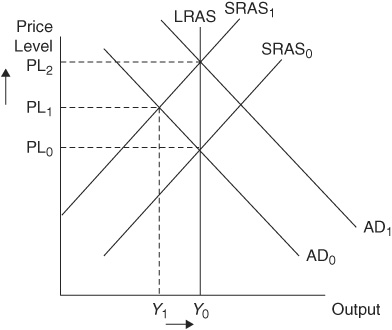
If the economy is allowed to self-correct, the recession would cause factor prices to fall because factors of production (like labor) are underutilized. When this occurs, the SRAS curve shifts to the right, real output increases (unemployment decreases), and the price level decreases along the AD curve. |
71. D. |
Fiat money is money that is declared to be legal currency by the government. It has no intrinsic value (like gold), so it cannot be used as a commodity. |
72. C. |
When cash is moved from one’s home to a checking account, nothing happens to the quantity of money in either M1 or M2. Remember that cash is already included in M1 and M1 is included in M2. |
73. A. |
The money multiplier is the inverse of the reserve requirement. So if the reserve requirement is 0.05, the money multiplier MM = 1/0.05 = 20. |
74. A. |
The money multiplier  , so if $1,000 is deposited into a bank, this should multiply total demand deposits by a factor of 20 to $20,000. , so if $1,000 is deposited into a bank, this should multiply total demand deposits by a factor of 20 to $20,000. |
75. D. |
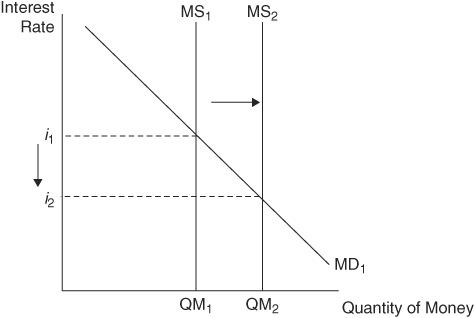
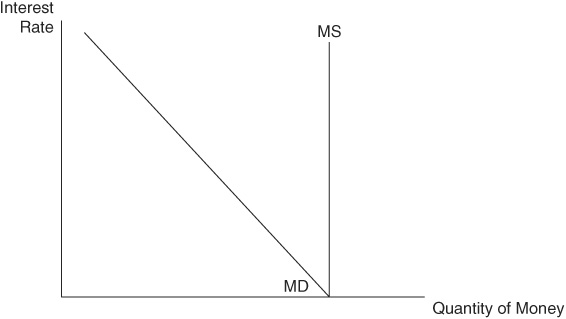
The theory of liquidity preference models the money market with a downward-sloping money demand curve and a vertical money supply curve. Equilibrium interest rates are found at the intersection. If the demand for money increases, the new interest rate will rise along the money supply curve. |
76. A. |
This is one of the foundations of classical theory. The economy will self-correct in the long run at full-employment GDP because all prices are flexible in the long run. |
77. C. |
If the economy is in a recession, fiscal policy should be aimed at increasing aggregate demand. This can happen with more government spending, lower taxes, or both. An increase in the money supply is appropriate during a recession, but this is monetary, not fiscal, policy. |
78. D. |
With the  , the government spending multiplier is equal to , the government spending multiplier is equal to  . This means that if government spending increases by $5 billion, it will multiply by a factor of 10 to ultimately increase spending by $50 billion. . This means that if government spending increases by $5 billion, it will multiply by a factor of 10 to ultimately increase spending by $50 billion. |
79. C. |
Open market operations involve the buying and selling of Treasury bonds by the Federal Reserve. In a period of high inflation, the economy needs to cool off. Selling bonds decreases the money supply and increases interest rates. As interest rates rise, investment spending and consumption spending tend to fall, decreasing aggregate demand and the price level. Choice D is not correct because open market operations do not change the interest rate directly. |
80. A. |
In the long run, we believe that a recession will self-correct. With weak aggregate demand, output is currently below full employment and factors of production are underutilized. As factor prices adjust downward, the SRAS curve shifts to the right. Output returns to full employment at a lower price level. |
81. B. |
Suppose the nation was producing 5,000 candies, but wanted to switch to producing 1,000 cars. The gain of 1,000 cars comes at a cost of 5,000 candies, or 5 candies lost for every 1 car gained. You can also solve for this by setting 5,000 candies = 1,000 cars and solving for cars. |
82. D. |
It costs England 1 unit of bread to make 1 unit of butter. It costs Ireland  unit of bread to make 1 unit of butter. This means that Ireland can make butter at lower cost, giving Ireland a comparative advantage in butter. It costs England 1 unit of butter to make 1 unit of bread. It costs Ireland 2 units of butter to make 1 unit of bread. Thus England has a comparative advantage in bread. unit of bread to make 1 unit of butter. This means that Ireland can make butter at lower cost, giving Ireland a comparative advantage in butter. It costs England 1 unit of butter to make 1 unit of bread. It costs Ireland 2 units of butter to make 1 unit of bread. Thus England has a comparative advantage in bread. |
83. C. |
Ireland has a comparative advantage in butter, and England has a comparative advantage in bread. England will export bread to Ireland, and Ireland will export butter to England. Of course this means that Ireland imports bread from England and England imports butter from Ireland. |
84. C. |
Stronger popularity of American-made goods in other nations will translate into a stronger demand for U.S. dollars. All else equal, as the demand for the dollar increases (shifts to the right), the price of a dollar rises. Since the price of a dollar is measured in how many units of a foreign currency it takes to buy a dollar, the dollar is said to be appreciating (rising in value) in this situation. |
85. A. |
The sale of an American-made T-shirt to Canada means that money from Canada is flowing into the United States. The current account tabulates short-term transactions like the import and export of goods and services. |
86. B. |
Public goods are those that are nonrival and nonexcludable. A police department provides services to the entire community, not just to those adults who pay their taxes. And one person’s use of police services does not deny another person the use of police services. All of the other options are private goods because they are both rival and excludable. |
87. B. |
The graph shows that the marginal social cost is greater than the marginal private cost. This tells us that there are additional costs to society that are not captured by the firms’ production costs. At the market equilibrium quantity,  , but the MSC is greater, which is referred to as a negative externality. , but the MSC is greater, which is referred to as a negative externality. |
88. C. |
With a negative externality, too much of the good is being produced by the market, so a per-unit tax equal to the vertical distance between MSC and MPC should remedy the market failure. A subsidy would only worsen the problem by causing the market to produce even more of this good. |
89. C. |
A positive externality exists when production or consumption of a good causes a third party (you in this case) to receive a spillover benefit. When the beekeeper’s bees pollinate your cherry trees, they provide just such a benefit to you. |
90. D. |
The next ton of pollution emitted causes both additional cost (MSC) to society and additional benefit (MSB) because goods are produced along with the pollution. It is efficient if we can limit pollution to the level where  . . |
91. B. |
Now that Mr. Pham has a very good health insurance policy, he feels that he can engage in a risky endeavor like climbing Mount Everest. If he should get sick or injured, all of the financial risk falls on his health insurance company. This is an example of moral hazard. |
92. A. |
Insurance companies require the patient to pay a deductible on any medical treatments they seek. By putting some of the financial risk on the patient (Betty), this helps to reduce the moral hazard issue. |
93. C. |
Since 10 people (1 percent of 1,000) are expected to get sick, the insurance company expects to incur losses of  million. Dividing this by 1,000 policyholders amounts to $2,000 per person. So when each person pays the loading fee of $100, the premium charged is the loading fee plus the actuarially fair premium = $2,100. million. Dividing this by 1,000 policyholders amounts to $2,000 per person. So when each person pays the loading fee of $100, the premium charged is the loading fee plus the actuarially fair premium = $2,100. |
94. C. |
Because healthy people figure that they won’t need to use health insurance, many may opt to go without. This leaves only the sick people in the pool for health insurance. |
95. B. |
A copayment is a fee that the patient must pay at the doctor’s office for medical treatment. When the patient is required to assume some of the financial risk, the patient will be less likely to visit the doctor for small or frivolous treatments. |
96. D. |
The literature review process allows the student to learn more about the research history of his topic so that he can discover where his research might contribute to the set of knowledge. |
97. A. |
If we have a hypothesis about how the world works, we must gather data and rigorously test whether the hypothesis is sound or not. This allows economic research to follow the scientific method rather than just publish conclusions based on weak or anecdotal evidence. |
98. D. |
This is a testable hypothesis because Terrence could gather data on how many cold fountain drinks he sold on each day and the high temperature in his town that day. If he found a significantly strong positive relationship between the two variables, he might confirm his hypothesis. |
99. D. |
When Raquel is using the relevant data to statistically measure the relationship between her two variables, she is engaging in empirical analysis. |
100. A. |
Most research today involves empirical analysis of how economic variables are related to each other. |
 . Therefore, a rational decision maker will sell the thirty-sixth T-shirt only if she can get at least $5 for it.
 marginal utils per dollar from Gams, but is getting
  marginal utils per dollar from Ferbs. According to the utility maximization rule, the consumer should consume at the point all marginal utilities per dollar are equal. If the consumer increases his consumption of Ferbs, the marginal utility from consuming Ferbs will decrease.
 utils.
 of the budget, and 12 units of good Y would use the remaining
  of the budget.
 of the budget, and 25 units of good Y would use
  . This would overspend the budget by $10.



 , but only in the long run is it also true that we can include ATC in this equalwwity.
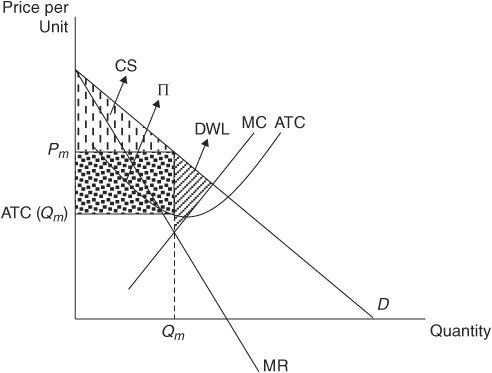
 at Q4 units of output. Because P1 lies above the ATC curve, there will be positive profits in the short run.
 at an output of 2 units. The price needed to sell 2 units is $6. Profit is calculated as 2 units
  .
.
 , but price is set higher, at the demand curve. In the long run, it is true that
  .
. , we assume that the price is constant and is given by the competitive product market. Thus it is a diminishing marginal product of labor curve that provides the downward-sloping VMPL curve.
 so the sixth worker has
  .
. . Since the wage is $30, we look for the
  , and this happens at the third worker.
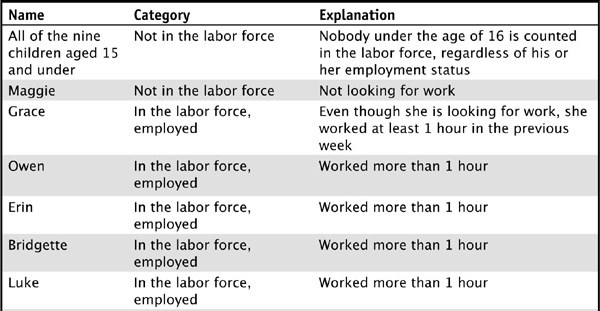
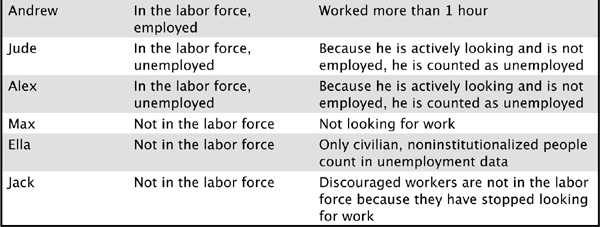

 percent. This illustrates the discouraged worker effect. So if Jack suddenly got more optimistic about his job prospects and started to look for work, we would see a spike in the unemployment rate. If economists were looking only at the unemployment rate, they might draw the opposite conclusion—that all of a sudden jobs prospects were worse!
  percent), we get a better, more complete picture of the labor market.
 , which is the same as 1/MPS. The multiplier here is 2.5. However, the actual increase in GDP will depend on the crowding-out effect.
 .
.
 . But with a positive externality, there are spillover benefits to society, so the
  .
. . With a negative externality, there are spillover costs to society, so the
  .
. curve intersects the demand curve.
 plus the total spending on good
  . The equation given for Josh’s budget constraint,
  , tells us that the price of a can of soup is $4. Thus, with $100 to spend, he could buy at most 25 cans of soup.
 The variable cost of producing 0 units, TVC(0), will always equal zero, so the total fixed cost is the only cost that is paid when zero units of output are produced. Thus the total fixed cost of $100 is the same cost at zero units as it is at 36 units of output.
 . But when output rises from 36 to 38 units, marginal cost is
  . This demonstrates that marginal cost is rising; it is an upward-sloping curve.
 . It is important to remember that producer surplus (as well as consumer surplus) is the net value ($) of the output to the producers (or the consumers).
 . Since
  ,
,  . Since
  and
and  ,
,  . Therefore
  . Another way you can state this is profit
  .
. , so the firm will not shut down. However, profits are negative:
  .
. , and it’s also the case that
  because the demand curve lies above the marginal revenue curve.
 . However, the demand curve indicates that the consumer is willing to pay P1 for Q1 units, so the price charged is P1.
 .
. . Therefore, profit is maximized when 3 workers are hired.
 . When an American buys an imported product made in Japan, that spending is subtracted from U.S. GDP under imports (M) because those dollars actually “leak” out of the American economy and flow into the Japanese economy. This would be counted in the exports of Japan (X), which increases Japanese GDP.
 .
. or 25 percent.
 or 80 percent.
 percent.
 ) this will shift AD to the right. An increase in interest rates would make investment (I) more expensive and decrease investment.
 , so if $1,000 is deposited into a bank, this should multiply total demand deposits by a factor of 20 to $20,000.
 , the government spending multiplier is equal to
  . This means that if government spending increases by $5 billion, it will multiply by a factor of 10 to ultimately increase spending by $50 billion.
 unit of bread to make 1 unit of butter. This means that Ireland can make butter at lower cost, giving Ireland a comparative advantage in butter. It costs England 1 unit of butter to make 1 unit of bread. It costs Ireland 2 units of butter to make 1 unit of bread. Thus England has a comparative advantage in bread.
 , but the MSC is greater, which is referred to as a negative externality.
 .
. million. Dividing this by 1,000 policyholders amounts to $2,000 per person. So when each person pays the loading fee of $100, the premium charged is the loading fee plus the actuarially fair premium = $2,100.