 The Joy of Sharing
In This Chapter

In the previous chapter, we moved from the development environment to the report server. The report server enables us to make our reports available to end users. We reviewed the various ways reports and their supporting resources can be moved from the development environment to the report server. We also reviewed the security features the report server provides.
In addition to all this, we looked at the web portal interface, which provides users with one method of accessing reports on the report server. In this chapter, you learn about additional ways to take reports from the report server to the users. You also learn ways to manage how and when reports are executed. These features can be used to level out server load and to increase user response time.
But first, we look at something you should have learned in kindergarten—how to share. We take some of the parts and pieces of reports we created earlier in the book and see how to share those items with other report authors. This allows others to take advantage of queries that are already proven to be correct and use bits of complex report layout in their own reports.
Reporting Services, and especially the Report Builder authoring tool, are designed to allow business people (also known as subject matter experts) to create their own reports without having to depend on the IT department for every view into the data. All report authors, but especially these more inexperienced users, benefit from being able to leverage and build upon the work done by others. To facilitate this, Reporting Services supports two types of sharing through the report server: shared datasets and report parts.
As you have already seen, a shared dataset is simply a query that can be used to provide data in multiple paginated reports or mobile reports or web portal key performance indicators (KPIs). A report part is a combination of query and layout from one paginated report that can be utilized in other paginated reports. The report server provides a convenient and secure method for managing both shared datasets and report parts.
In Chapters 8, 9, and 10 of this book, we used stored procedures as a way to share queries. I created the queries and shared them with you. I’m sure you noticed you spent much less time working on creating queries in Chapters 8, 9, and 10. We discussed the advantages of using stored procedures, including the ability to share complex query code among multiple reports. So if stored procedures give us this sharing capability, why do we even need shared datasets?
First of all, shared datasets are required for mobile reports and KPIs. There is no other mechanism for providing dynamic data in a mobile report or KPI. That is the mechanism Microsoft has leveraged for these two architectures. But shared datasets existed before the addition of mobile reports and KPIs to the Reporting Services product. There must be another reason for the existence of shared datasets.
I was able to create stored procedures for your use in Chapters 8, 9, and 10 because I have rights to do so in the Galactic database. This is a privilege that should not be granted to every user. Shared datasets provide a way to share queries without having to open up big holes in our database security. In order to create a shared dataset, the user must have rights to select data from tables in the database, but does not need any database rights beyond that. The user does need to have rights to manage shared datasets in one or more folders on the report server. I’m sure this is a right our administrators will grant much more readily.
The exercises in Chapters 10 and 11 took you through the steps to create a shared dataset in Report Builder. If you need a refresher or you skipped over those chapters, here is another quick example of creating a shared dataset using Report Builder. You can also create shared datasets using SSDT and Visual Studio, so you can give that a try if you wish.
 SSDT and Visual Studio Steps
1. Start SSDT or Visual Studio, and open the Chapter08 project.
2. Select Project | Properties from the main menu. The Chapter08 Property Pages dialog box appears.
3. Type Galactic Delivery Services/Shared Datasets for TargetDatasetFolder.
4. Type Galactic Delivery Services/Shared Data Sources for TargetDataSourceFolder.
5. Type Galactic Delivery Services/Chapter08 for TargetReportFolder.
6. Type Galactic Delivery Services/Report Parts for TargetReportPartFolder.
7. Type http://ComputerName/ReportServer for TargetServerURL, where ComputerName is the name of the computer where the report server is installed. You should replace http: with https: if you are using a secure connection. You can use localhost in place of the computer name if the report server is installed on the same computer you are using to run Visual Studio (see Figure 12-1).
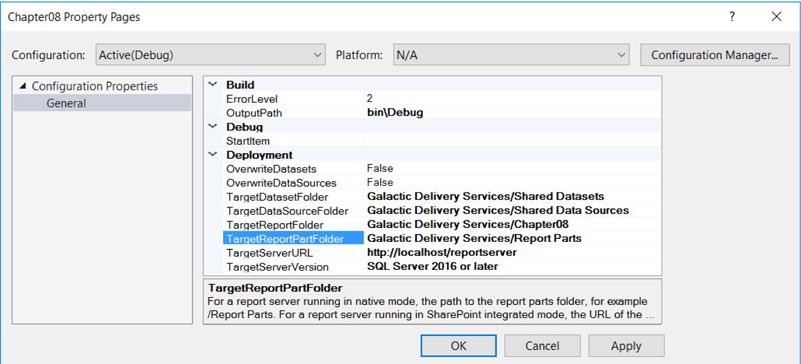
Figure 12-1 The Chapter08 Property Pages dialog box
 NOTE
NOTE
If your report server does not have the Reporting Services web service configured in its default location, you will need to modify the URL in Step 6 accordingly.
8. Click OK to exit the Chapter08 Property Pages dialog box.
9. In the Solution Explorer, right-click the Shared Datasets folder, and select Add New Dataset from the context menu. The Shared Dataset Properties dialog box appears.
10. This should look familiar. It is, in fact, the same as the Dataset Properties dialog box you have seen many times before. You know how to build queries using this dialog box, so we will keep things simple. Enter CustomerInfo for Name.
11. Enter the following for Query:

12. Click OK to exit the Shared Dataset Properties dialog box. You will see the entry for your new shared dataset in the Solution Explorer window with the .rsd extension. (You may have to expand the Shared Datasets folder entry to see it.)
13. Right-click the CustomerInfo.rsd item in the Solution Explorer window, and select Deploy from the context menu. The shared dataset will be deployed to the Galactic Delivery Services/Shared Datasets folder on the report server.
 Report Builder Steps
1. Open the web portal in a browser window.
2. Navigate to the Shared Datasets folder.
3. Click New in the web portal toolbar and select Dataset. Report Builder is launched with the New Report or Dataset dialog box visible.
4. Select the Galactic shared data source you have been using for the report authoring exercises.
5. Click the Create button.
6. The Report Builder window will become a large version of the Graphical Query Designer window that you have seen many times before. You know how to build queries using this tool, so we will keep things simple. Expand the Tables item in the Database view pane.
7. Check the entry for the Customer table.
8. Click the Save button in the upper-left corner of the window. The Save As Dataset dialog box appears.
9. Navigate to the Shared Datasets folder.
10. Enter CustomerInfo.rsd for Name.
11. Click OK.
In addition to creating shared datasets from scratch, we can convert a dataset that exists in a report into a shared dataset. Here’s how:
SSDT and Visual Studio Steps1. In SSDT or Visual Studio, open the Chapter08 solution, if it is not already open.
2. Open the EmployeeTime report.
3. In the Report Data window, expand the Datasets folder.
4. Right-click the entry for the EmployeeTime dataset, and select Convert to Shared Dataset from the context menu.
5. You’ll see there is now an entry for the EmployeeTime dataset in the Solution Explorer window under Shared Datasets. In the Report Data window, the entry for EmployeeTime now includes a shortcut icon indicating it is a pointer to the new EmployeeTime shared dataset. In the Report Data window, right-click the entry for the EmployeeTime dataset. Select Dataset Properties from the context menu. The Dataset Properties dialog box appears.
6. Note the Dataset Properties dialog box now shows the two shared datasets in our project, CustomerInfo and EmployeeTime, with the EmployeeTime shared dataset selected. Click Cancel to exit the Dataset Properties dialog box.
7. Click Save All.
8. Right-click the entry for the EmployeeTime shared dataset in the Solution Explorer window, and select Deploy from the context menu. The shared dataset is deployed to the server.
9. Right-click the entry for the EmployeeTime report in the Solution Explorer window, and select Deploy from the context menu.
10. Navigate to the Galactic Delivery Services/Chapter08 folder on the report server. Click EmployeeTime to execute the report. The report runs using the EmployeeTime shared dataset.
NOTE
At the time of this writing, there was a bug that resulted in a security error when attempting to run this report using the shared dataset. If you receive an error at this point, simply move on to the next section.
11. Navigate to the Galactic Delivery Services/Shared Datasets folder.
12. Click the ellipsis (…) button in the upper-right corner of the entry for the EmployeeTime shared dataset, and select MANAGE. Select the Dependent Items page on the left side of the screen. You will see a list of items dependent on the EmployeeTime shared dataset. This list shows the EmployeeTime paginated report is dependent on the EmployeeTime shared dataset.
Report Builder Steps1. If the CustomerInfo shared dataset is displayed in the Report Builder, click the File tab and select Open from the menu. Otherwise, start Report Builder and select Open in the Getting Started dialog box. The Open Report dialog box appears.
2. Navigate to the Chapter08 folder, and open the EmployeeTime report.
3. Click the File tab, and select Publish Report Parts from the menu. The Publish Report Parts dialog box appears.
4. Click Review and modify report parts before publishing. A second version of the Publish Report Parts dialog box appears.
5. Uncheck Report parts. (We’ll get to those later in this chapter.)
6. Check Datasets.
7. Click the arrow next to EmployeeTime as shown in Figure 12-2.
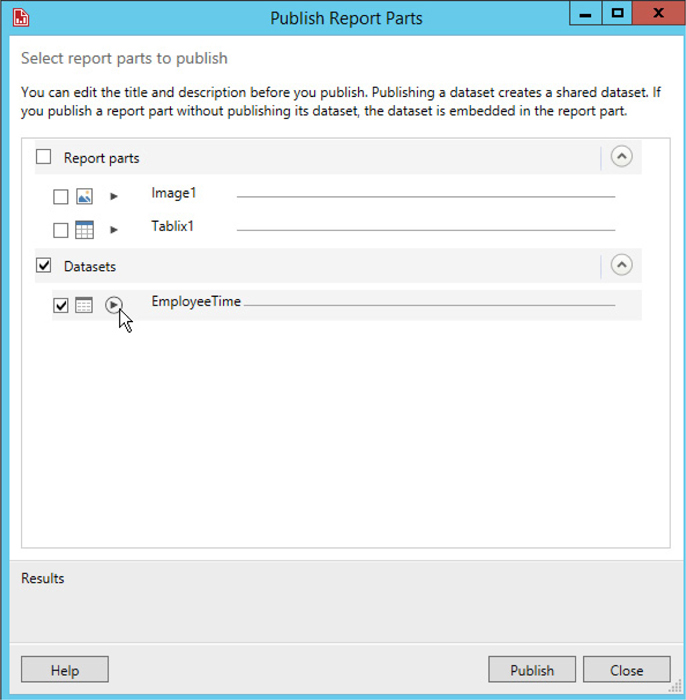
Figure 12-2 Publishing an existing dataset in Report Builder
8. Click Browse to select where the EmployeeTime dataset should be stored. The Select Folder dialog box appears.
9. Navigate to the Shared Datasets folder in the Galactic Delivery Services folder.
10. Click OK to exit the Select Folder dialog box.
11. Click Publish. You should see a green check mark across from the EmployeeTime entry in the dialog box.
12. Click Close to exit the Publish Report Parts dialog box.
13. Click Save to save the EmployeeTime report.
14. Navigate to the Chapter08 folder on the report server. Click EmployeeTime to execute the report. The report runs using the EmployeeTime shared dataset.
NOTE
At the time of this writing, there was a bug that resulted in a security error when attempting to run this report using the shared dataset. If you receive an error at this point, simply move on to the next section.
15. Navigate to the Shared Datasets folder.
16. Click the ellipsis (…) button in the upper-right corner of the entry for the EmployeeTime shared dataset, and select MANAGE. Select the Dependent Items page on the left side of the screen. You will see a list of items dependent on the EmployeeTime shared dataset. This list shows the EmployeeTime report is dependent on the EmployeeTime shared dataset.
Modifying a shared dataset is straightforward. When using SSDT or Visual Studio, simply open the project containing the shared dataset and click the entry for that dataset in the Solution Explorer window. This will open the Shared Dataset Properties dialog box. You can modify the shared dataset as needed and then redeploy it to the report server.
When using Report Builder, navigate to the shared dataset on the report server, click the ellipsis (…) button, and select MANAGE. Then select Edit in Report Builder from the toolbar. This will open the dataset for modification in Report Builder. When the modifications are complete, just click Save and the updated version will be saved on the report server.
Now that we’ve seen how to create and maintain shared datasets, let’s put one to use. Follow these steps to create a report using a shared dataset.
SSDT and Visual Studio Steps1. Start SSDT or Visual Studio, and open the Chapter08 project, if it is not already open.
2. Close the EmployeeTime report, if it is open.
3. Create a new report called EmployeeTimeAnalysis. Do not use the GDSReport template.
4. In the Report Data window, click the New drop-down menu, and select Dataset from the menu that appears. The Dataset Properties dialog box appears.
5. Enter EmpTimeInfo for Name.
6. Ensure the Use a shared dataset radio button is selected.
7. The main section of the screen shows the shared datasets available in this project. Select EmployeeTime as shown in Figure 12-3.
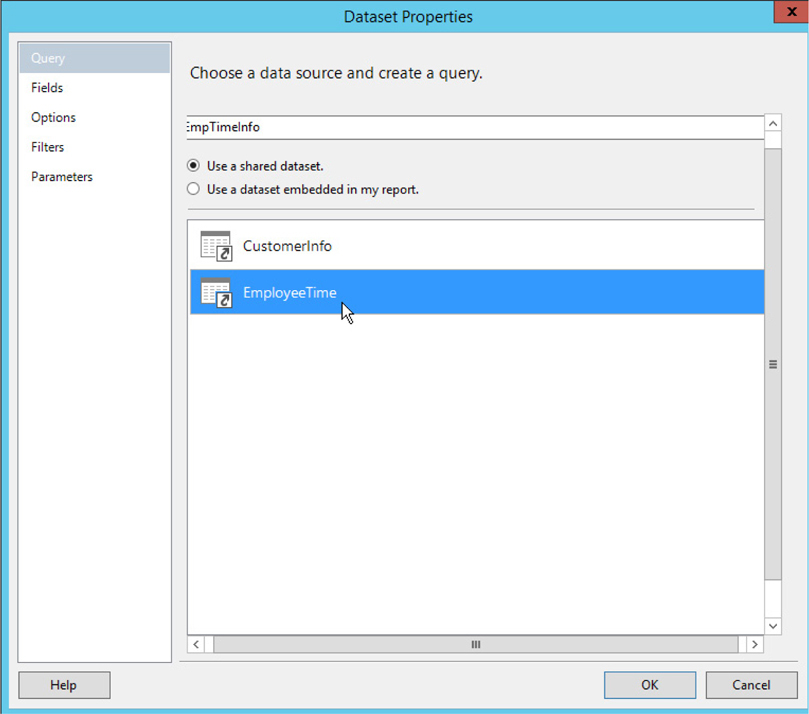
Figure 12-3 Using a shared dataset in SSDT or Visual Studio
8. Click OK to exit the Dataset Properties dialog box.
NOTE
From this point, the shared dataset is used just like a dataset embedded in your report.
9. Place a chart on the report so it covers the entire report body layout area. The Select Chart Type dialog box appears.
10. Select the Line chart type, and click OK to exit the Select Chart Type dialog box.
11. Click the chart to activate the Chart Data window.
12. Using the green plus sign, select HoursWorked in the Values area.
13. Click the drop-down menu for [Sum(HoursWorked)] in the Values area, and select Aggregate | Avg.
14. Using the green plus signs, select Work Date in the Category Groups area and Job in the Series Groups area.
15. Preview the report. You can add a chart title and improve the formatting of the report for extra credit.
16. Save the report.
17. Deploy the report.
Report Builder Steps1. Start Report Builder, if it is not already open.
2. Create a new blank paginated report.
3. In the Report Data window, click the New drop-down menu and select Dataset. The Dataset Properties dialog box appears.
4. Enter EmpTimeInfo for Name.
5. Ensure the Use a shared dataset radio button is selected.
6. Click Browse. The Select Dataset dialog box appears.
7. Navigate to the Shared Datasets folder.
8. Select the EmployeeTime shared dataset, and click Open to close the Select Dataset dialog box. The Dataset Properties dialog box appears as shown in Figure 12-4.
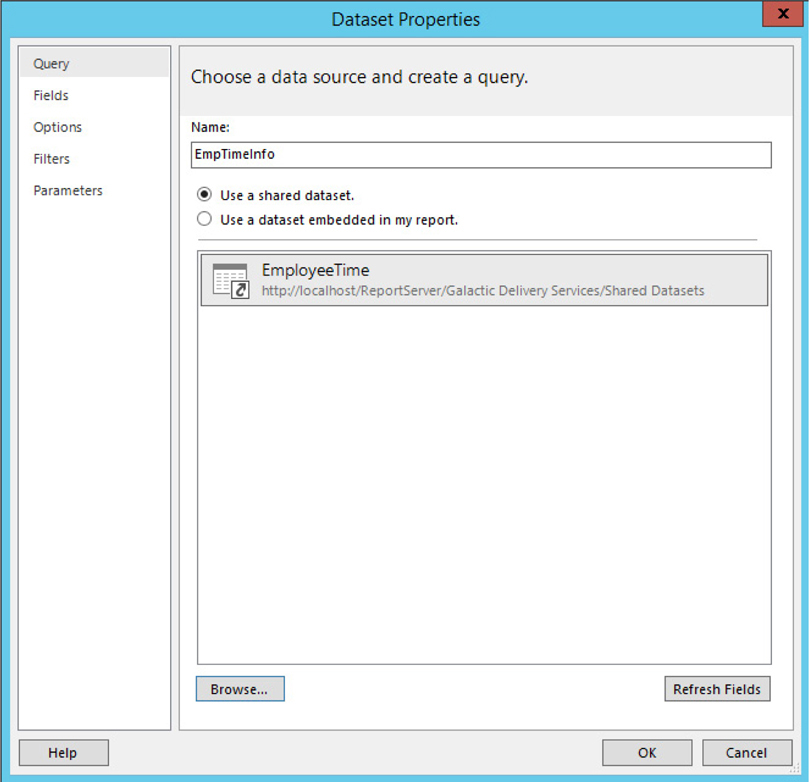
Figure 12-4 Using a shared dataset in Report Builder
9. Click OK to exit the Dataset Properties dialog box.
NOTE
From this point, the shared dataset is used just like a dataset embedded in your report.
10. Place a chart on the report so it covers the entire report body layout area. The Select Chart Type dialog box appears.
11. Select the Line chart type, and click OK to exit the Select Chart Type dialog box.
12. Click the chart to activate the Chart Data window.
13. Using the green plus sign, select HoursWorked in the Values area.
14. Click the drop-down menu for [Sum(HoursWorked)] in the Values area, and select Aggregate | Avg.
15. Using the green plus signs, select Work Date in the Category Groups area and Job in the Series Groups area.
16. Run the report. You can add a chart title and improve the formatting of the report for extra credit.
17. Save the report as EmployeeTimeAnalysis in the Chapter08 folder.
As you can see, using a shared dataset can make report development quick and easy. It is possible, however, to make things even easier. We do that by taking further advantage of previous efforts through report parts.
Report parts work similar to shared datasets. The difference is a report part includes a report layout component in addition to the dataset. Report parts are created by taking the individual layout components and parameters of an existing report and saving them to the report server. These bits of report definition can then be incorporated into other reports.
Report parts can be saved to the server from SSDT, Visual Studio, and Report Builder. However, only Report Builder can make use of report parts in the reports it creates. This is one of the few places where SSDT, Visual Studio, and Report Builder do not have the same capabilities.
Saving report parts to the report server is as easy as saving existing datasets as shared datasets. Let’s give it a try.
SSDT and Visual Studio Steps1. In SSDT or Visual Studio, open the Chapter08 solution, if it is not already open.
2. Close any open reports, and then open the Overtime Report.
3. In the Report menu, select Publish Report Parts. (You may need to click somewhere on the report to get the Report menu to appear.) The Publish Report Parts dialog box appears. This dialog box lists the layout items and parameters in the Overtime Report.
4. Check the box for HubCode.
5. Click the arrow next to HubCode as shown in Figure 12-5.
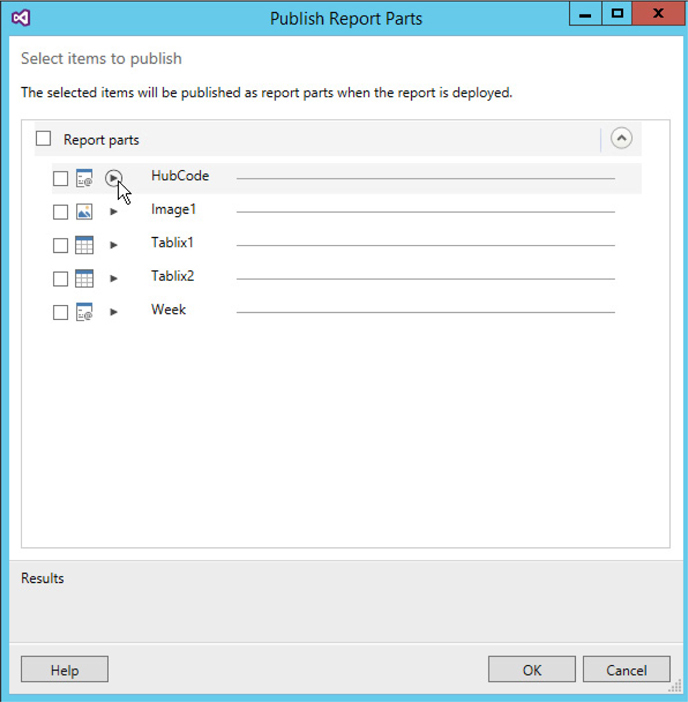
Figure 12-5 Adding detail to report parts before publishing
6. In the Write a detailed description of the report part to help identify it area, type The HubCode report parameter showing hubs with employees over 45 hours for the selected week.
NOTE
As your Report Part Gallery grows, it is important to have detailed descriptions of each report part. Otherwise, it will be impossible to tell one report part from another when trying to find the appropriate bit for incorporation into a new report.
8. Click Tablix1, and replace this text with Employees 45–55 Hours Worked.
9. Click the arrow next to this item, and type the following in the detailed description area: A tablix showing employees for a selected week at a selected hub with 45–55 hours worked.
10. Check the box for Tablix2.
11. Click Tablix2, and replace this text with Employees Over 55 Hours Worked.
12. Click the arrow next to this item, and type the following in the detailed description area: A tablix showing employees for a selected week at a selected hub with over 55 hours worked.
13. Check the box for Week.
14. Click the arrow next to Week, and type the following in the detailed description area: The Week report parameter showing weeks for which employee time has been entered.
15. Click OK to publish the report parts.
16. Right-click the entry for the Overtime report in the Solution Explorer, and select Deploy from the context menu. The report and the report parts will be deployed to the report server.
17. In the web portal, navigate to the Report Parts folder in the Galactic Delivery Services folder. You should see the four report parts in the folder as shown in Figure 12-6.

Figure 12-6 The published report parts on the report server
NOTE
Report parts are published to the report server and the report server folder specified in the project properties dialog box. See the “Creating a Shared Dataset from Scratch” section earlier in this chapter.
Report Builder Steps1. Start Report Builder, if it is not already running, and open the Overtime Report from the Chapter08 folder.
2. Click the File tab, and select Publish Report Parts from the menu. The Publish Report Parts dialog box appears.
3. Click “Review and modify report parts before publishing.” A second version of the Publish Report Parts dialog box appears listing all layout items, parameters, and datasets in the report.
4. Click the arrow next to HubCode.
5. In the Write a detailed description of the report part to help identify it area, type The HubCode report parameter showing hubs with employees over 45 hours for the selected week.
NOTE
As your Report Part Gallery grows, it is important to have detailed descriptions of each report part. Otherwise, it will be impossible to tell one report part from another when trying to find the appropriate bit for incorporation into a new report.
6. Click Browse. The Select Folder dialog box appears. Make sure this has defaulted to the Report Parts folder in the Galactic Delivery Services folder, and then click OK to exit the dialog box.
7. Uncheck the box for Image1.
8. Click Tablix1, and replace this text with Employees 45–55 Hours Worked.
9. Click the arrow next to this item, and type the following in the detailed description area: A tablix showing employees for a selected week at a selected hub with 45–55 hours worked.
10. Click Tablix2, and replace this text with Employees Over 55 Hours Worked.
11. Click the arrow next to this item, and type the following in the detailed description area: A tablix showing employees for a selected week at a selected hub with over 55 hours worked.
12. Click the arrow next to Week, and type the following in the detailed description area: The Week report parameter showing weeks for which employee time has been entered.
13. Click Publish. The results message should indicate four parts published successfully, and there should be a green check mark next to the four items we chose to publish.
14. Click Close.
15. Save the report.
16. In the web portal, navigate to the Report Parts folder in the Galactic Delivery Services folder. You should see the four report parts in the folder as shown in Figure 12-6.
Once the report parts are published to the report server, we can take advantage of them in new reports. Remember, only Report Builder can utilize report parts in a new report. We use the following steps to add the Employees Over 55 Hours Worked tablix to our EmployeeTimeAnalysis report.
Report Builder Steps1. In Report Builder, open the EmployeeTimeAnalysis report found in the Chapter08 folder.
2. Make the report body longer so there is ample room below the chart.
3. On the Insert tab, select Report Parts. The Report Part Gallery window appears.
4. If no items are displayed in the Report Part Gallery window, click the magnifying glass icon in the search area.
5. Click the Employees Over 55 Hours Worked item to view the detail at the bottom of the Report Part Gallery window. The Report Part Gallery window appears as shown in Figure 12-7.
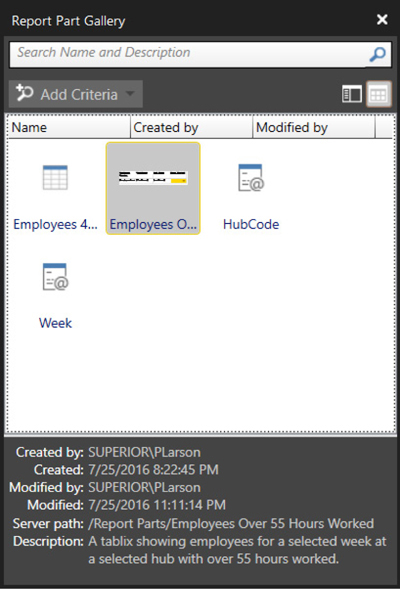
Figure 12-7 The Report Part Gallery window
6. Drag the Employees Over 55 Hours Worked item from the Report Part Gallery, and drop it on the report layout below the chart. The tablix appears on the report.
7. In the Report Data window, expand the Parameters folder. Note the Week and HubCode parameters were automatically added to the report along with the tablix.
8. In the Report Data window, expand the Datasets folder. Note the Weeks, HubsOver45, and EmployeesOver45 datasets were automatically added to the report along with the tablix.
9. Run the report.
10. Select “2016-13” for Week and “Stilation Repair Base” for Hub, and then click View Report. The report should appear similar to Figure 12-8.
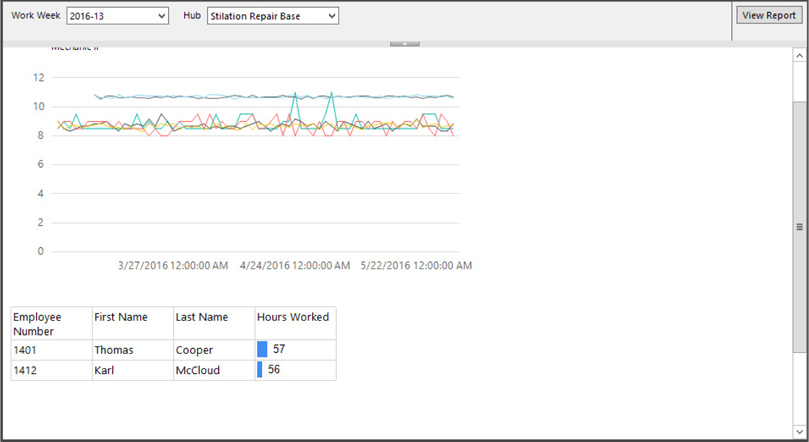
Figure 12-8 The EmployeeTimeAnalysis report with a report part added
11. Save the report.
It is possible for a report part on a server to be modified from time to time. When this happens, the report author who has utilized that report part has the option to incorporate the changes into his or her own report. Alternatively, the report author can choose to ignore the update and continue to use the current version of the report part.
Let’s see how this works. Again, because only Report Builder can consume report parts, this example is limited to Report Builder.
Report Builder Steps1. In Report Builder, open the Overtime Report in the Chapter08 folder.
2. In the tablix for employees with over 55 hours for this week (the tablix near the bottom of the report), select the cell containing the data bar. (It has a background of bright blue.)
3. In the Properties window, change the Palette property to Fire. The data bar background will change to yellow.
4. Save the report.
5. Click the File tab, and select Publish Report Parts from the menu. The Publish Report Parts dialog box appears.
6. Select “Review and modify report parts before publishing.” The Publish Report Parts dialog box changes to show all report parts and datasets.
7. Uncheck all items except for Employees Over 55 Hours Worked.
8. Click Publish.
9. Click Close.
10. Save the report.
11. Open the EmployeeTimeAnalysis report. You will see a bar right under the ribbon indicating that a published report part has been updated on the server as shown in Figure 12-9.
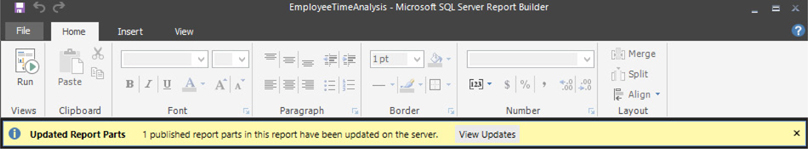
Figure 12-9 The updated report parts notification bar
12. Click the View Updates button in this bar. The Updated Report Parts dialog box appears as shown in Figure 12-10.
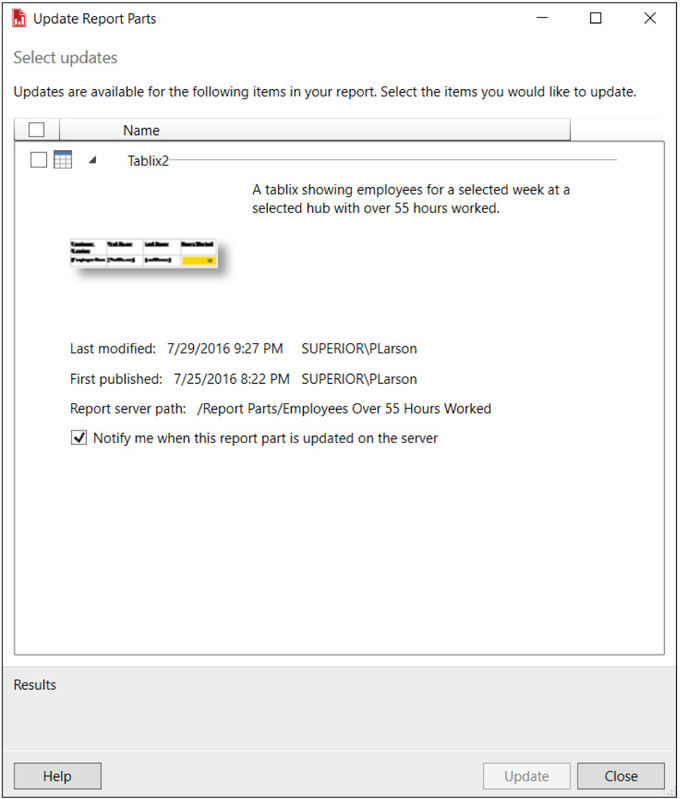
Figure 12-10 The Updated Report Parts dialog box
13. If you do not wish to incorporate this change into the EmployeeTimeAnalysis report, you can simply click Close. However, in this case, we will incorporate the change. Click the check box for Tablix2.
NOTE
You have the option to turn off further notifications of changes to this report part by unchecking the Notify me when this report part is updated on the server check box.
15. Click Close.
16. Run the report.
17. Select “2016-13” for Week and “Stilation Repair Base” for Hub, and then click View Report. The data bar now appears in yellow on this report, too.
18. Save the report.
Shared datasets and report parts bring with them tremendous benefits. Once a robust set of shared datasets and report parts is collected on the server, a number of report authoring tasks can be completed quickly by building on items created previously. Even if there isn’t a dataset or a report part that provides precisely what is needed, there may be something that will serve with only slight modifications rather than having to start from scratch.
However, some care must be taken to prevent the report server from becoming a dumping ground so cluttered that it is hard to find anything useful. Not every dataset and bit of report layout is worthy of being placed in these server repositories. Some discretion must be used to determine what is likely to be reused and what is so unique or so unpolished that it does not deserve publication.
With some care and management, these repositories can become invaluable libraries for both novice and experienced report authors within an organization.
One of the best features of Reporting Services is that the data is requeried each time the report is executed. This is shown in Figure 12-11. The user is not viewing information from a static web page that is weeks or months old. Reporting Services reports include data that is accurate up to the second the report was run.

Figure 12-11 Serving a report without caching
However, this feature can also be the source of one of the drawbacks of Reporting Services. The user is required to wait for the data to be requeried each time a report is run. If your query or stored procedure runs quickly, this may not be a problem. However, even fairly quick queries can slow down a server if enough of them are running at the same time.
Fortunately, Reporting Services has a solution to this problem: report caching.
With many reports, it is not essential to have up-to-the-second data. You may be reporting from a data source that is only updated once or twice a day. The business needs of your users may only require data that is accurate as of the end of the previous business period, perhaps a month or a quarter. In these types of situations, it does not make sense to have the data requeried every time a user requests a report. Report caching is the answer.
Report caching is an option that can be turned on individually for each report on the report server. When this option is turned on, the report server saves a copy, or instance, of the report in a temporary location the first time the report is executed, as shown in Figure 12-12.
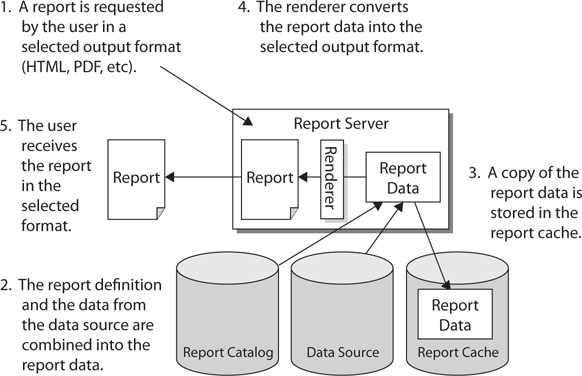
Figure 12-12 Serving a report with caching, the first time
On subsequent executions, with the same parameter values chosen, the report server pulls the information necessary to render the report from the report cache, rather than requerying data from the database, as shown in Figure 12-13. Because these subsequent executions do not need to requery data, they are, in most cases, faster than the report execution without caching.
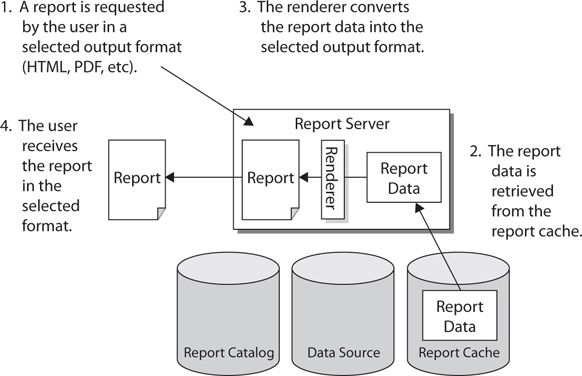
Figure 12-13 Serving a report with caching, subsequent times
Once an instance of the report is stored in the report cache, it is assigned an expiration date and time, which can be calculated in one of two ways. The expiration date and time can be calculated based on a certain number of minutes after the creation of the cached instance. For example, the cached instance of the report exists for 30 minutes, and then it is deleted. Or, the expiration date and time can be determined by a set schedule. For example, the cached instance of the report is deleted at 2:00 A.M.. every Sunday morning.
The first type of expiration calculation is appropriate for a report that requires a large amount of database resources and is run often but does not require up-to-the-second data. We can decrease the workload on the database server by fulfilling most of the requests for the report from the report cache. Every 30 minutes, we throw the cached report away. The next person who requests the report causes a new instance of the report, with updated data, to be placed in the report cache.
The second type of expiration calculation is appropriate for reports run against data that changes on a scheduled basis. Perhaps you have a report being run from your data warehouse. The data warehouse is updated from your transactional database each Sunday at 12:30 A.M.. The data in the warehouse remains static in between these loads. The cached report is scheduled to expire right after the data load is completed. The next time the user requests the report after the expiration, a new instance of the report with the updated data is placed in the cache. This cached report contains up-to-date data until the next data load.
To create a cached instance of a report, the report must be using stored credentials. These can be credentials for either a Windows logon or a database logon, but they must be stored with the data source. If you think about this from a security standpoint, this is how it has to be.
Suppose for a minute that Reporting Services allowed a cached report to be created with Windows integrated security. The Windows credentials of the first person to run the report would be used to create a cached instance of the report. Subsequent users who request this report would receive this cached instance. However, this would mean the subsequent users are receiving data in the report created using the credentials from another user.
If the results of the database query or stored procedure that populates this report vary, based on the rights of the database login, we have the potential for a big problem. If the vice president of sales is the first person to run the report and create the cached instance, all subsequent users would receive information meant only for the VP! Conversely, if a sales representative is the first person to run the report and create the cached instance, when the VP comes along later and requests the report, he will not receive all the information he needs.
The same problem exists if the report prompts for credentials. The first person who runs the report and creates the cached instance is the one who supplies the credentials. Everyone who views the cached instance is essentially using someone else’s logon to see this data.
The only way that caching works without creating the potential for a security problem is with credentials stored with the report. In this situation, the same credentials are used to access the database—whether it is the VP or a lowly sales representative running the report. There is no risk that the cached instance of the report will create a breach in database security.
As you can see in Figure 12-12, the report data, not the final format of the report, is stored in the report cache. The report data is a combination of the report definition and the data from the datasets. It is not formatted as a Hypertext Markup Language (HTML) page, a Portable Document Format (PDF) document, or any other type of rendering format. It is an internal format ready for rendering.
Because the report data is stored in the report cache, the cached report can be delivered in any rendering format. The user who first requested the report, and thus caused the cache instance to be created, may have received the report as an HTML document. The next user may receive the cached instance of the report and export it to a PDF document. A third user may receive the cached instance of the report and export it to an Excel file. Caching the report data gives the report cache the maximum amount of flexibility.
Let’s try enabling caching for one of our deployed reports. We’ll use the EmployeeList Report from Chapter08.
Let’s try enabling caching for the EmployeeList Report.
1. If you composed your reports with SSDT or Visual Studio, upload the EmployeeList report from the Chapter08 project.
2. Open the web portal, and navigate to the Chapter08 folder.
3. Select the ellipsis button (…) in the upper-right corner of the EmployeeList Report, and select MANAGE. The Properties page for the EmployeeList Report appears.
4. Select Caching from the left side of the screen. The Caching page appears.
5. Select the Cache copies of this report and use them when available option.
6. Make sure “Cache expires after 30 minutes” is selected, and change 30 to 45. The Caching page appears as shown in Figure 12-14.
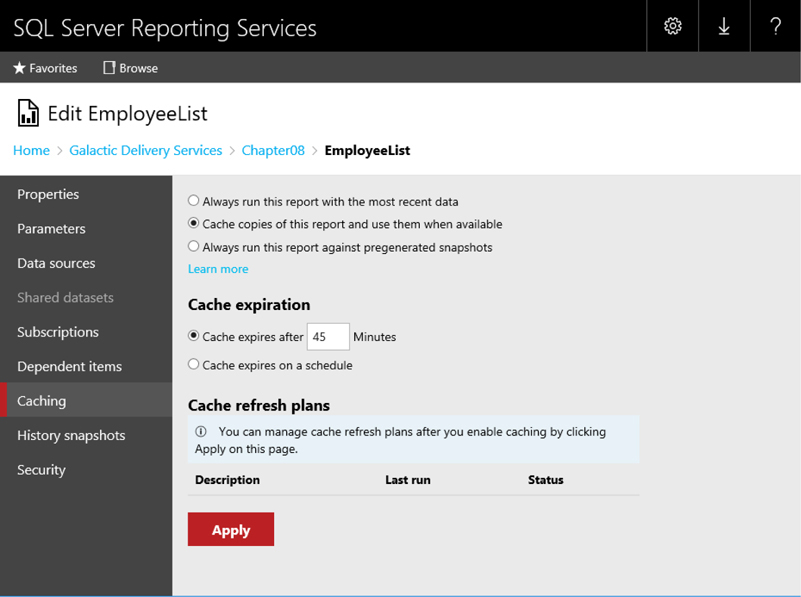
Figure 12-14 The Caching page
7. Click Apply.
8. Click the Chapter08 link in the breadcrumbs, and then select the EmployeeList report to run it. Note the execution date and time at the bottom of the report.
The first time the EmployeeList Report runs after caching is turned on, the report needs to perform its regular execution process to gather the data for the intermediate format. This intermediate format is then copied to the report cache before it is rendered for you in the browser.
Now let’s run the report again. Because a cached copy of the report has not expired, the report is rendered from the cached copy.
1. Click the Refresh button in the toolbar. The report appears almost immediately. That happened so fast, I bet you don’t even believe it retrieved the report. Let’s try it again another way.
2. Click the Chapter08 link at the top of the page.
3. Click the EmployeeList report link to run this report. Note the execution time is still the same.
Pretty slick! The report server doesn’t need to retrieve any data, execute any expressions, call any assemblies, or create the intermediate format. All it needs to do is convert the intermediate format into the rendered format (in this case, HTML).
What happens if we ask for a different rendering format?
1. Select PDF file from Export drop-down list.
2. If a File Download dialog box appears, click Open. Note the execution time remains the same.
3. Close the Adobe Acrobat Reader when you finish viewing the report.
A brief delay occurs as the PDF document is created and your Acrobat Reader is opened, but there is no delay to retrieve the information using the web service. Instead, the intermediate format comes from the report cache and is rendered into a PDF document.
If you wait 45 minutes, the cached copy will have expired and the report is again executed to create the intermediate format. If you want to try this, you can put the book down, go have lunch, and then come back and run the report. It’s okay. You go right ahead. I’ll be here waiting when you get back.
Suppose the data for our EmployeeList report is updated every hour on the hour. It makes sense for us to set our cached copy of this report to expire on this same schedule. The cached copy should expire at five minutes past the hour so a new copy of the report is produced the next time the report is run after the information is updated.
1. Navigate to the Chapter08 folder in the web portal, if you are not already there.
2. Click the ellipsis (…) button in the upper-right corner of the EmployeeList report entry, and select MANAGE. The Properties page appears.
3. Select Caching from the left side of the screen. The Caching page appears.
4. Select the Cache expires on a schedule radio button.
5. The Report-specific schedule option is selected by default. Click “Edit schedule” next to Report-specific schedule. The Schedule page appears, as shown in Figure 12-15.
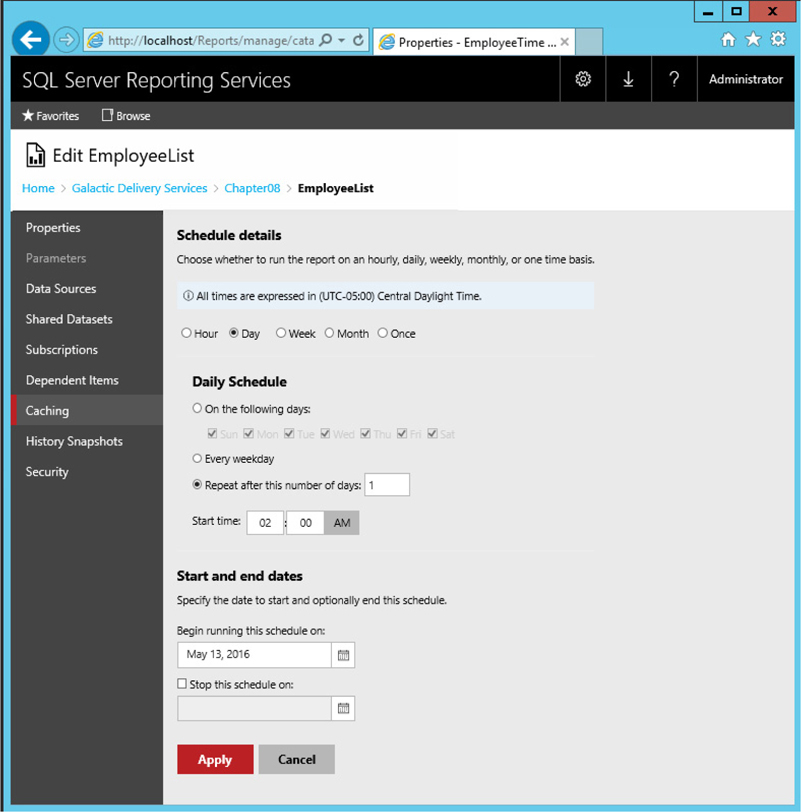
Figure 12-15 The Schedule page
6. You can specify hourly, daily, weekly, monthly, or one-time schedules. Select Hour.
7. Leave the Hourly Schedule set to run every 1 hours 00 minutes. Set Start Time to five minutes after the next hour. (If it is 2:30 P.M. now, set Start Time to 3:05 P.M.)
8. Today’s date should be selected for Begin running this schedule on. Leave the Stop this schedule on field blank.
9. Click Apply to return to the Caching page. Note the description of the schedule you just created under Report-specific schedule.
10. Click Apply to save your changes to the report cache settings.
NOTE
The SQL Server Agent must be running for this and other scheduled items to function properly. If you receive an error message, ensure that the SQL Server Agent service is running on the report server.
11. Click the Chapter08 link in the breadcrumbs.
12. Click the EmployeeList entry to run the report.
Again, the report takes longer to execute the first time as the intermediate format is created and put into the report cache. (The execution time has now changed to the current time.) This cached instance of the report remains there until five minutes past the hour.
When a cached report instance expires, either because of a schedule or because it has existed for its maximum length of time, it is removed from the report cache. One other circumstance can cause a cached report instance to be removed from the report cache. If a new copy of a report is deployed from the authoring environment or uploaded using the web portal, any cached instances of that report are removed from the report cache.
What happens with our report caching if different users enter different parameters when the report is executed? Suppose we set up caching on a report that requires a planet to be selected as a parameter. One user runs the report and selects Borlaron. The report is cached with only the Borlaron information. Now a second user runs the report, selecting Stilation. Because a nonexpired instance of this report is in the report cache, it seems the report should come from the report cache. If this were to happen, though, the second user would receive the Borlaron data instead of the Stilation data.
Fortunately, the report server is smart enough to handle this situation. As part of the instance of the report in the report cache, the report server stores any parameter values used to create that cached instance, as shown in Figure 12-16. The cached instance is used to satisfy requests made by a subsequent user only if all the parameters used to create the cached instance match the parameters entered by the subsequent user.
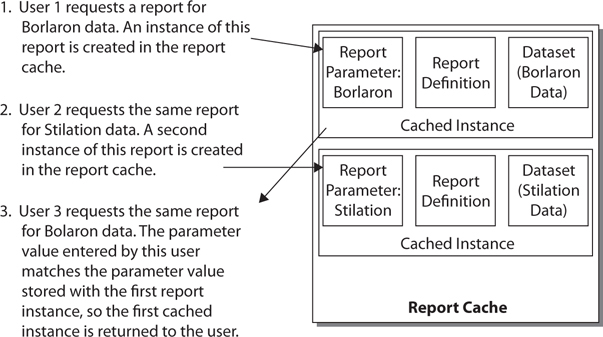
Figure 12-16 Report caching with parameters
Not all users can change report caching properties. To change the report caching properties for a report, you must have rights to the Manage Reports task. Of the five predefined security roles, the Content Manager, My Reports, and Publisher roles have rights to this task.
Report caching is a great tool for improving the performance of reports with long execution times, but one problem still exists. The first user who requests the report after the cached instance has expired must wait for the report to be created from the underlying data. It would be nice if there were a way to have cached report instances created automatically so no user has to endure these wait times. Fortunately, Reporting Services can do this as well.
A report snapshot is another way to create a cached report instance. Up to this point, we have discussed situations where cached report instances are created as the result of a user action. A user requests a report, and a copy of that report’s intermediate format is placed in the report cache. With report snapshots, a cached report instance is created automatically.
Report snapshots can create cached report instances on a scheduled basis, or they can be created as soon as this feature is turned on for a particular report. If a schedule is used, each time the schedule is run, it replaces the current cached instance with a new one. Cached report instances created by a report snapshot are used to satisfy user report requests the same as any other cached report instance.
You can enable the creation of report snapshots using two methods. Let’s look at the manual method first.
Let’s try enabling report snapshots for the EmployeeList report.
1. Navigate to the Chapter08 folder in the web portal, if you are not already there.
2. Click the ellipsis (…) button on the EmployeeList entry, and select MANAGE. The Properties page appears.
3. Select Caching from the left side of the screen. The Caching page appears.
4. Select the Always run this report against pregenerated snapshots option near the top of the page.
5. Check the Create a cache snapshot when I click Apply on this page check box.
6. Click Apply. As soon as you click Apply, the report server executes the report and places an instance of the report in the report cache. Allow time for this process to complete.
NOTE
An error message dialog box may appear when creating a report snapshot. When a report snapshot is created, it is done as a background process, so no one will be available to select values for the report parameters. If the parameters do not have default values, the report server will not know what values to use when the report is run by the schedule. Consequently, an error occurs. If you see this error, go to the Parameters page and add default values for all parameters.
7. Click the Chapter08 link in the breadcrumbs, and then select EmployeeList to run the report.
The report is rendered from the cached report instance created by the report snapshot.
Now let’s try the scheduled approach to creating report snapshots.
1. Click the Chapter08 link in the breadcrumbs
2. Click the ellipsis (…) button in the EmployeeList item and select MANAGE. The Properties page appears.
3. Select Caching from the left side of the screen. The Caching page appears.
4. Check the Create cache snapshots on a schedule check box.
5. “Report-specific schedule” is selected by default. Click the Edit schedule link next to Report-specific schedule. The Schedule page appears.
6. You can specify hourly, daily, weekly, monthly, or one-time schedules. The Day option should be selected by default. Leave this option selected.
7. Select the On the following days option, if it is not already selected.
8. Uncheck all the days except for today. (If you are reading this on Monday, for example, leave only Monday checked.)
9. Set the start time to five minutes from now.
10. Select today’s date for Begin running this schedule on.
11. Check the Stop this schedule on check box, and then select tomorrow’s date.
NOTE
I know this schedule does not fit the stated business requirements of refreshing the report at five minutes past the hour. However, you probably don’t want to waste computer resources generating a report snapshot of the EmployeeList report hour after hour, day after day, so we use this schedule for the demonstration.
12. Click Apply to return to the Caching page. Note the description of the schedule you just created under Report-specific schedule.
13. Click Apply to save your changes to the report snapshot settings. After five minutes, the scheduled report snapshot will create a cached instance of the report.
14. After the five minutes has elapsed, click the Chapter08 link in the breadcrumbs, and then click the EmployeeList entry to run the report. (Go grab some caffeine while you are waiting. You wouldn’t want to fall asleep while you are working through all this good stuff!) The EmployeeList report runs and is rendered from the cached report instance created by your scheduled report snapshot.
This type of report snapshot schedule would be appropriate for a report whose underlying data is changed only periodically (again, think of a data warehouse updated from a transactional system). The report snapshot would be scheduled to create a new cached instance of the report right after the new data is available in the warehouse.
Not all users can change report snapshots. To change the report snapshot properties for a report, you must have rights to the Manage Reports task. Of the five predefined security roles, the Content Manager, My Reports, and Publisher roles have rights to this task.
There are limitations to each of the two processing options just discussed: caching and report snapshots. Caching does not create a cached copy of a report until the report is actually executed by a user. If a report has a number of parameters, then a cached copy of the report suitable to satisfy requests for a given combination of parameters is not created until a user first executes the report with that combination of parameters.
Report snapshots allow for a “preexecuted” version of a report to be created in advance, but that preexecuted version can only be created for the default parameters assigned to that report. Given these limitations, it is clear we need a more flexible form of caching. Fortunately, Reporting Services has cache refresh options to fill this need.
The cache refresh options available in Reporting Services give us a more powerful way to control the content of our report cache. Cache refresh plans give us the ability to schedule the execution of a report with any given combination of parameters we desire. When this scheduled execution occurs for a report that has caching enabled, the resulting intermediate format is placed in the report cache. As long as we can create cache refresh plans for all possible parameter combinations, or more realistically, all common or likely parameter combinations, we can ensure that our users get all the benefits of receiving reports from cache even when the report is highly parameterized.
Let’s return to our EmployeeList report one more time and create a cache refresh plan. We first need to change the processing options for the report from using the report snapshot back to using caching.
1. Navigate to the Chapter08 folder in the web portal, if you are not already there.
2. Click the ellipsis (…) button in the EmployeeList entry and select MANAGE. The Properties page appears.
3. Select Caching from the left side of the screen. The Caching page appears.
4. Select Cache copies of this report and use them when available.
5. Under Cache Expiration, select the Cache expires on a schedule option.
6. Report-specific schedule is selected by default. Click the Edit schedule link next to Report-specific schedule.
7. Leave Day selected, and select Every weekday in the Daily Schedule area.
8. Set Start Time to 1:00 A.M.
9. Uncheck the Stop this schedule on check box near the bottom of the page.
10. Click Apply to return to the Caching page.
11. Click Apply to save your changes to the report cache settings.
12. Click the Manage refresh plans link next to the Cache refresh plans heading. The Cache refresh plans page appears.
13. Click the New cache refresh plan button. The Edit cache refresh plan page appears.
14. Enter Group By City for Description.
15. Click the Edit schedule link. The Schedule page appears.
16. Leave Day selected, and select Every weekday in the Daily Schedule area.
17. Set Start Time to 1:05 A.M.
18. Click Apply to return to the Edit cache refresh plan page.
19. Note in the Parameter values area that the report parameter is set to use the default value. Let’s try something a little different. In the Group By row under Source of value, select Enter value from the drop-down list.
20. In the Group By row under Value/Field, select City from the drop-down list. The Edit cache refresh plan page appears as shown in Figure 12-17.
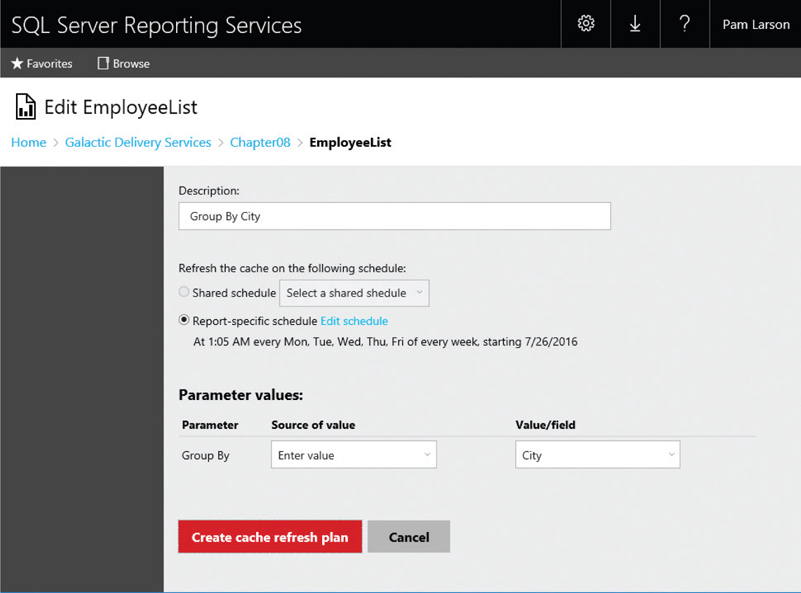
Figure 12-17 The Edit Cache Refresh Plan page
21. Click Create cache refresh plan to exit the Edit cache refresh plan page.
NOTE
The settings in this example have created scheduled processes that will run each night on your report server at 1:00 A.M. and 1:05 A.M. If you do not want these processes to run each night, you may want to delete the cache refresh plan and turn off report caching.
The EmployeeList report is now set to expire its cache every weekday at 1:00 A.M. and then at 1:05 A.M. create a cached copy of the report run with the Group By parameter set to City. To get adequate caching coverage, we would need to continue this process and create cache refresh plans for the EmployeeList report for each of the other values for the Group By parameter. If you want to go through that exercise, you are welcome to do so, but I think you probably get the gist of how it works at this point.
The report history feature of the web portal enables you to keep copies of a report’s past execution. This lets you save the state of your data without having to save copies of the data itself. You can keep documentation of inventory levels, production schedules, or financial records. You can look back in time, using the report history, to do trend analysis or to verify past information.
To demonstrate the report history feature of Reporting Services, we need a report whose results change often. It just so happens we created such a report in Chapter 9. The TransportMonitor report provides different values every time the report is run. We can move that report to the report server and then enable the report history.
1. If you composed your reports with SSDT or Visual Studio, upload the TransportMonitor report from the Chapter09 project.
2. Navigate to the Chapter09 folder, click the ellipsis (…) button on the TransportMonitor entry, and select MANAGE. The Properties page appears.
3. Click Parameters on the left side of the page.
4. Select the Use default check box.
5. Click the drop-down arrow under Default value. A blank data entry area appears.
6. Type 1304 in the data entry area.
7. Click Apply.
8. Click History snapshots on the left side of the page.
9. Click the Schedule and settings button. The Snapshot Schedule and settings page appears, as shown in Figure 12-18.
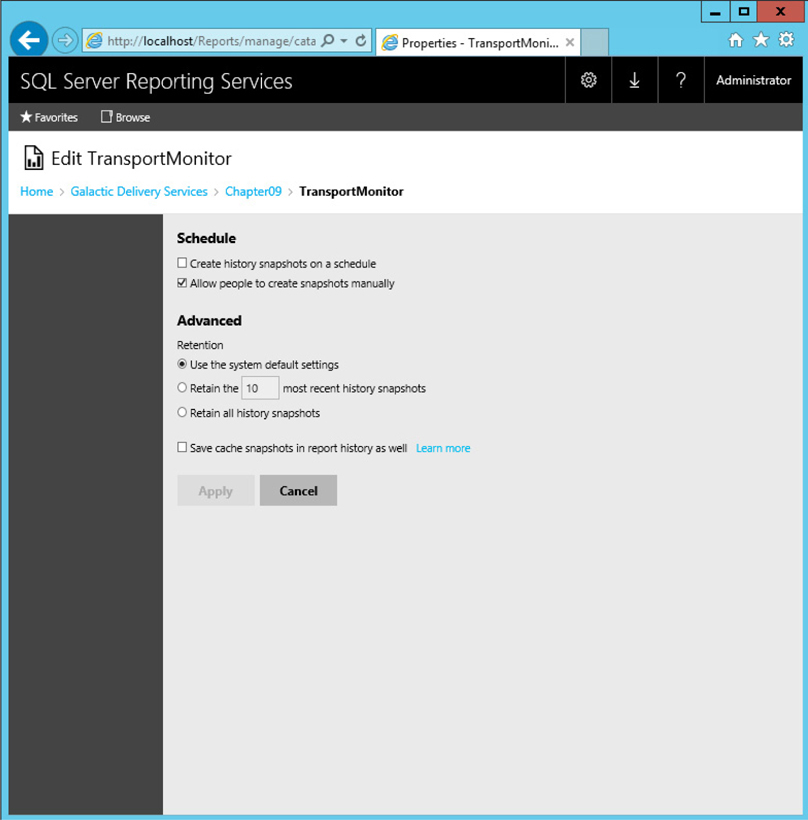
Figure 12-18 The Snapshot Schedule and settings page
10. Make sure the Allow people to create snapshots manually check box is checked. If it is not, check it and click Apply; otherwise, click Cancel to return to the History snapshots page.
One way to create a report history is to do so manually. We can give this a try in the following example.
1. Click the New history snapshot button in the toolbar. An entry for a report history snapshot appears.
2. Click the New history snapshot button two more times to create two more report history snapshots, as shown in Figure 12-19.
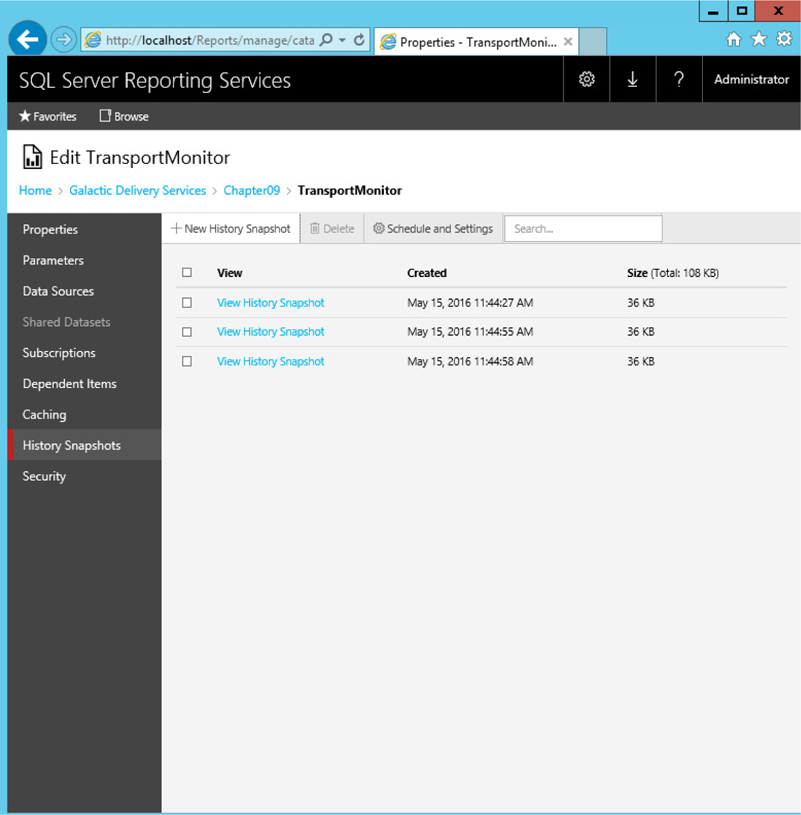
Figure 12-19 The History Snapshot page
3. Hold down the SHIFT key and click the View history snapshot link for the first report history snapshot you created. This report appears.
4. Open the other two report history snapshots in the same manner, and compare all three.
As with the cached report instances, the report history snapshots store the intermediate format of the report. Because of this, you can export this report to any of the rendering formats.
1. Select one of your browser windows containing a report history snapshot.
2. Export the snapshot to the PDF file format, and open it in Adobe Acrobat Reader.
3. Close Acrobat Reader and the browser windows containing your report history snapshots.
To make our TransportMonitor report work with report history snapshots, we had to provide a default value for the transport number parameter. Parameters cannot be changed when each snapshot is created. (They can be changed, however, if the report is run normally through the web portal.)
Essentially, we are saving report history snapshots for only one transport. To save report history snapshots for other transports, we need to create linked reports with parameters defaulted to the other transport numbers.
1. Click Properties on the left side of the page.
2. Click Create linked report.
3. Type Transport 1305 Monitor for Name and The Transport Monitor Report for Transport 1305 for Description.
4. Click Create. The linked report is created.
5. Click Parameters on the left side of the page.
6. Change Default Value to 1305. You will need to click the drop-down arrow next to the Default Value and edit the value in the drop-down entry area.
7. Click Apply.
8. Click History snapshots on the left side of the page.
9. Click New history snapshot.
10. Click the View history snapshot link. You can see this is a snapshot for transport number 1305.
We can create as many linked reports as we need to collect report history snapshots for the different possible parameter values. Remember, linked reports all point back to a single report definition. If the TransportMonitor report is ever updated, it only needs to be deployed to one location, and all the linked reports will have the updated report definition.
You can create report history snapshots in two other ways in addition to the manual method just described. You can instruct the report server to create a report history snapshot each time it creates a cache snapshot. With this setting turned on, any time the report server creates a cache snapshot—either manually or on a scheduled basis—a copy of that cache snapshot is saved as a history snapshot.
You can also set up a schedule to create report history snapshots. Let’s give that a try.
1. Click the Chapter09 link at the top of the page.
2. Click the ellipsis (…) button on the TransportMonitor report entry (the original report, not the linked copy), and select MANAGE. The Properties page appears.
3. Click History snapshots on the left side of the page.
4. Click the Schedule and settings button in the toolbar.
5. Check the Create history snapshots on a schedule check box.
6. The Report-specific schedule option is selected by default. Click Edit schedule next to Report-specific schedule. The Schedule page appears.
7. Select Hour.
8. Change the Hourly schedule to run every 00 hours 01 minutes. Set Start time to five minutes from now.
9. Today’s date should be selected for Begin running this schedule on.
10. Check the Stop this schedule on check box, and set it to tomorrow’s date.
11. Click Apply. Note the description of the schedule you just created under Report-specific schedule.
12. Click Apply to save your changes to the history snapshot settings.
As each minute passes beyond the time you chose for the schedule to start, a new report history snapshot is created. You need to refresh your browser to see the new history snapshots in the list.
Not all users can change report history snapshot properties. To change the report history snapshot properties for a report, you must have rights to the Manage Report History task. Of the five predefined security roles, the Content Manager and My Reports roles have rights to this task.
You will not usually have a report that requires a new report history snapshot every minute of the day, as we set up in our example. Even so, report history snapshots can start to pile up if you let them. Making business decisions about the number of history snapshots to save for each report is important. Even more important, then, is to implement those business decisions and manage the number of history snapshots being saved on the report server.
Reporting Services provides a way to limit the number of history snapshots saved for any given report. Let’s take a look and put a limit on our TransportMonitor report snapshots at the same time.
1. Click the Schedule and settings toolbar button.
2. In the Advanced area under Retention, select the Retain the ____ most recent history snapshots option.
3. Set the limit to 5.
4. Click Apply to save your changes to the history snapshot settings.
If you waited long enough to accumulate more than five report history snapshots, you see the list was reduced to the five most recent history snapshots. The older history snapshots were automatically deleted. As each new history snapshot is created, the oldest history snapshot is deleted, so the total always remains at five. Again, remember you need to refresh your browser to see these changes as each minute passes.
We chose to set a limit on the number of history snapshots saved for this report. In addition to this option, you have two others to choose from (see Figure 12-18). You can keep an unlimited number of history snapshots, or you can use the default setting for history snapshot retention. You see how to change this default setting in the section “The General Site Settings Page.”
In addition to using the history snapshot limit on the Snapshot Schedule and settings page, you can manually delete unwanted history snapshots.
1. Refresh your browser.
CAUTION
If you reached the limit of five history snapshots, the report server is automatically deleting old history snapshots as new ones are created. If your Report History page is not current, you could try to delete a history snapshot that has already been removed by the report server. This results in an error.
2. Check the check box for three of the history snapshot entries.
3. Click the Delete button in the toolbar.
4. Click Yes to confirm the deletion.
The report server again accumulates history snapshots for this report until it has reached our five-snapshot limit. At that point, it again deletes the oldest history snapshot as each new one is created.
We can now disable the creation of report history snapshots for this report so we are not wasting valuable execution cycles.
1. Click the Schedule and settings toolbar button.
2. Uncheck the Create history snapshots on a schedule check box.
3. Click Apply.
New history snapshots are no longer created for this report on a scheduled basis. Note, however, that the existing history snapshots were not deleted. These history snapshots are still available for viewing, even though the schedule that created them was disabled.
One of the best features of report history snapshots is this: they are not lost if the definition of the underlying report is changed. Let’s see this in action.
1. Open the TransportMonitor report in your report authoring environment of choice.
2. In the Report Data window, right-click the entry for the TransportMonitor dataset, and select Dataset Properties from the context menu. The Dataset Properties dialog box appears.
3. Select the Filters page.
4. Click the Add button to add a filter.
5. Select [Item] from the Expression drop-down list. Select <> from the Operator drop-down list. Enter Thruster for the Value. This filter removes the thruster data from the report.
6. Click OK to exit the Dataset Properties dialog box.
7. Preview/run the report. Check 1304 in the Transports drop-down list, and click View Report. Note the Thruster graph is missing.
9. If you are using SSDT or Visual Studio, deploy the report.
10. Close your development environment.
11. Return to the web portal in your browser.
12. If you are using Report Builder, you need to reset the parameter default. Go to the Parameters page to select the Has Default check box, type 1304 for Default Value, and click Apply.
13. Select the Chapter09 link in the breadcrumbs, and then select the entry for TransportMonitor to run the report. Note the report now includes our change, eliminating the thruster data from the report.
14. Select the Chapter09 link in the breadcrumbs again.
15. Click the ellipsis (…) button for the TransportMonitor report and select MANAGE.
16. Click History Snapshots on the left side of the page. This should return you to the Report History page. We still have some report history snapshots based on the old report definition.
17. Click the New history snapshot button to manually create a report history snapshot based on the new report definition. Our five-history-snapshot limit is still in effect, so one of the old history snapshots may have to be deleted to make room for the new one.
18. Click the most recent history snapshot to view it. It does not contain thruster data because it is based on the new report definition.
19. Click your browser’s back button.
20. Click the oldest history snapshot to view it. It does contain thruster data because it is based on the old report definition.
Just like the cached report instance, the history snapshot contains both the report definition and the dataset. Therefore, it is unaffected by subsequent changes to the report definition.
Up to this point, we have discussed only one way for users to receive reports. They log on to the web portal site, find the report they want, and execute it, which is known as pull technology. The user pulls the information out of Reporting Services by initiating the execution of the report.
Reporting Services also supports push technology for delivering reports. In a push technology scenario, Reporting Services initiates the execution of the report and then sends the report to the user. This is done through the report subscription.
Reporting Services supports several types of subscriptions. The first is the standard subscription, which is a request to execute a report once and push the result to a particular user or set of users. The standard subscription is usually a self-serve operation. A user logs on to the web portal site and finds the report they want. The user then creates the subscription by specifying the schedule for the push delivery and the delivery options.
Standard subscriptions have two delivery options: e-mail and file share. The e-mail delivery option, of course, sends an e-mail to the specified e-mail addresses with a link to the report or with the report itself either embedded as HTML or as an attached document. The file share option creates a file containing the report in a specified folder on a file share. The file share option can be used to place the report into a document store managed and/or indexed by another application, such as Microsoft’s Office SharePoint Server.
You have been hired as a maintenance worker for Galactic Delivery Services in charge of Transport 1320. It is important you monitor the information from Transport 1320 on a regular basis. Rather than taking the time to go look at the TransportMonitor report on the web portal, you want to have the report e-mailed to you hourly.
1. Open the web portal, and navigate to the Chapter09 folder.
2. Click the ellipsis (…) button in the TransportMonitor entry, and select MANAGE. Click Subscriptions on the left side of the page.
3. Click New subscription. The Subscription Properties page appears, as shown in Figure 12-20.
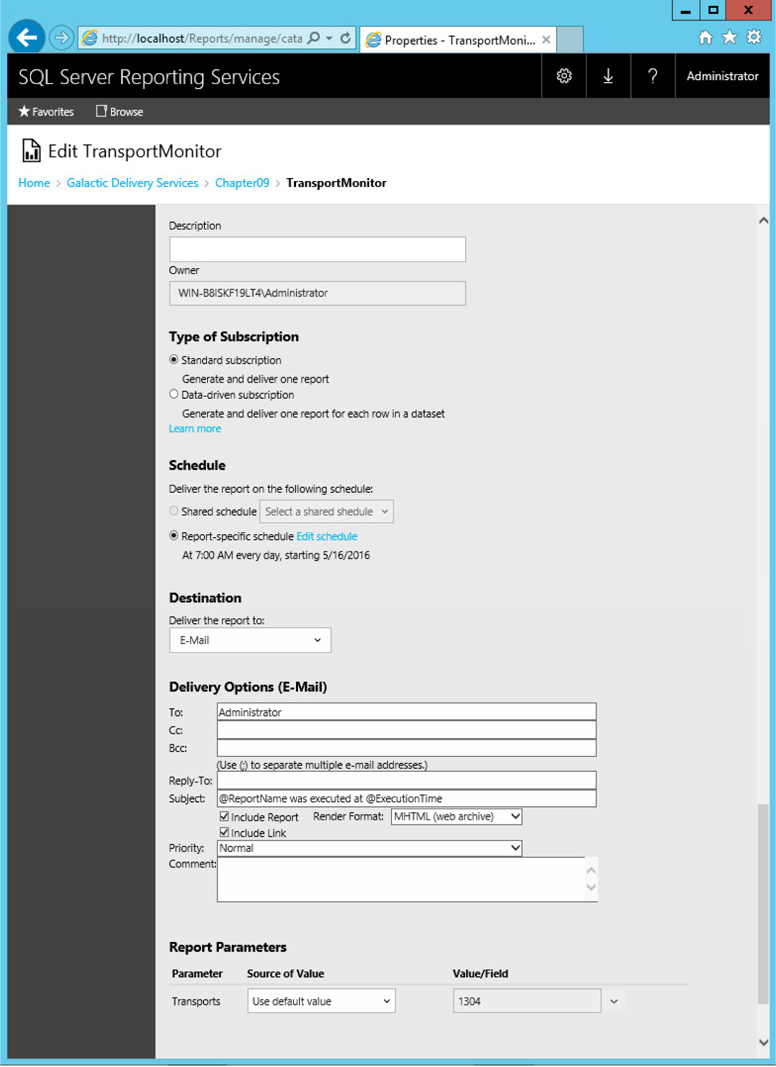
Figure 12-20 The Subscription Properties page
4. For Description, type Hourly Transport Report for Trans #1320.
5. We are creating a standard subscription, so ensure the Standard subscription radio button is selected.
6. The Report-specific schedule radio button should be selected. Click Edit schedule. The Schedule page appears.
7. Select Hour.
8. Leave the schedule to run every 1 hour and 00 minutes. Set the start time to five minutes from now.
9. Today’s date should be selected for Begin running this schedule on.
10. Check Stop this schedule on, and select tomorrow’s date.
11. Click Apply to return to the Subscription Properties page.
NOTE
Your report server must be configured with an e-mail server in order to use the E-mail delivery option. If you do not see the E-mail option in the Deliver the report to drop-down list, use the Reporting Services Configuration Manager to add an e-mail server to the configuration. If this is not possible, simply change the following exercises to deliver the subscriptions to a file share rather than having the reports e-mailed. If you use the file share delivery method, you will have to adjust the subscription creation steps accordingly.
12. In the Destination section, the Deliver the report to drop-down list defaults to E-Mail. Leave this set to the default setting.
13. Type your e-mail address for To. Note that you can enter multiple e-mail addresses, separated by a semicolon (;), and you can also enter e-mail addresses for Cc and Bcc.
14. Enter an e-mail address for Reply-To. This can be your own e-mail address, someone else’s, or a dummy e-mail address that does not exist.
15. By default, the subject of the e-mail is the name of the report, followed by the time the report was executed. Change Subject to @ReportName.
16. Leave the Include report check box checked. This includes the report in the e-mail. Uncheck the Include link check box.
17. The Render format drop-down list defaults to MHTML (web archive). Leave this selected.
18. Select High from the Priority drop-down list.
19. For Comment, type This e-mail was sent from Reporting Services.
20. In the Source of Value column for the Transports parameter row, select Enter value from the drop-down list.
21. In the Value/Field column, click the drop-down arrow.
22. Uncheck 1304.
23. Check 1320.
24. Click Create subscription to create this standard subscription and return to the Subscriptions page. You will see an entry for your new subscription.
25. After the time specified by your schedule has passed, refresh this page. You should see the time of the execution in the Last Run column and Mail Sent To, followed by your e-mail address, in the Result column. You should also have a high-priority e-mail waiting for you in your mailbox.
26. Do not delete this subscription until you have had a chance to look at the My Subscriptions page in the section “My Subscriptions.”
You have just been promoted to sales manager for the Axelburg office of Galactic Delivery Services. Congratulations! Being a good manager, you want to keep tabs on how your salespeople are doing. To do this, you want to view the Invoice-Batch Number Report each week to see how much you are invoicing your clients. As a memory aid, you want to receive an e-mail each week with a link to this report.
1. Open the web portal, and navigate to the Axelburg folder.
2. Click the ellipsis (…) button in the Invoice-Batch Number Report entry, and select MANAGE.
3. Select Subscriptions on the left side of the page. The Subscriptions page appears.
4. Click the New subscription button.
5. For Description, type Axelburg Sales Report.
6. Click the Edit schedule link. The Schedule page appears.
7. Select Week.
8. Leave Repeat after this number of weeks set to 1.
9. Check today for On day(s). For example, check Mon if today is Monday. Uncheck all the other days.
10. Set the start time to five minutes from now.
11. Today’s date should be selected for Begin running this schedule on.
12. Check Stop this schedule on, and select tomorrow’s date.
13. Click Apply to return to the Subscription Properties page.
14. The Deliver the report to drop-down list defaults to E-Mail. Leave this as the default setting.
15. Type your e-mail address for To.
16. Enter an e-mail address for Reply-To.
17. Change Subject to @ReportName.
18. Uncheck the Include report check box. Leave the Include link check box checked.
19. Select High from the Priority drop-down list.
20. For Comment, type Remember to check the invoice amounts.
21. At the bottom of the Schedule Properties page, you see a list of the parameters for the selected report. Leave the default values for the parameters.
22. Click Create subscription to create this standard subscription.
When the scheduled time has passed, you will receive an e-mail with a link to this report.
Nothing prevents a user from creating more than one subscription for the same report. Perhaps you want a report delivered every Friday and on the last day of the month. You can’t do this with one subscription, but you can certainly do it with two—a weekly subscription for the Friday delivery and a monthly subscription for delivery on the last day of the month.
Another reason for multiple subscriptions is to receive a report run for multiple sets of parameters. You saw it is possible to specify parameter values as part of the subscription properties. Using this feature, you could have one subscription send you a report with one set of parameters and another subscription send you the same report with a different set of parameters.
When you choose to include the report along with the subscription e-mail, the report can show up either embedded in an HTML e-mail or as an attached document. If you select the MHTML Web Archive format, the report is embedded. If you select any of the other render formats, the report is sent as an attached document.
Having the report embedded in the e-mail makes it convenient for the user to view the report: it is simply part of the body of your e-mail. However, not all e-mail packages support HTML e-mail, so some users might be unable to view an embedded report. If a user is unsure of the capabilities of their e-mail package, they should choose the PDF file format. This format is sent as an attachment and can be viewed by just about anyone.
Not all users can create standard subscriptions. In fact, it is possible to view a report but not be able to subscribe to it. To subscribe to a report or create a subscription for delivery to others, you must have rights to the Manage Individual Subscriptions task. Of the five predefined security roles, the Browser, Content Manager, and My Reports roles have rights to manage individual subscriptions.
An active user may subscribe to a number of reports scattered throughout a number of folders. Just remembering all the reports you subscribed to can be a big challenge. Managing all those subscriptions can be even tougher. Fortunately, the web portal provides a way to view all your subscriptions in one place.
The My subscriptions page consolidates all your standard subscriptions in one place.
1. Click the Settings button (the cog icon) at the top of the web portal page and select My subscriptions from the drop-down menu. The My subscriptions page appears, as shown in Figure 12-21.
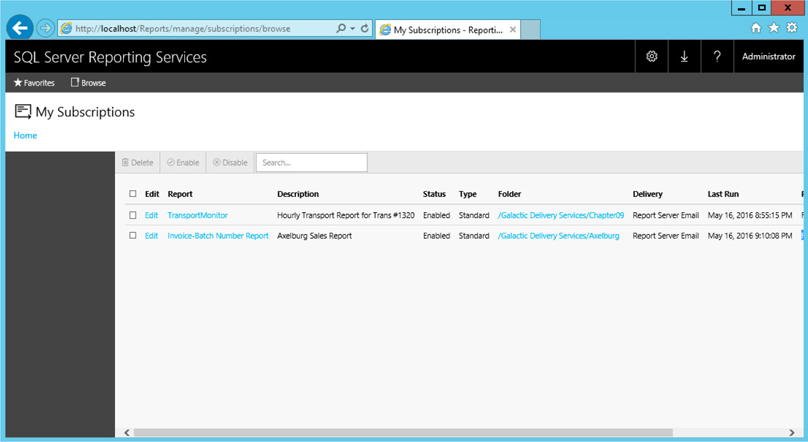
Figure 12-21 The My subscriptions page
2. Click the Edit link for the “Hourly Transport Report for Trans #1320” subscription. The Subscription Properties page appears.
3. You can make changes to this subscription, if you desire. Click Cancel to return to the My Subscriptions page.
4. Click the TransportMonitor link in the Report column. You jump to the TransportMonitor report.
5. Click your browser’s Back button.
6. Click the text in the Folder column for the “Axelburg Sales Report” subscription. You jump to the Axelburg folder.
7. Click your browser’s Back button.
The My subscriptions page lists all the standard subscriptions you created on this report server. This makes the subscriptions much easier to manage. You can also use the My subscriptions page to delete unwanted subscriptions.
Let’s delete these subscriptions so you do not waste computing power e-mailing reports.
1. Check the check box for the Hourly Transport Report for Trans #1320 subscription.
2. Click Delete in the toolbar.
3. Click OK to confirm the deletion.
4. Repeat Steps 1 through 3 for the Axelburg Sales Report subscription.
5. Click the Home link in the breadcrumbs. You return to the Home folder.
A better name for a data-driven subscription might be “mass mailing.” The data-driven subscription enables you to take a report and e-mail it to a number of people on a mailing list. The mailing list can be queried from any valid Reporting Services data source. In addition to the recipient’s e-mail address, the mailing list can contain fields that are used to control the content of the e-mail sent to each recipient. As mentioned in Chapter 2, the Enterprise Edition of Reporting Services is required for you to use data-driven subscriptions.
Each mechanic on staff has been assigned one transport to monitor closely. To facilitate this, the TransportMonitor report should be e-mailed to each mechanic every four hours. Each mechanic should receive the TransportMonitor report with only the data for the transport they are to monitor. Mechanic I employees have been assigned the transports showing more issues, so their e-mails should be assigned high priority. The e-mails to the Mechanic II employees should be sent with normal priority.
1. Open the web portal, and navigate to the Chapter09 folder.
2. Click the ellipsis (…) button for the TransportMonitor entry, and select MANAGE.
3. Click Subscriptions on the left side of the page.
4. Click the New subscription button.
5. For Description, type Mechanics 4-hour Transport Monitor.
6. Select the Data-driven subscription radio button. The Subscription Properties page will change to include additional fields for the data-driven subscription.
7. Click the Edit schedule link.
8. Select the Hour option.
9. Change the schedule to run every 4 hours 00 minutes.
10. Set the start time to five minutes from now.
11. Today’s date should be selected for Begin running this schedule on.
12. Check Stop this schedule on, and select tomorrow’s date.
13. Click Apply.
14. Select E-Mail from the Deliver the report to drop-down list.
15. Click Edit dataset. The Dataset page appears.
16. Click the ellipsis (…) button next to Select a shared data source. The Data source dialog box appears.
17. Navigate to the Shared Data Sources folder and select the Galactic data source.
18. Type the following in the large Query entry area:

19. Click Validate query to make sure you don’t have any typos or other problems. The Dataset page appears as shown in Figure 12-22.
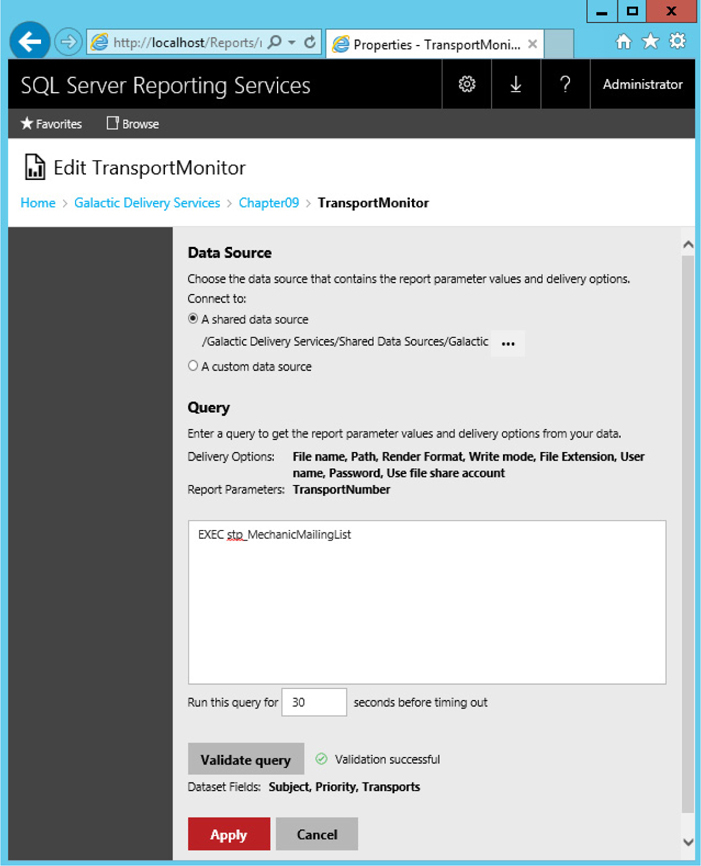
Figure 12-22 The Data-Driven Subscription Dataset page
20. Click Apply. You return to the Subscription Properties page.
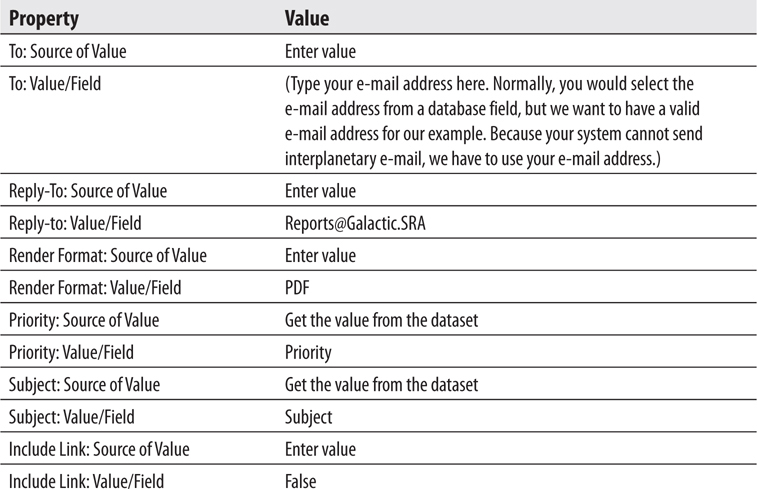
21. Set the following properties in the Delivery Options (E-Mail) section of this page:
22. Set the following properties in the Report Parameters section of this page:
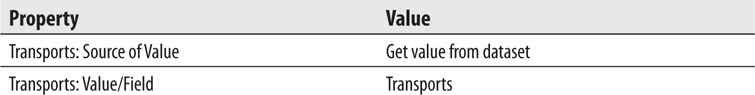
When you are done, the Subscription Properties page should appear as shown in Figure 12-23.
Figure 12-23 The Data-Driven Subscription Properties page
23. Click Apply to create the subscription.
24. Once the scheduled time for your subscription has passed, refresh this page. You should see the time of the execution in the Last Run column and Done: 8 processed of 8 total; 0 errors in the Result column. You should also receive eight e-mails (eight mechanics are in the database, and we sent an e-mail to each one) with the TransportMonitor report attached.
25. If you do not want to receive eight e-mails every four hours for the next day, you can delete this subscription.
Not all users can create data-driven subscriptions. To create a data-driven subscription for a report, you must have rights to the Manage All Subscriptions task. Of the five predefined security roles, only the Content Manager role has rights to this task.
You can do a couple of tricks with data-driven subscriptions that make them even more powerful. For instance, at times, you might not want a subscription sent out until after a certain event has occurred. For instance, you may want to e-mail a report to a number of recipients after a specific data update process has completed. Although a data-driven subscription is a scheduled process, rather than triggered by a particular event, we can make it behave almost as if it were event driven.
You need a field in a status table that contains the completion date and time of the last data load. You also need a field in a status table that contains the date and time when the report was last distributed. With these two flag fields in place, you can simulate event-driven behavior for your data-driven subscription.
First, you need to build a stored procedure that returns the mailing list for the report distribution. To this stored procedure, add logic that checks the date and time of the last data load against the date and time of the last report distribution. If the data load is complete and the report has not yet been distributed today, the stored procedure returns the mailing list result set. If the data load is incomplete, or if the report has already been distributed today, the stored procedure returns an empty result set.
Now you create a series of data-driven subscriptions based on this stored procedure. If the data load completes sometime between 1:00 A.M. and 3:00 A.M., you might schedule one data-driven subscription to execute at 1:00 A.M., another at 1:30 A.M., another at 2:00 A.M., and so on. When each data-driven subscription executes, the stored procedure determines whether the data load is complete and whether the report was already distributed. If the stored procedure returns a result set, the data-driven subscription e-mails the report to the mailing list. If the stored procedure returns an empty result set, the data-driven subscription terminates without sending any e-mails.
This same approach can be used to e-mail reports only when the report data has changed. You create a stored procedure that only returns a mailing list result set if the data has changed since the last time the report was e-mailed. This stored procedure is used to create a data-driven subscription. Now the data-driven subscription only sends out reports when the data has changed; otherwise, it sends nothing.
If you looked closely, you may have noticed that the Deliver the report to drop-down list for data-driven subscriptions includes an entry for something called the Null Delivery Provider. This doesn’t seem to make much sense—why would you create a subscription and then not send it anywhere? This Null Delivery Provider is used to support report caching.
The Null Delivery Provider allows us to use a data-driven subscription as a data-driven cache refresh plan. Rather than creating a number of cache refresh plans to account for all of the possible parameter combinations we want to cache, we could create one data-driven subscription that ran the report for all of those possible parameter combinations. In that case, we don’t really want the resulting reports to go anywhere except into cache, so we can use the Null Delivery Provider.
The first step to implement this scheme is to create a query that returns all the possible report parameter combinations (or at least the most popular ones) for this report. You then use this query to create a data-driven subscription to execute the report with each of these parameter combinations. If report caching is enabled, the data-driven subscription would cause a copy of the report to be cached with each of these parameter combinations. This is true even if the Null Delivery Provider is used and the report is never delivered anywhere by the subscription. Because the subscription created all these cached copies with the various parameter value combinations, no matter what combination of parameters a user enters the following day, the report is rendered from a cached copy.
When setting the limit for the number of history snapshots kept for a given report, we encountered a setting that referred to using a default value. Each time you have the opportunity to specify a schedule for an execution snapshot, a subscription, or other feature, you have an option to select a shared schedule. The report history snapshot default value, the shared schedules, and several other site-wide settings are managed on the Site settings page.
The main Site settings page enables you to set several default values and configuration options. This page also acts as a front end for other configuration screens. You can access the Site settings page by clicking the Settings button (the cog icon) at the top of the page and selecting Site settings from the drop-down menu. The General Site settings page is shown in Figure 12-24.
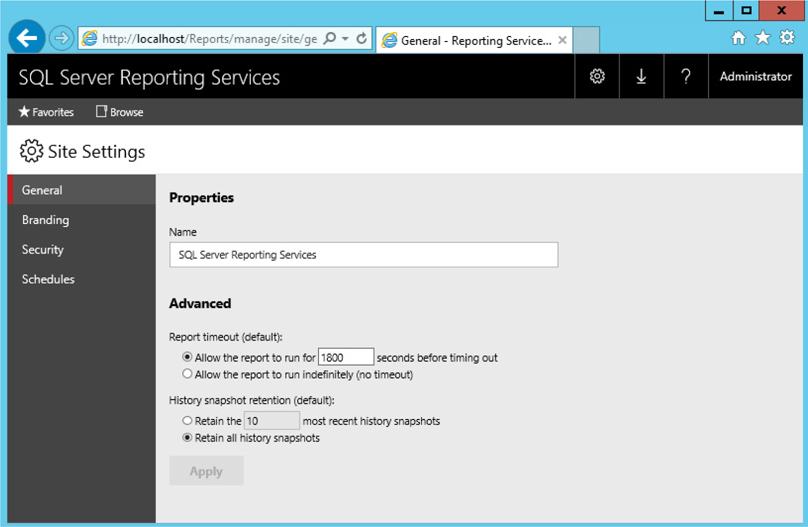
Figure 12-24 The General Site Settings page
We begin our examination of the site settings by looking at the configuration items and default values on the General Site settings page.
The value in the Name field appears at the top of each page in the web portal. You can change this to the name of your company or some other phrase that can help users identify this report server.
The default for Report timeout enables you to specify a default value for the maximum amount of time a report may run before it times out. This can be a specific number of seconds, or reports can be allowed to run indefinitely (no timeout). Each report can either specify its own timeout value or use this default value.
NOTE
The report timeout is specified on the Properties page for each report.
The report history default setting lets you specify a default value for the maximum number of history snapshots to keep. This can be set to a specific number or set to allow an unlimited number of snapshots. Each report utilizing report history snapshots can either specify its own maximum number or use this default value.
The Name item on the General Site settings page enables us to change the name at the top of each web portal page. Using the Name item, we can take a first step toward individualizing the web portal for our organization. The Branding Site settings page enables us to go quite a bit further in making our installation of the web portal unique.
The Branding Site settings page provides a method for us to upload a branding package. The branding package is a Zip file with two or three files contained inside. Those three files are
Metadata.xml
Colors.json
Logo file (optional)
The Metadata.xml file serves as the table of contents for the branding package. It provides references to the other two files in the package. The format of the Metadata.xml file is
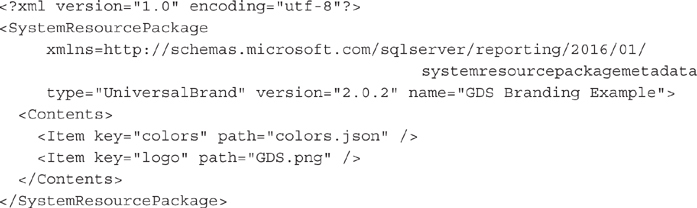
(In the actual Metadata.xml, “systemresourcepackagemetadata” should be on the same line as the rest of the xmlns property value.)
The name property in the Metadata XML structure can be set to whatever you like in order to identify your branding package. The path property associated with the logo file must be the name of the logo file loaded into the branding package. If no logo is included in the branding package, the entire Item element for the logo should be omitted from the Metadata.xml file.
The Colors.json file consists of sets of name/value pairs that are used to generate the cascading style sheet (CSS) that ultimately controls the look of the web portal. The Colors.json file will look similar to the following:
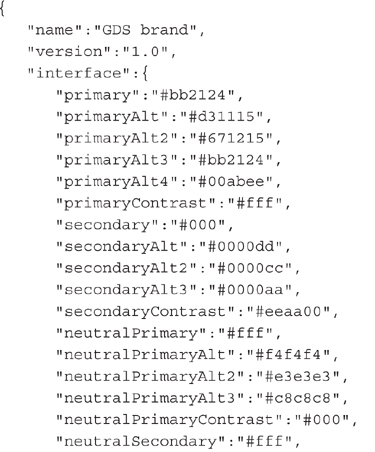

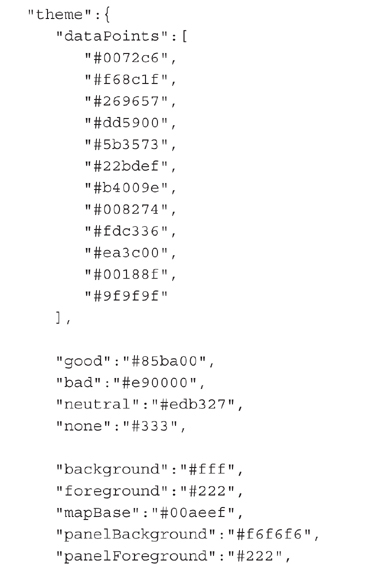
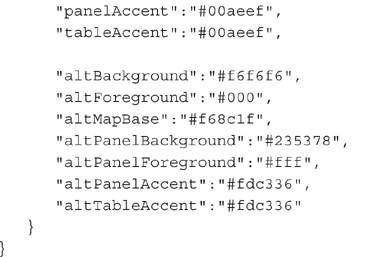
You will notice the color definitions form five groups: primary, secondary, neutral, danger/warning/success/info, and KPI. Neutral is further divided into neutral primary, neutral secondary, and neutral tertiary.
These color settings control the colors of the web portal as follows:
Primary Button and hover colors
Secondary Title bar, search bar, page menu (left side of the screen), and text on those items
Neutral Primary Home and report background colors
Neutral Secondary Settings menu, text box background, and folder options background
Neutral Tertiary Site settings background
Danger/Warning/Success/Info Colors for these dialog boxes
KPI Colors of the good, neutral, and bad states of the KPIs
Your branding colors can be carried over to your mobile reports as well. The first time you connect the Mobile Report Publisher to a server with a brand package loaded, the Mobile Report Publisher loads the color scheme from the brand package as another color palette. This color palette can then be used in your mobile reports.
When a logo file is included in the branding package, it takes the place of the name in the upper-left corner of the web portal pages. The logo file must be in the Portable Network Graphics (PNG) format. The logo file should be approximately 60 pixels high and 290 pixels wide.
Let’s try applying the brand package included with the materials for this book. Don’t worry. It is easy to remove a brand package after it is applied. You won’t be stuck with the GDS logo and a garish orange on your report server’s web portal.
NOTE
In preparation for these exercises, you will either need to obtain the “GDS web portal branding.zip” brand package from the materials for this book or create your own custom brand package.
Follow these steps to apply a brand package:
1. Open the web portal in your browser.
2. Click the Settings (cog) button at the top of the page and select Site settings from the drop-down menu.
3. Select Branding from the left side of the page.
4. Click Upload brand package. The Choose File to Upload dialog box appears.
5. Navigate to the Zip file containing your brand package.
6. Select the brand package Zip file and click Open. (If you are using the brand package from the materials for this book, select “GDS web portal branding.zip” and click Open.) The brand package will be applied, and the Branding page will appear as shown in Figure 12-25.
Figure 12-25 The Branding page
If you have a brand package applied to a report server but no longer have that brand package, you can download a copy of that brand package in order to make changes. Follow these steps:
1. Navigate to the Branding page within Site settings. (See the previous section.)
2. Click Download.
3. A file download bar or dialog box will appear depending on your browser. Save the branding file in the desired location.
Once you’ve made the desired changes, you can re-upload the branding file.
You can only download a brand package if a custom brand package has been applied to a report server. You cannot download the “default branding.”
Removing a brand package is extremely easy. Follow these steps:
1. Navigate to the Branding page within Site settings.
2. Click Remove.
3. Click Yes to confirm the removal of the brand package. The branding is removed.
In addition to the configuration options and default values managed on the General Site settings page and the branding on the Branding page, two other pages are available under the site settings. These pages enable you to manage the site-wide security configuration and the shared schedules. The following is a brief discussion of each of these areas.
Each time you had an option to create a schedule for a feature, such as report cache expiration or execution snapshot creation, it was accompanied by a choice to use a shared schedule. A shared schedule lets you use a single schedule definition in multiple places. A shared schedule is created through the same user interface used to create all the other schedules we have been looking at in this chapter.
Shared schedules are beneficial for situations where a number of events should use the same timing. For example, suppose you have ten reports that utilize report snapshots, all pulling data from a data warehouse. That data warehouse is updated once a week. It makes sense to create one shared schedule that can be used to run the report snapshots for all these reports.
Not only does this save the time that would otherwise be necessary to create the schedule ten times, but it also makes it easier if the timing of the data warehouse update is changed and the report snapshot schedule must be changed. If you are using a shared schedule, you only need to make this change once in the shared location. Without the shared schedule, you would be forced to make this change ten times.
The Security page lets you assign Windows users and Windows groups to system-level roles. These system-level roles provide users with the rights to view and modify settings for the report server, such as those found on the Site settings page. System Administrator and System User are the two predefined system-level roles.
For more information on system-level roles and system-level tasks, see Chapter 11.
In Chapter 11, we used the SQL Server Management Studio to help manage security on the report server. We created a new security role. We did this in the SQL Server Management Studio because this activity could not be done through the web portal. Let’s look at a couple of other aspects of report server management that require the SQL Server Management Studio.
Follow these steps to view the Server Properties dialog box in SQL Server Management Studio:
1. Start SQL Server Management Studio, and connect to the report server as we did in Chapter 11.
2. Right-click the report server in the Object Explorer window, and select Properties from the context menu. The Server Properties dialog box appears, as shown in Figure 12-26.
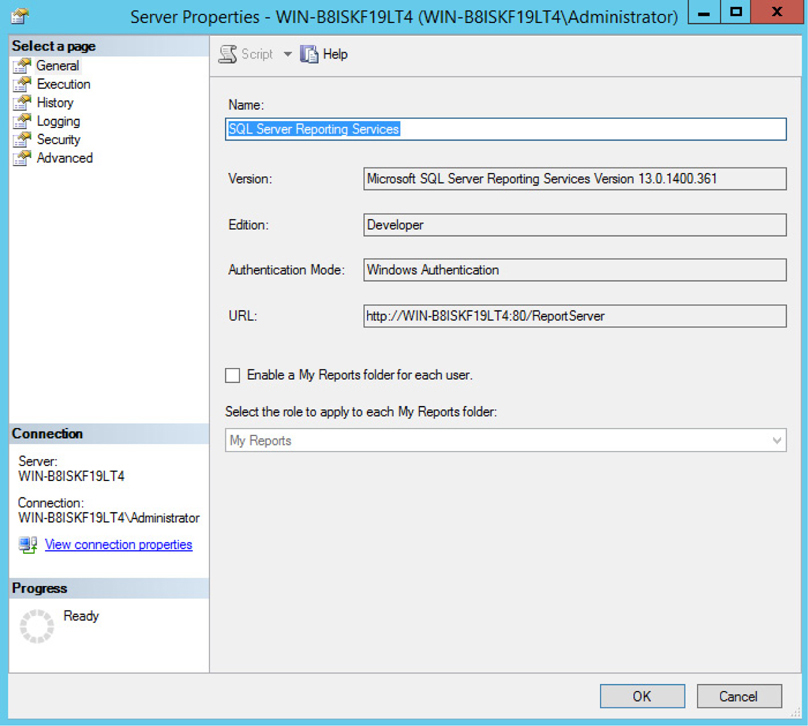
Figure 12-26 The Server Properties dialog box in SQL Server Management Studio
As you can see, a number of the characteristics of the report server that can be managed through the web portal can also be controlled here. We will not discuss this ground that has already been covered; instead, we will cover the items that are unique to the Server Properties dialog box.
The Enable a My Reports folder for each user option, on the General page of the Server Properties dialog box, turns on a feature giving each user their own private folder on the report server. When this option is enabled, a special folder called Users Folders is created in the Home folder. Only users assigned the System Administrator role can see this folder.
CAUTION
You should enable the My Reports option only if you intend to use it. Getting rid of the Users Folders folder and its content once it is created is a bit tricky. If you do create the folder and then need to delete it, turn off the My Reports option, go into each folder in the Users Folders folder, and give yourself Content Manager rights. Now you can delete the folders.
As each user logs on for the first time after the My Reports option is enabled, a new folder is created in the Users Folders folder. This new folder has the same name as the domain and logon name of the user signing in. The new folder is mapped to a folder called My Reports.
Let’s discuss an example to make this clearer. Sally and José are two users in the Galactic domain. Shortly after the My Reports option is enabled, Sally accesses the report server using the web portal. A new folder is created in the Users Folders folder called Galactic Sally.
Sally is not assigned the System Administrator role, so she cannot see the Users Folders folder or the Galactic Sally folder inside of it. Instead, when Sally views her Home folder, she sees a folder called My Reports. Sally’s My Reports folder is a mapping to the Galactic Sally folder.
When José accesses the report server using the web portal, a new folder is created in the Users Folders folder called Galactic José. José sees a folder called My Reports in his Home folder. José’s My Reports folder is a mapping to the Galactic José folder.
José is assigned the System Administrator role. In addition to the My Reports folder, José can view the Users Folders folder. When José opens the Users Folders folder, he can see both the Galactic Sally and the Galactic José folders. In fact, José can open the Galactic Sally folder and view its contents.
Because the My Reports folder is for each user’s personal reports, the users are granted more rights in the My Reports folder than they might be granted anywhere else on the site. On the General Settings page of the Site Settings, you decide which security role to assign to the user in their own My Reports folder. By default, users are assigned the My Reports role in their own My Reports folder.
A user can be granted broader rights in the My Reports folder because they are the only one using the reports in this folder. No one else is going to set up caching and report history snapshots, for example, because no one else is going to use these reports. You want to be sure to assign the user to a role that has rights to publish reports; otherwise, each user will be unable to put reports in their own My Reports folder.
The My Reports option can be useful in two situations. First, if you have a number of individuals creating ad hoc reports for their own personal use, the My Reports folder provides a convenient spot for this to take place. If you do use the My Reports folder in this manner, you want to have some policies in place to ensure that each user’s My Reports folder does not become an ad hoc dumping ground.
The second viable use of the My Reports folder is as a quality assurance (QA) testing area for report developers. The report developers can use their individual My Reports folders as a place to test a report in the server environment before it is deployed to a folder available to the users. This is convenient, because the system administrator can navigate through the Users Folders folder to access the report after it has passed QA testing and move it to its production location. Of course, having a dedicated quality assurance server for this purpose is far better, but in situations where this is not feasible, the My Reports folder can be considered as an option.
The Enable report execution logging option, on the Logging page of the Server Properties dialog box, determines whether information about each report execution is placed in the execution log. The execution log this option refers to is the ExecutionLogStorage table in the ReportServer database. This is not referring to any of the log text files created by the report server application. Along with turning logging off and on, you can specify how long the report server should keep these log entries.
The ExecutionLogStorage table uses cryptic globally unique identifier (GUID) strings to identify the reports being run. This is not going to be helpful when trying to figure out who has run the Invoice-Batch Number Report in the past month. Instead of querying the ExecutionLogStorage table directly, use the ExecutionLog2 view in the ReportServer database. This view decodes the GUID strings into the report paths and report names, making it much easier to work with.
In addition to the configuration items on the web portal Site settings page and the SQL Server Management Studio Server Properties dialog box, you can modify the functionality of the report server in other ways. In Chapter 13, we look at settings that can be changed using system properties. The system properties can be set through the Reporting Services Configuration Tool and through the SetSystemProperties method of the Reporting Services web service.
In this chapter, you learned ways to deliver reports and control their execution from within the web portal. In the next chapter, we look at ways to customize report delivery by building onto Reporting Services. These techniques enable you to integrate Reporting Services reports with your own websites and custom applications.