 Never Having to Say “I’m Sorry”
In This Chapter
Never Having to Say “I’m Sorry”
Putting the Report Template to Use

Basic training is at an end. Boot camp is over. You now know the basics of building reports in Reporting Services. You should be able to create reports, both with the Report Wizard and from scratch. When needed, you can spice up your reports with color, images, charts, and gauges—even maps.
In the last two chapters, you learned how to add punch to your reports with color and graphics. In this chapter, you learn how to add value to your reports through summarizing and totaling and added interactivity. All this enhances the users’ experience and allows them to more readily turn information into business intelligence.
We begin the chapter, however, by looking for a way to enhance your experience as a report developer. In the first section, we create a report template that can be used to standardize the look of your reports. The report template can also take care of some of the basic formatting tasks so they do not need to be repeated for each report.
Users can be particular about the way their reports are laid out. In many cases, you will be creating new reports to replace existing ones. It may be that the user was getting a report from a legacy system, from an Access report or a spreadsheet, or from a ledger book. Whatever the case, the user is accustomed to seeing the data presented in a certain way, with everything arranged just so.
Now you come along with Microsoft SQL Server 2016 Reporting Services, telling the user that the new reporting system is infinitely better than the old way—more efficient, more timely, and with more delivery options. That is all well and good with the user, but, invariably, the question will arise, “Can you make the report look the same as what I have now?” No matter how antiquated or inefficient the current reporting system might be, it is familiar, perhaps even comforting, to your users. Change is difficult. The irony of the human race is this: on a large scale, we like change, but on an individual level, we mainly want things to stay the same.
Even if Reporting Services is well established and you are not converting reports from an existing system, users still have preconceived notions. They have a vision for the way a new report should be laid out. These visions need to be respected. After all, the report developer is not the one who has to look at the report every day, week, or month—the user is! The user is the one who probably knows how to best turn the data into something useful.
What the users don’t want to hear is, “I’m sorry, but we can’t do it that way in Reporting Services.” You will be miles ahead if you spend your time fulfilling your users’ vision rather than trying to convince them that Reporting Services is a great tool, despite the fact that it cannot do what they want it to. The techniques in this section and also in parts of Chapter 9 can help you make Reporting Services reports do exactly what your users want them to. After all, if your users ain’t happy, ain’t nobody happy!
Successful report development means never having to say, “I’m sorry.”
Creating a reusable template for reports
Using values from the Built-in Fields collection
Business Need Galactic Delivery Services (GDS) is looking to increase the efficiency of its report developers. GDS would like a template that can be used for each new report created. The report template is to include the GDS logo and the company name in a header across the top of each page. The template is also to include a footer across the bottom of each page showing the date and time the report was printed, who printed the report, the current page number, and the total number of pages in the report.
1. Create a Template Report with a Page Header
2. Create the Page Footer on the Template Report
3. Copy the Template to the Appropriate Location
 SSDT and Visual Studio Steps
1. Create a new Reporting Services project called Template in the MSSQLRS folder. (If you need help with this task, see Chapter 5.)
2. Add a blank report called GDSReport to the Template project.
3. From the main menu, select Report | Add Page Header. A space for the page header layout appears at the top part of the design surface. (If the Report menu is not visible, click anywhere on the design surface.)
4. From the Toolbox, place an image item in the layout area for the page header. The Image Properties dialog box appears.
5. Click the Import button. The Open dialog box appears.
6. Select GIF files (*.gif) from the file type drop-down list just above the Open button.
7. Navigate to the GDS.gif image file, and select it. (This is the same image file you used in Chapter 6.) Click Open.
8. Click OK to exit the Image Properties dialog box. The image is embedded in the report and used by the image report item you placed in the page header.
From this point on, the book will not give specific instructions for setting the values of object properties. You can set the properties in the Properties window or in the properties dialog box specific to that object, whatever you are most comfortable with.
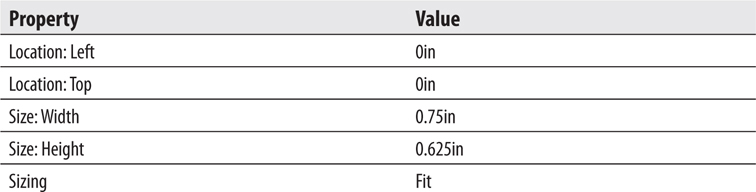
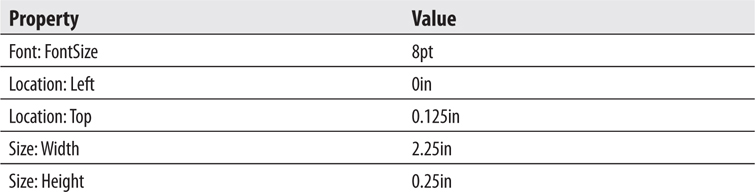
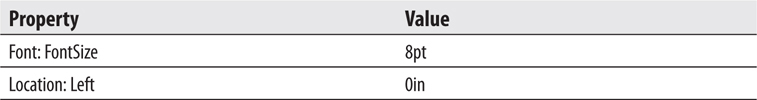
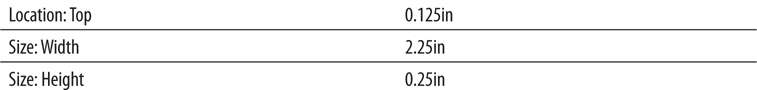
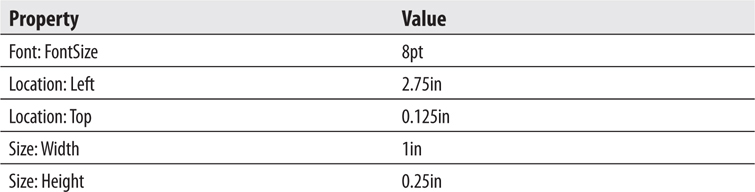
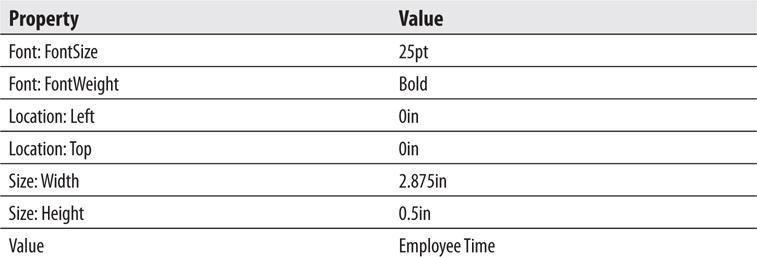
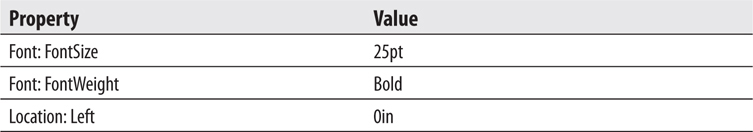
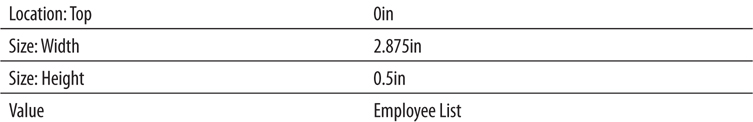
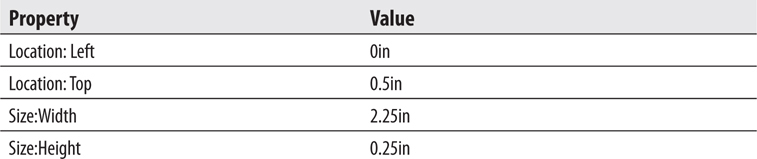
9. Modify the following properties of the image:
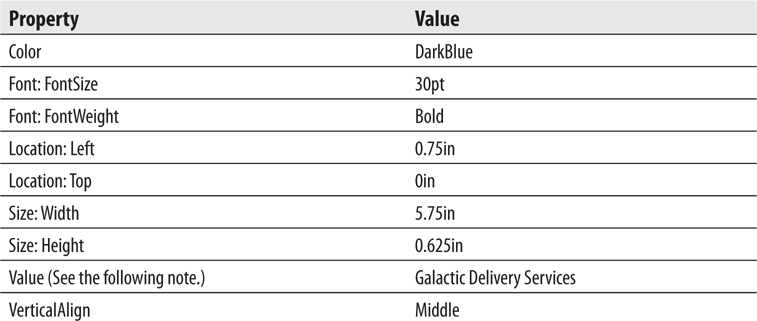
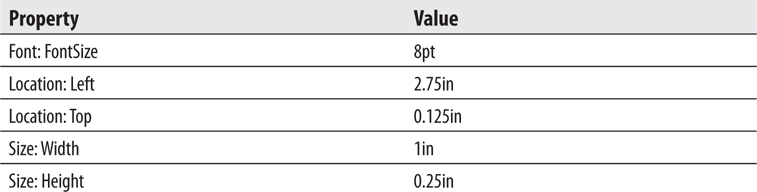
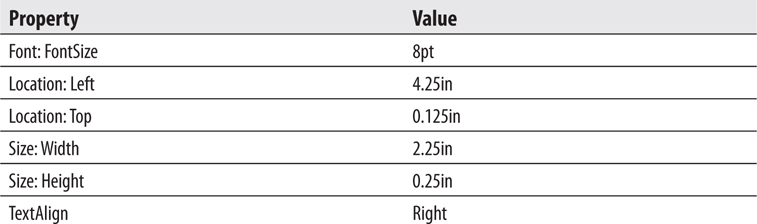
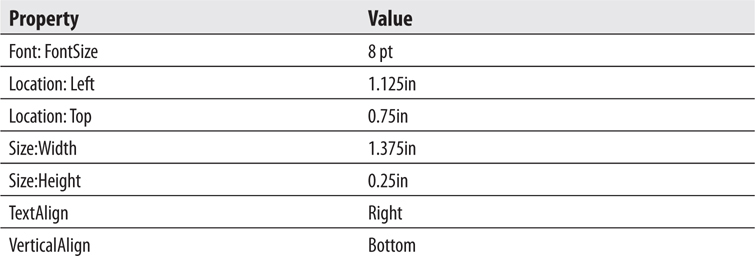
10. Place a text box in the layout area for the page header. Modify the following properties of the text box:
 NOTE
NOTE
The Value property is not found in the Properties window. It can be set by entering the text directly into the text box, using the Text Box Properties dialog box, or using the Expression dialog box.
11. Click in the page header layout area outside the text box and image. Page Header is selected in the drop-down list at the top of the Properties window.
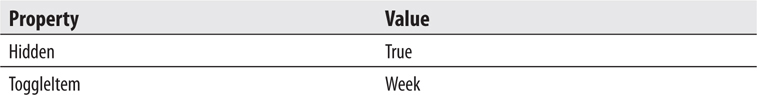
12. Modify the following property for the page header:

 Report Builder Steps
1. Using the web portal, create a new folder in the Galactic Delivery Services folder. Enter Template as the name of this folder. (If you need help with this task, see Chapter 5.)
2. Launch Report Builder from the web portal.
3. With New Report highlighted in the left column, click Blank Report. The Report Builder shows a new blank report.
4. In the Insert tab, select Header | Add Header. A space for the page header layout appears at the top part of the design surface.
5. From the Insert tab, place an image item in the layout area for the page header. The Image Properties dialog box appears.
6. Click the Import button. The Open dialog box appears.
7. Select GIF files (*.gif) from the file type drop-down list just above the Open button.
8. Navigate to the GDS.gif image file, and select it. (This is the same image file you used in Chapter 6.) Click Open.
9. Click OK to exit the Image Properties dialog box. The image is embedded in the report and used by the image report item you placed in the page header.
NOTE
From this point on, the book will not give specific instructions for setting the values of object properties. You can set the properties in the Properties window or in the properties dialog box specific to that object, whatever you are most comfortable with.
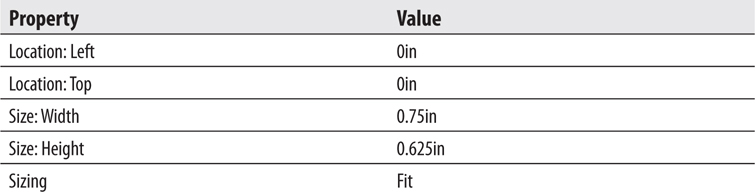
10. Modify the following properties of the image:
11. Place a text box in the layout area for the page header. Modify the following properties of the text box:
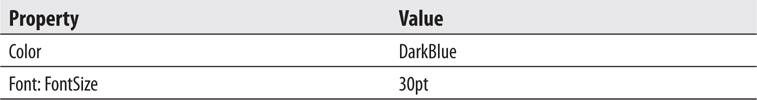

The Value property is not found in the Properties window. It can be set by entering the text directly into the text box, using the Text Box Properties dialog box, or using the Expression dialog box.
12. Click in the page header layout area outside the text box and image. Page Header is selected in the Properties window.
13. Modify the following property for the page header:

Task Notes Reporting Services reports have a page header layout area that can be used to create a page heading for the report. The page header has properties, so it can be turned off on the first page or the last page of the report. Aside from these options, if the page header is turned on in the Report menu, it appears on each report page.
The page header can be populated with images, text boxes, lines, and rectangles. You cannot, however, place any data regions, tables, matrixes, lists, or charts in a page header. You can place a text box that references a field from a dataset in the page header. As with any other field expression placed outside of a data region, the value will not change from page to page.
In the previous task, you made the logo image in the report header an embedded image. This was done for reasons of convenience for these exercises. In an actual template created for your company, retrieving images from an Internet or intranet site is probably a good idea. As discussed previously, this allows for the image to be used in a multitude of reports while being stored in a single location. This also makes it easy to update the image the next time the marketing department gives it a makeover.
SSDT and Visual Studio Steps1. Click anywhere on the design surface.
2. From the main menu, select Report | Add Page Footer. A space for the page footer layout appears below the layout area for the body of the report.
3. In the Report Data window, expand the Built-in Fields entry. Select ReportName and drag it onto the page footer layout area.
4. Modify the following properties of the text box that results:
5. Place a text box in the layout area for the page footer. Modify the following properties of the text box:
Right-click this text box and select Expression from the context menu. The Expression dialog box appears.
6. Type the following in the Set expression for: Value area after the equals (=) sign:

7. A space should be typed both before and after the ampersand character (&).
8. Select Built-in Fields in the Category pane.
9. Double-click PageNumber in the Item pane to append it to the expression. The expression to return PageNumber from the Globals collection is added to the Expression area.
Globals and Built-in Fields are two different names for the same group of items.
10. After the PageNumber expression, type the following:

A space should be typed both before and after each ampersand.
11. Double-click TotalPages in the Item pane. The expression to return TotalPages from the Globals collection is added to the Expression area.
12. Click OK to exit the Expression dialog box.
13. In the Report Data window, select ExecutionTime and drag it onto the page footer layout area.
14. Modify the following properties of the text box that results:

15. Click in the page footer layout area outside of the three text boxes so Page Footer is selected in the Properties window. Modify the following property of the page footer:

Your report layout should appear similar to Figure 8-1.
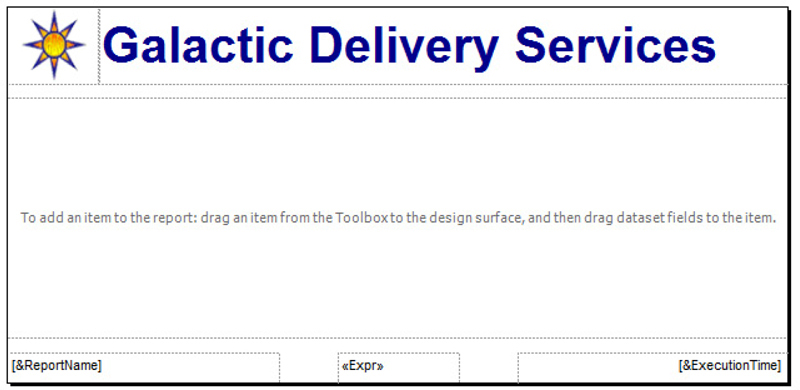
Figure 8-1 The report template layout
16. Click the Preview tab. Your report should appear similar to Figure 8-2.
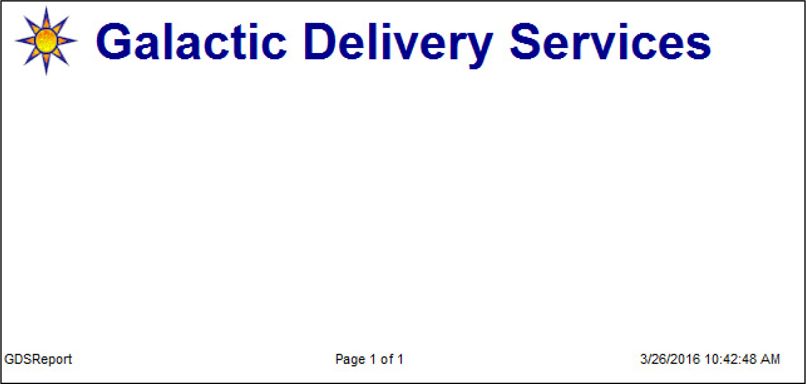
Figure 8-2 The report template on the Preview tab
17. For a better look at what the header and footer will look like on a printed report, click the Print Layout button, as shown in Figure 8-3.
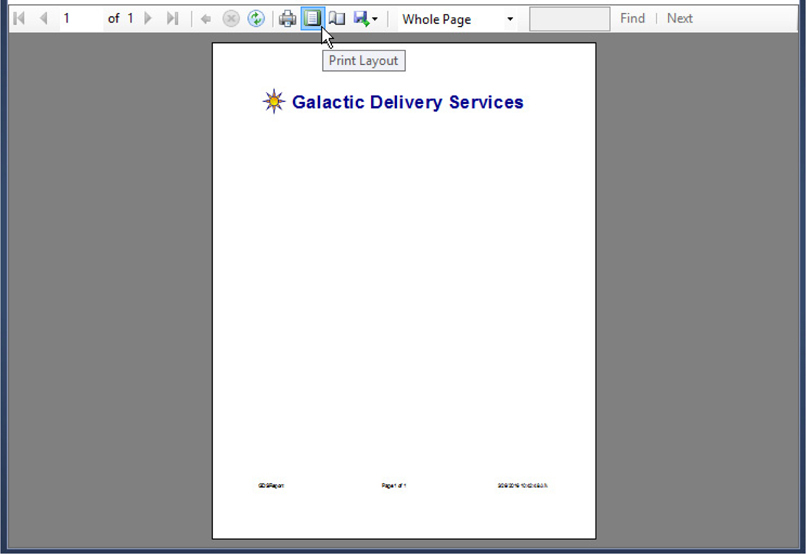
Figure 8-3 The report template in print layout mode
18. Finally, let’s set the margins for the report. Click the Design tab.
19. In the main menu, select Report | Report Properties. The Report Properties dialog box appears.
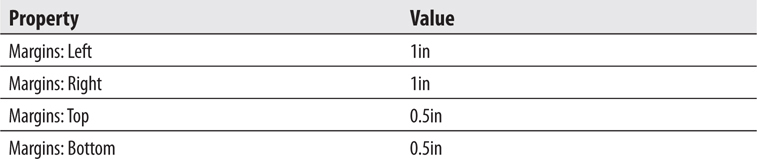
20. Modify the following values:
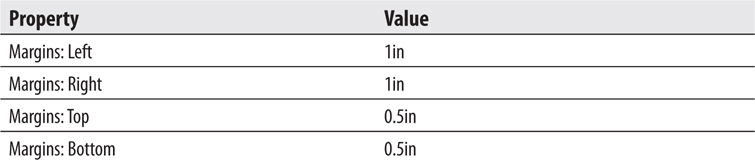
21. Click OK to exit the Report Properties dialog box.
22. Click the Preview tab. The header and footer should appear to be positioned better on the page.
23. Click the Print Layout button to exit the print layout mode.
24. Click Save All on the toolbar.
Report Builder Steps1. Select the Click to add title text box, and delete it.
2. In the Report Data window, expand the Built-in Fields entry. Select Report Name and drag it onto the page footer layout area.
3. Modify the following properties of the text box that results:
4. Place a text box in the layout area for the page footer. Modify the following properties of the text box:
5. Right-click this text box and select Expression from the context menu. The Expression dialog box appears.
6. Type the following in the Set expression for: Value area after the equals (=) sign:

A space should be typed both before and after the ampersand character (&).
7. Select Built-in Fields in the Category pane.
8. Double-click PageNumber in the Item pane to append it to the expression. The expression to return PageNumber from the Globals collection is added to the Expression area.
NOTE
Globals and Built-in Fields are two different names for the same group of items.
9. After the PageNumber expression, type the following:

A space should be typed both before and after each ampersand.
10. Double-click TotalPages in the Item pane. The expression to return TotalPages from the Globals collection is added to the Expression area.
11. Click OK to exit the Expression dialog box.
12. Select the text box containing “[&ExecutionTime]” in the layout area for the page footer.
13. Modify the following properties of this text box:
14. Click in the page footer layout area outside of the three text boxes so Page Footer is selected in the Properties window. Modify the following property of the page footer:

Your report layout should appear similar to Figure 8-1, which is found earlier in the book with the SSDT and Visual Studio steps for this task.
15. Click Save. Save the report as “GDSReport” in the Template folder on the report server.
16. Click Run. Your report should appear similar to Figure 8-2.
17. For a better look at what the header and footer will look like on a printed report, click the Print Layout button, as shown in Figure 8-4.
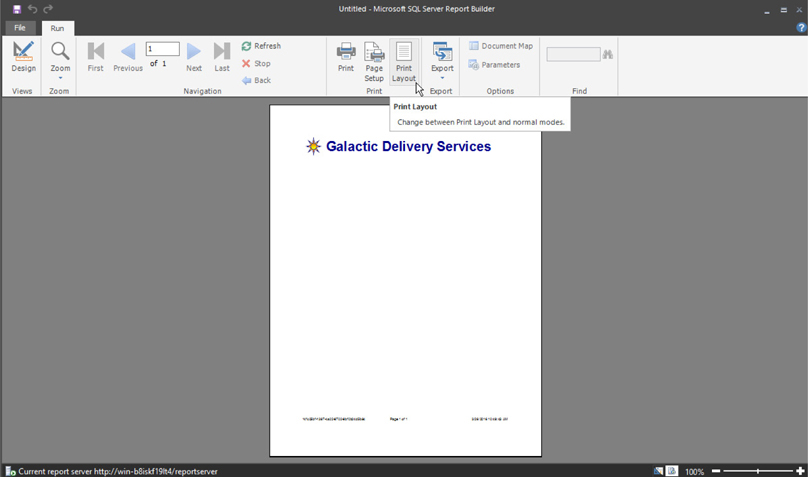
Figure 8-4 The report template in print layout mode in the Report Builder
18. Finally, let’s set the margins for the report. Click Design.
19. Right-click in the gray area immediately outside the report layout area. Select Report Properties from the context menu. The Report Properties dialog box appears.
20. Modify the following values:
21. Click OK to exit the Report Properties dialog box.
22. Click Run. The header and footer should appear to be positioned better on the page.
23. Click the Print Layout button to exit the print layout mode.
24. Click Save.
Task Notes Reporting Services provides a number of global or built-in fields you can use in your reports, including the following:
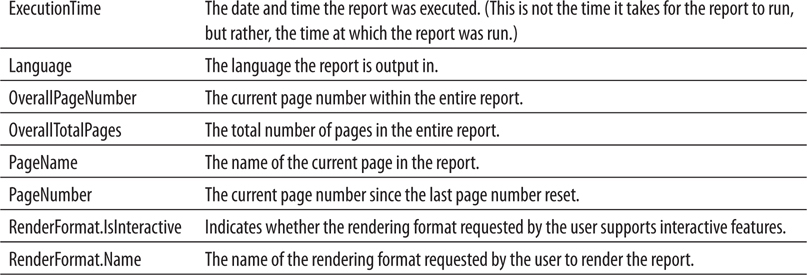
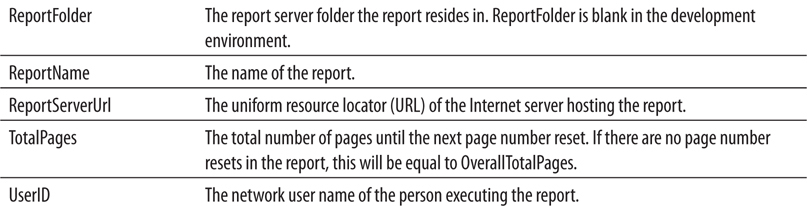
These global fields are commonly used in the page header and page footer areas of the report. It is possible, however, to use most of them anywhere in the report.
The report has its own properties that can be modified. You are most likely to use the Report Properties dialog box to modify the orientation, page size, and the margins. In Chapter 9, however, we explore some of the other properties available in this dialog box.
SSDT and Visual Studio Steps1. Close your report development environment, SSDT, or Visual Studio.
NOTE
It is important you close your development environment and restart it when instructed in order for the following changes to appear in your environment.
2. Open Windows Explorer and navigate to the folder you created for the Template project. From the My Documents folder, the path should be the following:

3. In the Template folder, highlight the file GDSReport.rdl. This is the template report we just created.
4. Press CTRL-C to copy this file.
5. Navigate to the directory where the Report Designer stores its templates. In a default installation on 64-bit Windows, this is

In a 32-bit environment, the path will be: C:\Program Files\Microsoft Visual Studio 14.0\Common7\IDE\PrivateAssemblies\ProjectItems\ReportProject.
6. Open the ReportProject folder.
7. Press CTRL-V to paste the copied file into this directory.
8. Close Windows Explorer.
Task Notes for SSDT and Visual Studio When we add a new item to a report project, the Report Designer looks in the ProjectItems\ReportProject folder. Any report files (.rdl) it finds in this folder are included in the Templates area of the Add New Item dialog box. This is shown in Figure 8-5.
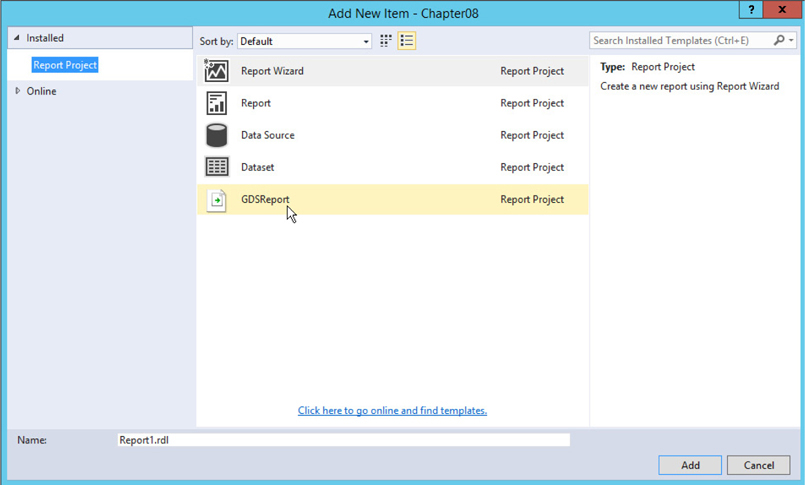
Figure 8-5 The Add New Item dialog box with a custom template
In the remainder of this chapter, we use our new template to create reports.
Report Builder Steps1. In the web portal, click the ellipsis button (…) next to the Template folder as shown in Figure 8-6.

Figure 8-6 The ellipsis button for the Template folder
2. From the pop-up menu for the Template folder, select Manage.
3. The Edit page for the Template folder appears in the browser. Select Security on the left side of the page.
4. Click the Customize security button.
5. The Confirm dialog box appears. Click OK.
6. Click the Edit link next to the first item in the security entry list as shown in Figure 8-7.
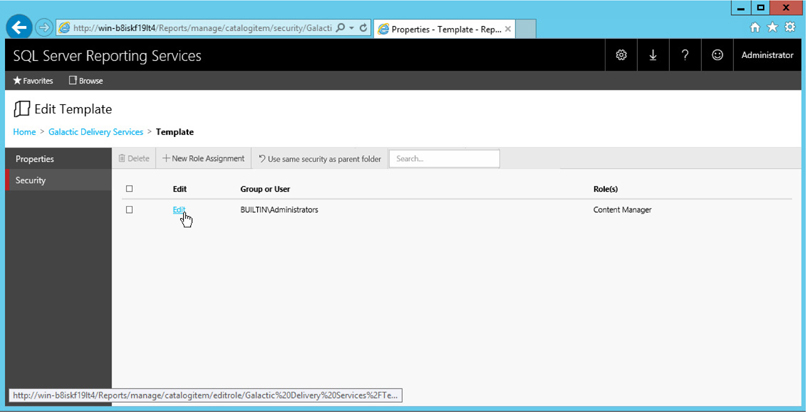
Figure 8-7 The Edit link on the Security page
7. The Edit Role Assignment page appears.
8. Check the Browser role and the Report Builder role on this page. Uncheck any other roles that might be checked.
9. Click Apply. This will return you to the Security page for the Template folder.
10. Repeat Step 6 through Step 9 for all entries on the Security page, if there are any.
11. Click the Galactic Delivery Services link to return to the Galactic Delivery Services folder.
Task Notes for Report Builder Our changes to the Template folder have made it read-only. When we want to create a report using our GDSReport template, we will open this report in Report Builder and then save the modified version under another name. If you forget and try to save a modified version of the template back in the Template folder, you will receive an error similar to that shown in Figure 8-8. This is your cue to use Save As rather than Save in Report Builder.
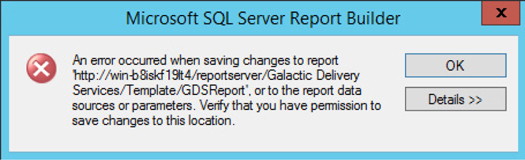
Figure 8-8 The save error appears if you try to save to a read-only folder on the report server.
As you create more complex reports and use more intricate expressions in those reports, you increase the chance of introducing errors. This is one place where SSDT and Visual Studio have a bit of an advantage over Report Builder. All three environments let you know you have an error when you try to preview/run the report. In SSDT and Visual Studio, you receive a message in the Preview tab saying, “An error occurred during local report processing.” In Report Builder, you receive a similar error message in a dialog box.
In addition, SSDT and Visual Studio provide a list of detailed error messages in both the Build section of the Output window and in the Error List window. (You may need to select Error List from the View menu to see the Error List window.) In most cases, these error messages provide a pretty good description of the problem. In many cases, the problem is a syntax error in an expression you constructed in a property of a report item.
If you double-click an error entry in the Error List window in SSDT or Visual Studio, you return to the Design tab (if you are not already there), and the report item that contains the offending expression is selected. You can then use the error message to determine which property contains the error and fix the problem. In some cases, if you open the Properties dialog box for the report item, the property containing the error has an exclamation mark surrounded by a red circle placed next to it.
Once you make changes to remedy each error listed in the Error List window, you can click the Preview tab to run the report. If all the errors have been corrected, the Build section of the Output window shows zero errors, and all the entries are cleared out of the Error List window. If you still have errors, continue the debugging process by double-clicking an Error List window entry and trying again to correct the error.
Using a report template
Putting totals in headers and footers
Using scope to affect aggregate function results
Toggling visibility
Business Need The Galactic Delivery Services personnel department needs a report showing the amount of time entered by its employees on their weekly timesheets. The report should group the time by job, employee, and week, with totals presented for each grouping. The groups should be collapsed initially, and the user should be able to drill down into the desired group. Group totals should be visible even when the group is collapsed.
1. Create a New Report and a New Dataset
2. Populate the Report Layout
3. Add Drilldown Capability
4. Add Totaling
SSDT and Visual Studio Steps1. Restart SSDT or Visual Studio and create a new Reporting Services project called Chapter08 in the MSSQLRS folder. (If you need help with this task, see Chapter 5.)
2. Create a shared data source called Galactic for the Galactic database. (Again, if you need help with this task, see Chapter 5.)
3. Right-click Reports in the Solution Explorer. Select Add | New Item from the context menu. The Add New Item – Chapter08 dialog box appears.
4. Single-click GDSReport in the center area to select it. Change the Name to EmployeeTime and click Add.
5. Create a data source called “Galactic” in this new report. This new data source should reference the Galactic shared data source. (If you need help with this task, see Chapter 5.)
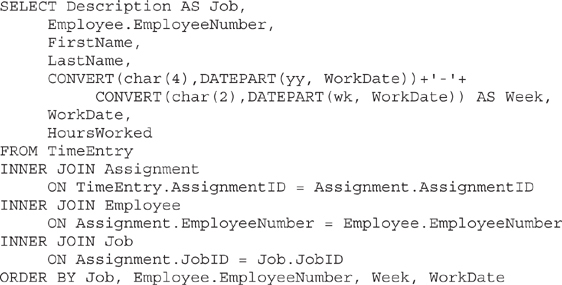
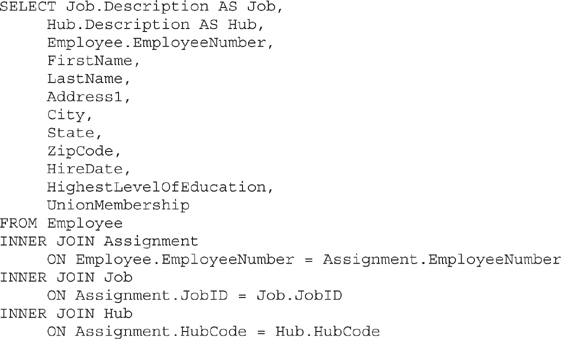
6. Create a dataset called EmployeeTime with the following query:
Report Builder Steps1. Using the web portal, create a new folder in the Galactic Delivery Services folder. Enter Chapter08 as the name of this folder. (If you need help with this task, see Chapter 5.)
2. Launch Report Builder from the web portal.
3. Close the New Report or Dataset dialog box.
4. Click the File tab of the ribbon and select Open from the menu.
5. Navigate to the Template folder.
6. Double-click the GDSReport item to open it.
7. Click the File tab of the ribbon and select Save As from the menu. The Save As Report dialog box appears.
8. Click the Up One Level button as shown in the upper-right corner of Figure 8-9 to navigate from the Template folder to the Galactic Delivery Services folder.
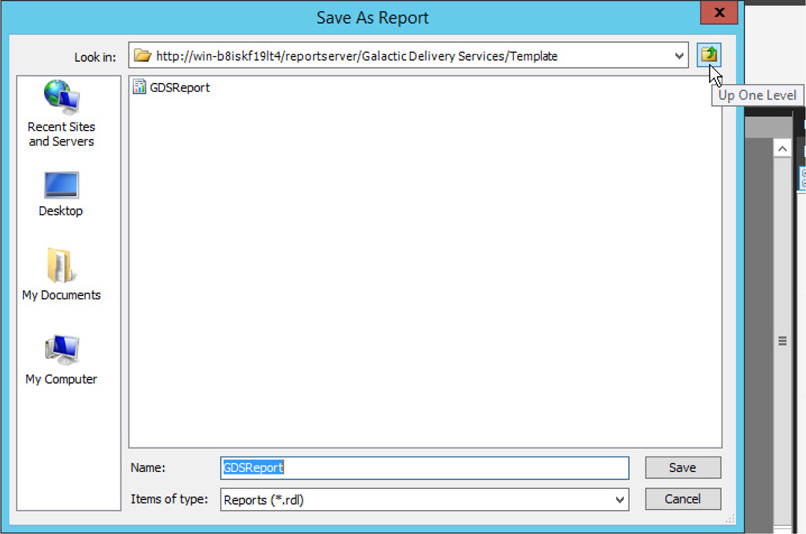
Figure 8-9 The Up One Level button
9. Navigate to the Chapter08 folder.
10. Enter EmployeeTime for Name, and click Save.
11. Create a data source called Galactic in this new report. This new data source should reference the Galactic shared data source. (If you need help with this task, see Chapter 5.)
12. Create a dataset called EmployeeTime with the following query:

Task Notes If you need to, refer to the database diagram for the personnel department in Chapter 3 to see how the TimeEntry, Assignment, Employee, and Job tables are related. Our query joins these four tables to determine what work hours were entered for each employee and what job they held.
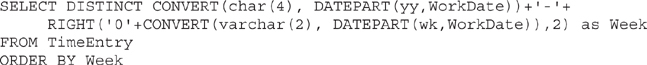
We are using a combination of the CONVERT() and DATEPART() functions to create a string containing the year and the week number for each time entry. This enables us to group the time into work weeks. Note, the year comes first in this string so it sorts correctly across years.
When you created the new report, content was already in the page header and page footer. This, of course, is because we used our new GDSReport template to create the report. By using our report template, we have a consistent header and footer on our reports without having to work at it.
SSDT, Visual Studio, and Report Builder Steps
1. Place a text box onto the body of the report. Modify the following properties of this text box:
2. Use the table template to place a tablix onto the body of the report immediately below the text box you just added. (If you are using Report Builder, do not use the Table Wizard.)
3. In the Report Data window, drag the WorkDate field into the data row in the center column of the tablix.
4. Drag the HoursWorked field into the data row in the right-hand column of the table.
5. Select the entire header row in the tablix. Modify the following property:

6. Right-click anywhere in the lower row of the tablix, and hover over the Add Group item in the Tablix area of the context menu. Select the Parent Group item from the Row Group area of the submenu. The Tablix group dialog box appears.
7. Select [Job] from the Group by drop-down list.
8. Check the Add group header check box and the Add group footer check box.
9. Click OK to exit the Tablix group dialog box.
10. Right-click the cell containing the [WorkDate] field, and select Tablix: Add Group | Row Group: Parent Group from the context menu. The Tablix group dialog box appears.
11. Select [EmployeeNumber] from the Group by drop-down list.
12. Check the Add group header check box and the Add group footer check box.
13. Click OK to exit the Tablix group dialog box.
14. Once more, right-click the cell containing the [WorkDate] field, and select Tablix: Add Group | Row Group: Parent Group from the context menu. The Tablix group dialog box appears.
15. Select [Week] from the Group by drop-down list.
16. Check the Add group header check box and the Add group footer check box.
17. Click OK to exit the Tablix group dialog box. The report layout should appear as shown in Figure 8-10.
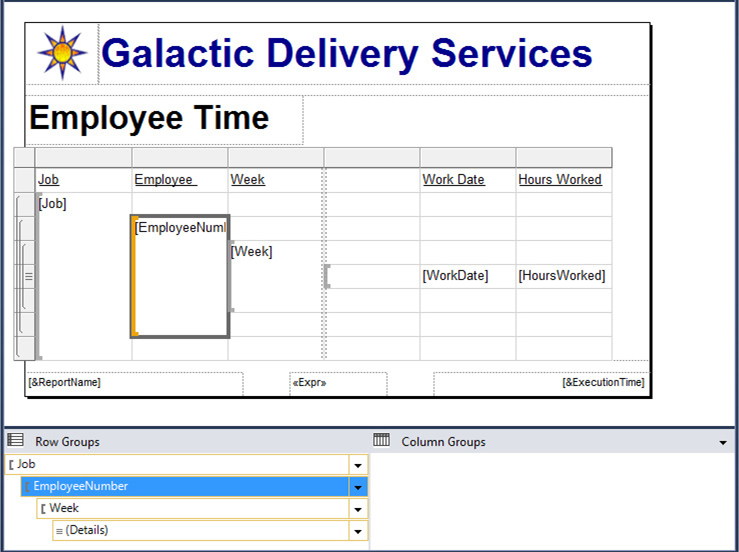
Figure 8-10 Three groups added to the Employee Time report layout
18. In addition to the header and footer rows for each group, we have a header column for each group. These are the columns to the left of the double dashed line. We saw this form of group headings in the TransportList report in Chapter 5. For this report, we are going to try a different format. Click the gray rectangle above the Job column, and hold down the left mouse button. Drag the mouse pointer to the gray rectangle above the Week column, and release the mouse button. All three group columns to the left of the double dashed lines should be selected.
19. Right-click in the gray rectangle above the Week column, and select Delete Columns from the context menu. This deletes the grouping columns, but it does not delete the groups or the group header and footer rows.
20. The symbols in the gray boxes to the left of the tablix identify the three groupings and the detail row. The detail row has the gray box with the three horizontal lines. Immediately above the detail row is the header for the innermost group. Immediately below the detail row is the footer for the innermost group. The innermost group is the Week group. This is surrounded by the header and footer for the middle group, which is the EmployeeNumber group. The middle group is surrounded by the header and footer for the outermost group, which is the Job group. At the very top of the tablix is a tablix header row for column headings (see Figure 8-11). Hover over the leftmost cell in the top group header row. (This is the second row from the top.) Select the Job field from the Field Selector.
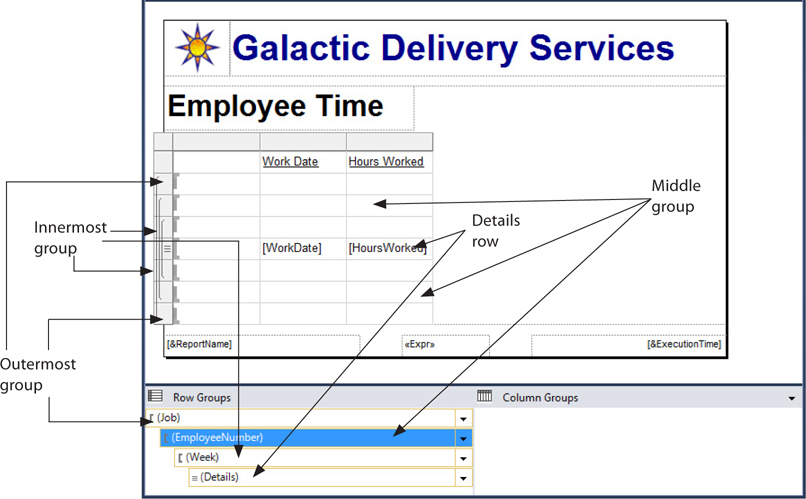
Figure 8-11 The group header and footer rows in the Employee Time report
21. Modify the following property of this cell:

22. Right-click anywhere in the leftmost column in the table. Select Tablix: Insert Column | Right from the context menu.
23. Hover over the cell in the middle group header row in the column you just created. Select the EmployeeNumber field from the Field Selector.
24. Modify the following property of this cell:

25. Drag the width of the leftmost column in the table until the column is just wide enough for the word “Job” in the table header cell.
26. Select the two leftmost cells in the row for the outermost group header, right-click and select Tablix: Merge Cells from the context menu. (Click and drag or hold down SHIFT while clicking to select multiple cells at the same time.)
27. Right-click anywhere in the second-from-the-left column in the table. Select Tablix: Insert Column | Right from the context menu.
28. Hover over the cell in the column you just created in the innermost group header row. Select the Week field from the Field Selector.
29. Modify the following property of this cell:

30. Drag the width of the second column from the left until it is just wide enough for the words “Employee Number” in the tablix header cell.
31. Drag the width of the third column from the left until it is about twice as wide as the word “Week” in the tablix header cell.
32. Drag the width of the fourth column from the left until it is about twice as wide as the words “Work Date” in the tablix header cell.
33. Select the cell containing “[Sum(EmployeeNumber)]” (you may not be able to see all of this expression on the screen). In addition, select the two cells to the right of this cell. Right-click this group of cells and select Tablix: Merge Cells from the context menu.
If you are using SQL Server Data Tools or Visual Studio, the Expression and Text Box Properties items in the context menu may be disabled after you merge cells. To re-activate these context menu items, click elsewhere on the report to unselect the newly merged cell and then try right-clicking the merged cell again.
34. Modify the value of the merged cell that results from Step 33. Select Expression from the drop-down list to make editing easier. (You can select the field expressions from the Fields area and use Append to add them to the Expression area. Remember, the Globals, Parameters, and Fields expressions are case sensitive!) Set the value to the following:

35. Click OK to exit the Expression dialog box. Your report layout should appear similar to Figure 8-12. (Adjust the row heights to match Figure 8-12, if necessary.)
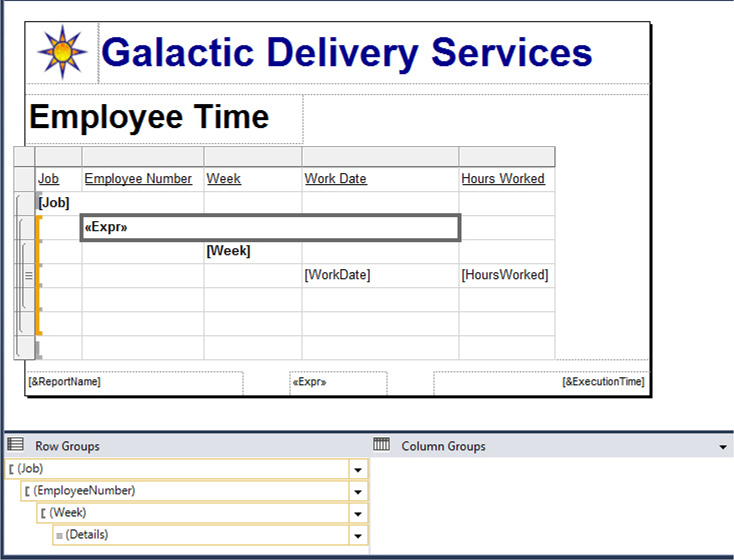
Figure 8-12 Employee Time report layout after Task 2
36. Preview/run the report. Your report should appear similar to Figure 8-13.
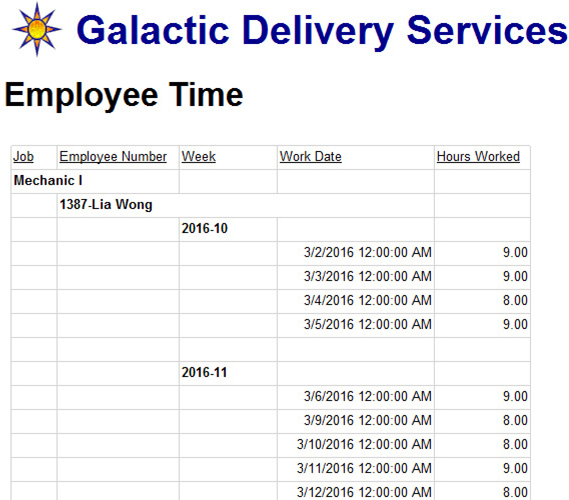
Figure 8-13 Employee Time report preview after Task 2
Task Notes We placed a table on our report to contain the employee time information. We created three groups within the table to contain the groups required by the business needs for this report. The detail information is grouped into weeks. The week groups are grouped into employees. The employee groups are grouped into jobs. By merging cells in the grouping rows, we can give the report a stepped look, the same as we had in the TransportList report in Chapter 5. However, this approach, along with the merged cells, allows each group heading to flow across the top of the information below it. This provides more room for the detail information.
SSDT, Visual Studio, and Report Builder Steps
1. Return to design mode.
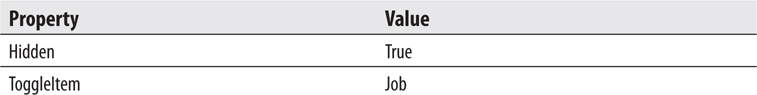
2. Using the drop-down menu for EmployeeNumber group in the Row Groups pane, select Group Properties, as shown in Figure 8-14. The Group Properties dialog box appears.
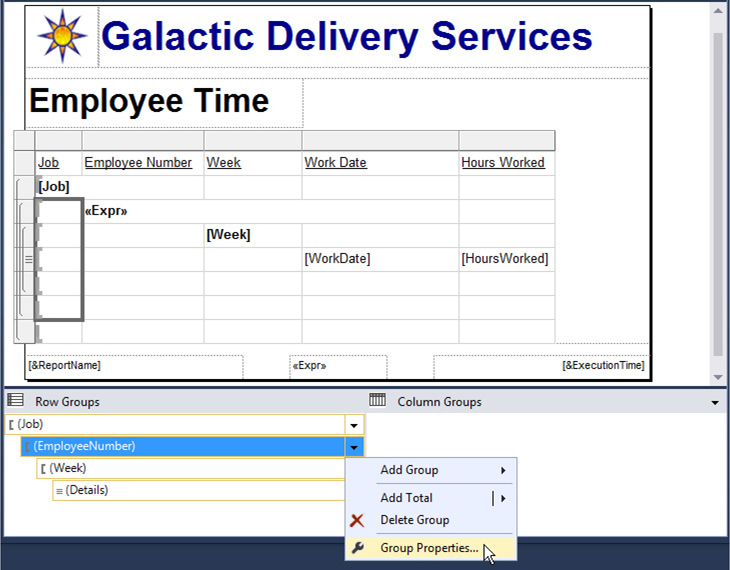
Figure 8-14 Selecting Group Properties from the drop-down menu in the Row Groups pane
3. Select the Visibility page.
4. Select the Hide radio button under the When the report is initially run: prompt.
5. Check the Display can be toggled by this report item check box.
6. Select Job from the drop-down list immediately below this check box.
7. Click OK to exit the Group Properties dialog box.
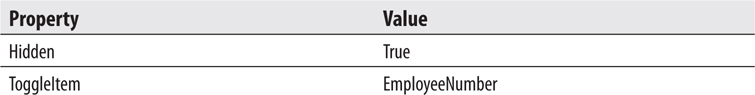
8. Using the drop-down menu for the Week group in the Row Groups pane, select Group Properties. The Group Properties dialog box appears.
9. Select the Visibility page.
10. Select the Hide radio button under the When the report is initially run: prompt.
11. Check the Display can be toggled by this report item check box.
12. Select EmployeeNumber from the drop-down list immediately below this check box.
13. Click OK to exit the Group Properties dialog box.
14. Using the drop-down menu for the Details group in the Row Groups pane, select Group Properties. The Group Properties dialog box appears.
15. Select the Visibility page.
16. Select the Hide radio button under the When the report is initially run: prompt.
17. Check the Display can be toggled by this report item check box.
18. Select Week from the drop-down list immediately below this check box.
19. Click OK to exit the Group Properties dialog box.
20. Preview/run the report. Your report should appear similar to Figure 8-15 after expanding the top few groups.
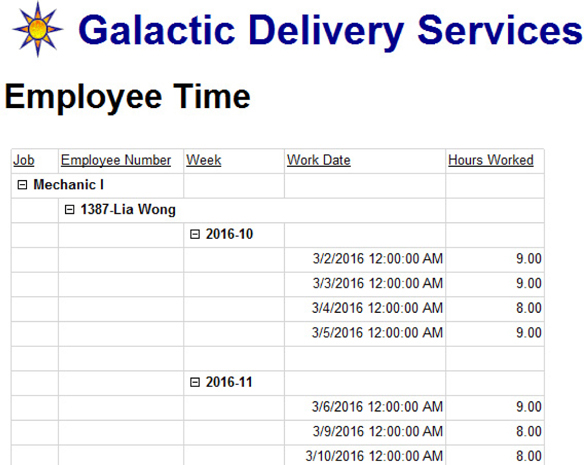
Figure 8-15 Employee Time report preview after Task 3
Task Notes We now have the drilldown capability working as required for this report. This was done using the visibility and toggling properties of the groupings in the tablix. The visibility of each group is set to be toggled by a report item in the group above it. Therefore, the EmployeeNumber group is set to be toggled by the Job report item, and the Week group is set to be toggled by the EmployeeNumber report item. The detail row of the table is treated as a group and is called the Details group. The Details group is set to be toggled by the Week report item.
The Employee Number group, the Week group, and the Details group all have their initial visibility set to Hide. This means when you run the report in the Preview tab, you do not see any of these groups. Only the top group, the Job group, is visible.
Remember, in data regions, the items are repeated according to the rows in the dataset. Therefore, the report contains a number of Job group rows, one for each distinct job contained in the dataset. Each Job group contains sets of EmployeeNumber group rows, Week group rows, and the Details group rows.
The first Job group contains a Job report item (text box) with a value of Mechanic I. There is a small plus (+) sign in front of Mechanic I because it controls the visibility of the EmployeeNumber group rows in the Mechanic I Job group. Clicking the plus sign changes the visibility of all the EmployeeNumber group rows in the Mechanic I Job group from Hide to Show. The EmployeeNumber group rows in the Mechanic I Job group now show up on the report.
When the EmployeeNumber group rows are visible in the Mechanic I Job group, the plus sign next to Mechanic I changes to a minus sign. Clicking the minus (–) sign will again change the visibility of all the EmployeeNumber group rows in the Mechanic I Job group, this time from Show to Hide. The EmployeeNumber group rows in the Mechanic I Job group now disappear from the report.
Click the plus and minus signs to change the visibility of various groups and detail rows in the report. Make sure you have a good understanding of how visibility and toggling are working in the report. We make it a bit more complicated in Task 4.
SSDT, Visual Studio, and Report Builder Steps
1. Return to design mode.
2. Right-click the rightmost cell in the header row for the outermost group (the Job group), and select Textbox: Text Box Properties from the context menu. The Text Box Properties dialog box appears.
3. Type the following for Value:

4. Select the Visibility page of the dialog box.
5. Check the Display can be toggled by this report item check box.
6. Select Job from the drop-down list immediately below this check box. (We are leaving the Show radio button selected.)
7. Click OK to exit the Text Box Properties dialog box.
8. Right-click the rightmost cell in the header row for the middle group (the EmployeeNumber group), and select Textbox: Text Box Properties from the context menu. The Text Box Properties dialog box appears.
9. Type the following for Value:

10. Select the Visibility page of the dialog box.
11. Check the Display can be toggled by this report item check box.
12. Select EmployeeNumber from the drop-down list immediately below this check box. (We are leaving the Show radio button selected.)
13. Click OK to exit the Text Box Properties dialog box.
14. Right-click the rightmost cell in the header row for the innermost group (the Week group), and select Textbox: Text Box Properties from the context menu. The Text Box Properties dialog box appears.
15. Type the following for Value:

16. Select the Visibility page of the dialog box.
17. Check the Display can be toggled by this report item check box.
18. Select Week from the drop-down list immediately below this check box. (We are leaving the Show radio button selected.)
19. Click OK to exit the Text Box Properties dialog box.
20. Click the gray square for the footer row of the outermost group. Modify the following properties for this footer row using the Properties window:
21. Click the gray square for the footer row of the middle group. Modify the following properties for this footer row using the Properties window:
22. Click the gray square for the footer row of the innermost group. Modify the following properties for this footer row using the Properties window:
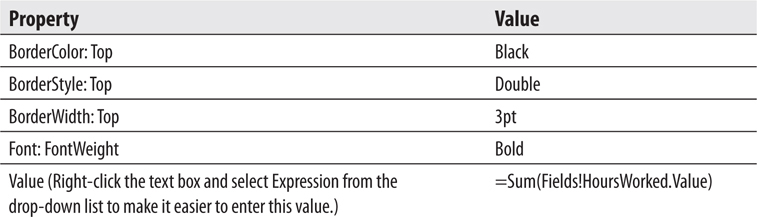
23. Select the rightmost cell in the footer row of the innermost group. Modify the following properties for this text box using the Properties window:

24. Repeat Step 23 for the rightmost cell in the footer row of the middle group.
25. Repeat Step 23 for the rightmost cell in the footer row of the outermost group.
26. Right-click anywhere in the last row of the tablix, and select Tablix: Insert Row | Outside Group – Below from the context menu. A row that will serve as a tablix footer row is added.
27. Select the rightmost cell in this new tablix footer row. Modify the following properties for this text box using the Properties window:
28. Your report layout should appear similar to Figure 8-16.
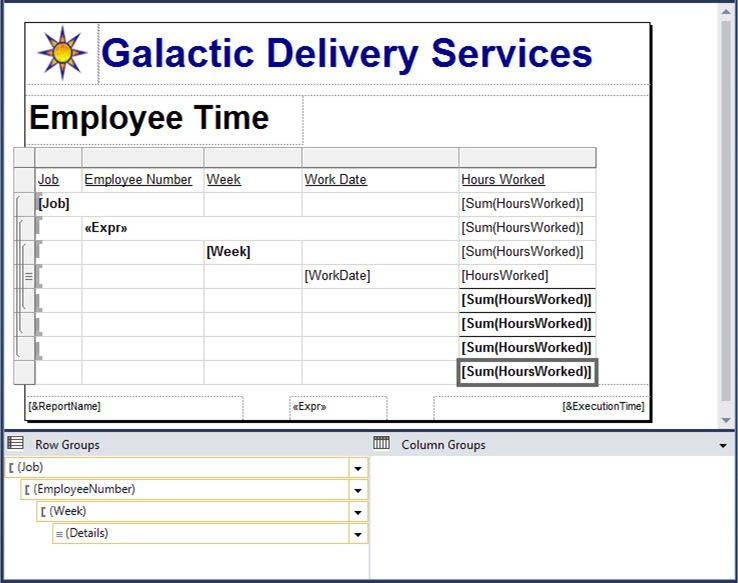
Figure 8-16 The Employee Time report layout after Task 4
29. Preview/run the report. Your report should appear similar to Figure 8-17 when the top few groups are expanded.
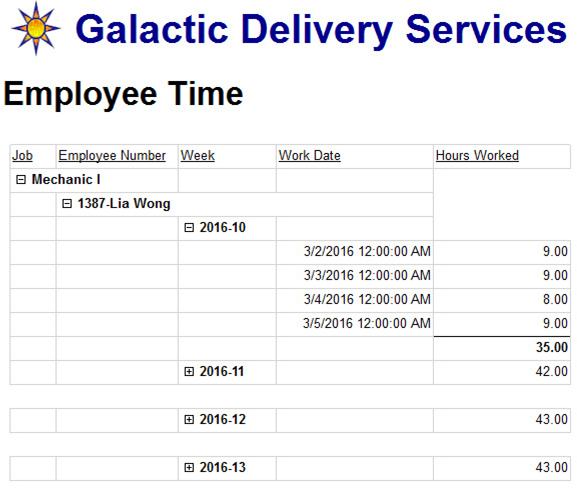
Figure 8-17 The Employee Time report preview after Task 4
30. Save the report.
Task Notes Now we not only have a report with group totals—we have a report that keeps its group totals where they ought to be. When the group is collapsed, the group total is on the same line with the group header. When the group is expanded, the group total moves from the group header to the group footer.
When you think about it, this is how you would expect things to work. When the group is collapsed, we expect it to collapse down to one line. Therefore, the group total should be on the line with the group header. When the group is expanded, we see a column of numbers in the group. We would naturally expect the total for that column of numbers to be below it. Therefore, the group total should move to the group footer.
We achieved this functionality by using our toggle items to control the visibility of three other items at the same time. In the previous section, we discussed the fact that Mechanic I controls the visibility of the EmployeeNumber group rows in the Mechanic I Job group. Now, Mechanic I also controls the visibility of the Hours Worked total in the group header and the Hours Worked total in the group footer. The Hours Worked total in the group header is initially set to Visible. The Hours Worked total in the group footer is initially set to Hidden.
When the plus sign next to Mechanic I is clicked, three things occur:
The EmployeeNumber group rows are set to Visible.
The Hours Worked total in the group header is set to Hidden.
The Hours Worked total in the group footer is set to Visible.
When the minus sign next to Mechanic I is clicked, the reverse takes place. This same behavior occurs at each level. Again, you can click the plus and minus signs to change the visibility of various groups and detail rows in the report. Make sure you understand how the visibility and toggle items interrelate.
The other feature of note used in this task is the Sum( ) aggregate function. If you were paying attention, you noticed we used the following expression in a number of different locations:

If you were paying close attention, you also noticed this expression yields a number of different results. How does this happen? It happens through the magic of scope.
Scope is the data grouping in which the aggregate function is placed. For example, the Sum() function placed in the Job group header row (the outermost header row) uses the current Job group as its scope. It sums hours worked only for those records in the current Job group data grouping. The Sum() function placed in the EmployeeNumber group header row (the middle header row) uses the current EmployeeNumber group as its scope. It sums the hours worked only for those records in the current EmployeeNumber group data grouping. The Sum() function placed in the footer row at the bottom of the tablix is not within any data grouping, so it sums the hours worked in the entire dataset.
As you have seen in this report, it does not make a difference whether the aggregate function is placed in the group header or the group footer—either way, the aggregate function acts on all the values in the current data grouping. At first, this may seem a bit counterintuitive. It is easy to think of the report being processed sequentially, from the top of the page to the bottom. In this scenario, the total for a group would only be available in the group footer after the contents of that group are processed. Fortunately, this is not the way Reporting Services works. The calculation of aggregates is separate from the rendering of the report. Therefore, aggregates can be placed anywhere in the report.
Finally, it is important not to confuse the aggregate functions within Reporting Services with the aggregate functions that exist within the environs of SQL Server. Many of the Reporting Services aggregate functions have the same names as SQL Server aggregate functions. Despite this, Reporting Services aggregate functions and SQL Server aggregate functions work in different locations.
SQL Server aggregate functions work within a SQL Server query. They are executed by SQL Server as the dataset is being created by the database server. SQL Server aggregate functions do not have a concept of scope. They simply act on all the data that satisfies the WHERE clause of the query. As just discussed, Reporting Services aggregate functions are executed after the dataset is created, as the report is executing, and are dependent on scope.
Here is a list of the Reporting Services aggregate functions:
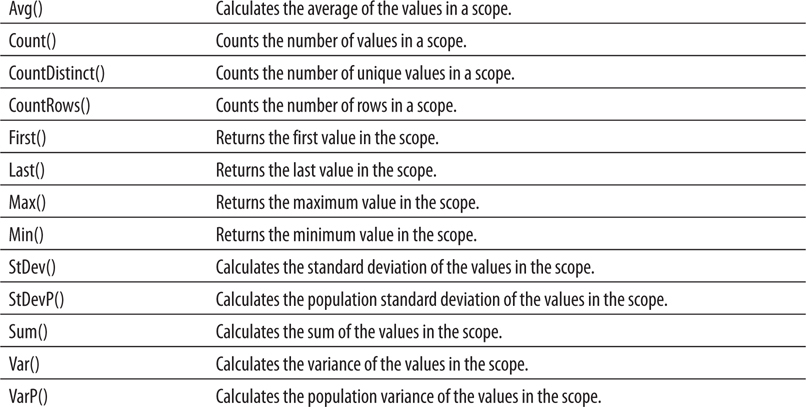
Each of the aggregate functions in the previous table returns a single result for the entire scope. The following two functions are known as running aggregates. The running aggregates return a result for each record in the scope. That result is based on a value in the current row and all of the previous rows in the scope.
The running aggregate functions are as follows:

You switched between layout and preview a number of times during the development of the Employee Time report. If you were to look on your SQL Server, however, you would find the rather complex query that provides the data for this report was only executed once. This is because the data returned for the dataset the first time the report was run is stored in cache. Any time after that, when the same report is run in the authoring environment with the same query, same parameters, and same data access credentials, the cached data is used.
This data caching helps to make your report development sessions more efficient. Even if you have a report based on a query that takes a fair amount of time to run, you only have to wait for it once. Any time you preview/run the report after that, the data is pulled from the cache file with no delay. This caching process also substantially decreases the load on your SQL server. This can be important if you are following the frowned-upon practice of developing reports against a production database server.
The drawback to the data-caching process comes when you are making changes to the data at the same time you are developing a report. If you insert new records or update existing records after the first time you preview the report and then expect to see those changes in your report the next time you preview it, you are going to be confused, disappointed, or perhaps both. The report is rendered from the cached data that does not include the changes.
To remedy this situation, click the Refresh toolbar button, shown in Figure 8-18 in SSDT and Visual Studio, and in Figure 8-19 in Report Builder. This will cause the authoring environment to rerun the queries in the report and create a new cache. SSDT and Visual Studio store this cached data in a file in the same folder as the report definition file that has the same name, with a .data extension on the end. For example, MyReport.rdl has a cache file located in the same folder called MyReport.rdl.data.
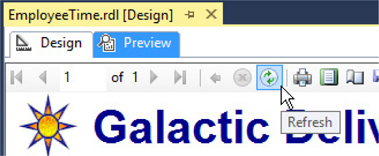
Figure 8-18 The Refresh toolbar button in SSDT and Visual Studio
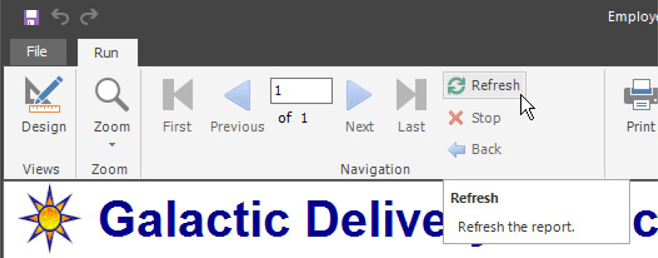
Figure 8-19 The Refresh ribbon button in Report Builder
Remember, this data-caching process is only used by the authoring environment during report development. A different data-caching scheme operates on the report server after the report has been put into production. We discuss that caching scheme in Chapter 12.
Implementing user-selectable grouping
Implementing interactive sorting
Using explicit page breaks
Using a floating header
Business Need The Galactic Delivery Services personnel department wants a flexible report for listing employee information. Rather than having a number of reports for each of their separate grouping and sorting needs, they want a single report where they can choose the grouping and sort order each time the report is run. The report should be able to group on job, hub, or city of residence. The report should be able to sort by employee number, last name, or hire date. Also, each new group should start on a new page. The header information should remain visible even when the user scrolls down the report page.
1. Create a New Report and a Dataset
2. Create the Report Layout
3. Add Interactive Sorting and Fix the Floating Header
SSDT and Visual Studio Steps1. Reopen the Chapter08 project, if it was closed. Close the Employee Time report, if it is still open.
2. Right-click Reports in the Solution Explorer, and select Add | New Item from the context menu. The Add New Item – Chapter08 dialog box appears.
3. Single-click GDSReport in the Templates area to select it. Change the name to EmployeeList, and click Add.
4. Create a data source called Galactic in this new report. This new data source should reference the Galactic shared data source.
5. Create a dataset called Employees with the following query:

Report Builder Steps1. Click the File tab of the ribbon and select Open from the menu. The Open Report dialog box appears.
2. Navigate to the Template folder.
3. Double-click the GDSReport item to open it.
4. Click the File tab of the ribbon and select Save As from the menu. The Save As Report dialog box appears.
5. Navigate to the Chapter08 folder.
6. Enter EmployeeList for Name, and click Save.
7. Create a data source called Galactic in this new report. This new data source should reference the Galactic shared data source.
8. Create a dataset called Employees with the following query:
Task Notes Notice no ORDER BY clause is in our SELECT statement. In most cases, this would cause a problem. Users like to have their information show up in something other than a random sort order. In this case it is fine, because we are sorting the data within the report itself according to what the user selects as report parameters.
SSDT, Visual Studio, and Report Builder Steps
1. Place a text box onto the body of the report. Modify the following properties of this text box:
2. Use the table template to place a tablix onto the body of the report immediately below the text box you just added.
3. Hover over the leftmost field in the data row of the tablix, and select the EmployeeNumber field from the Field Selector.
NOTE
From this point on, the steps will simply instruct you to select a given field in a given cell. You should use the Field Selector to make these selections.
4. Select the FirstName field in the middle cell in the data row of the tablix.
5. Select the LastName field in the rightmost cell in the data row of the tablix.
6. Drag the Address1 field from the Report Data window onto the right edge of the tablix, as shown in Figure 8-20. This will create a new column in the tablix.
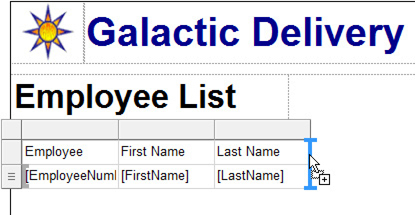
Figure 8-20 Dragging a field to add a new column to a tablix
7. Repeat Step 6 for the City, State, ZipCode, HireDate, HighestLevelOfEducation, and UnionMembership fields. As the tablix grows wider, the report body will also grow wider to accommodate it.
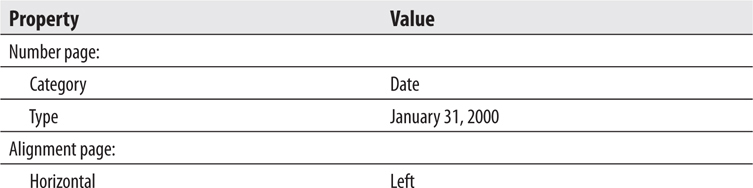
8. Right-click the cell in the detail row containing the HireDate, and select Textbox: Text Box Properties from the context menu. The Text Box Properties dialog box appears.
9. Modify the following properties:
10. Click OK to exit the Text Box Properties dialog box.
11. Size each column and row appropriately. Size the columns so the data is not wrapping in the text boxes. (Column headings may wrap to two lines.) Size the rows so the text is centered vertically within the row. Preview/run the report to check your work. Continue switching between design and preview/run until you have the table columns sized correctly.
12. Click the gray square for the table header row to select the entire row. Modify the following property:

13. In the Report Data window, right-click the Parameters entry, and select Add Parameter from the context menu. The Report Parameter Properties dialog box appears.
14. Type GroupOrder for Name and Group By for Prompt.
15. Select the Available Values page.
16. Select the Specify values radio button.
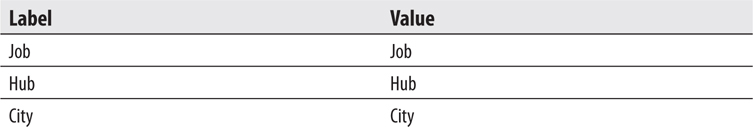
17. Add the following items to the list. (Click Add to create each new entry.)
18. Select the Default Values page.
19. Select the Specify values radio button.
20. Add the following item to the list. (Click Add to create a new entry.)
21. Click OK to exit the Report Parameter Properties dialog box.
22. Right-click anywhere in the detail row of the tablix, and select Tablix: Add Group | Row Group: Parent Group. The Tablix group dialog box appears.
23. Click the fx button. The Expression dialog box appears.
24. Type the following in the Set expression for: GroupExpression area:

NOTE
Use the Parameters and Fields entries in the Expression dialog box to help build expressions such as the previous one. Double-click the desired parameter or field to add it to the expression you are building.
25. Highlight the entire expression you just entered, and press CTRL-C to copy this text.
26. Click OK to exit the Expression dialog box.
27. Check the Add group header check box.
28. Click OK to exit the Tablix group dialog box.
29. In the Row Groups pane, use the drop-down menu for Group1 to select Group Properties. The Group Properties dialog box appears.
30. Select the Page Breaks page.
31. Check the Between each instance of a group check box.
32. Select the Sorting page.
33. Click the fx button. The Expression dialog box appears. Note the tablix is automatically set to sort by our grouping expression.
34. Click OK to exit the Expression dialog box.
35. Leave the Order set to “A to Z.” Click OK to exit the Group Properties dialog box.
36. In the Row Groups pane, use the drop-down menu for Details to select Group Properties. The Group Properties dialog box appears.
37. Select the Sorting page.
38. Click Add to create a new sorting entry.
39. Select [EmployeeNumber] from the Sort by drop-down list.
40. Leave the Order set to “A to Z.” Click OK to exit the Group Properties dialog box.
41. Right-click the gray rectangle above the leftmost column and select Delete Columns from the context menu. The column is removed.
42. In the Grouping area at the bottom of the screen, click the drop-down arrow to the right of the Column Groups header as shown in Figure 8-21. Select Advanced Mode from the drop-down menu.
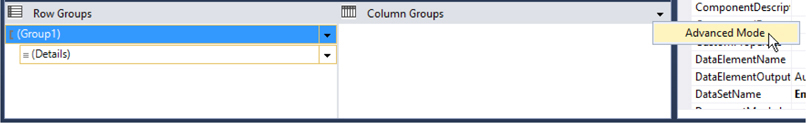
Figure 8-21 The Advanced Mode menu
43. Select the “(Static)” entry at the top of the Row Groups pane as shown in Figure 8-22. The leftmost text box in the first row is selected, indicating this static row group is linked to the first row in the tablix.
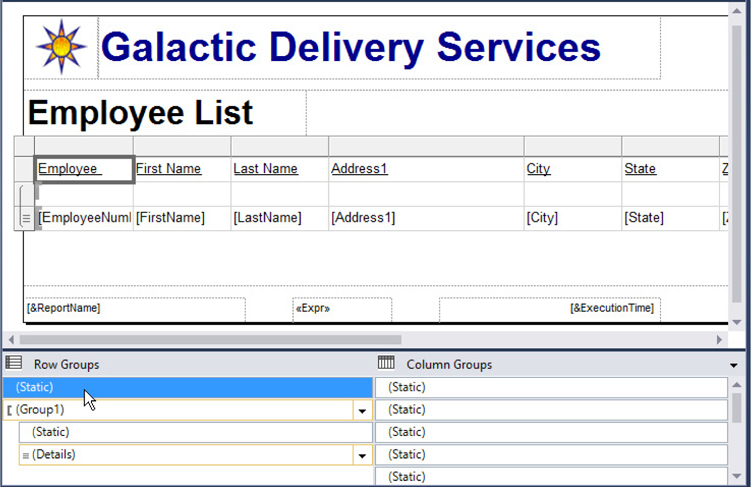
Figure 8-22 Selecting a static group
44. Modify the following properties of this static group in the Properties window:
NOTE
The Properties window simply says “Tablix Member” when you are editing the properties of a static group.
45. Select the three empty cells in the group header row under EmployeeNumber (only the “Employee” portion may be visible), FirstName, and LastName. Right-click these cells, and select Tablix: Merge Cells from the context menu.
46. Right-click these cells again, and select Textbox: Expression from the context menu. The Expression dialog box appears.
47. Delete the equals sign from the Set expression for: Value area, and press CTRL-V to paste the expression into the Expression area. This should be the same expression you entered in Step 24.
48. Click OK to exit the Expression dialog box.
49. Modify the following property of the merged cells:

50. Drag the right edge of the report body layout area until it is just touching the right side of the tablix. Your report layout should appear similar to Figure 8-23.
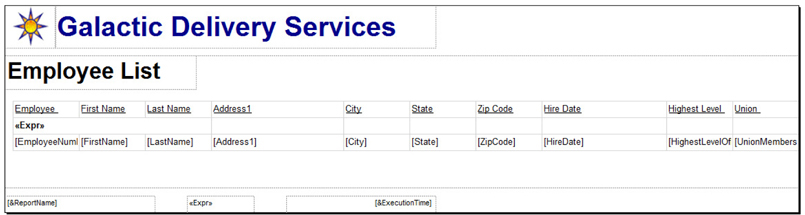
Figure 8-23 The Employee List report layout after Task 2
51. Preview/run the report. Your report should appear similar to Figure 8-24.
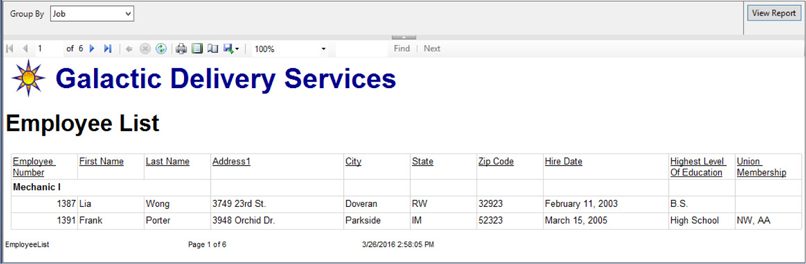
Figure 8-24 The Employee List report preview after Task 2
52. Click the Next button to move to page 2 of the report. Notice the column headings in the tablix header are repeated on this page even though this is not the beginning of the tablix.
53. Click the Next button until you are on page 5 of the report. Scroll down the page. Notice the column headings stay visible rather than scrolling off the page. You will also notice the column headings have a transparent background, which isn’t working too well. We will fix that in the next task.
54. Experiment with changing the grouping. Remember to click View Report each time to refresh the report. Page through the report to view the pagination. When you are done, save the report.
Task Notes In this report, the report parameter is used to control properties within the report rather than as a parameter to a SQL query. Because of this, we needed to create this report parameter manually rather than having it created automatically from the dataset query. We also manually constructed a list of valid values and provided a default value. We were then able to use the value selected for this parameter to change the grouping and the group sorting of the tablix in the report.
We are able to change the grouping and group sorting of the tablix because of the IIF() function. This function has three parameters. The first parameter is a Boolean expression (in other words, an expression that results in either a true or false value). The second parameter is the value returned if the Boolean expression is true. The third parameter is the value returned if the Boolean expression is false.
Let’s take a look at our expressions using the IIF() function:

This expression uses two IIF() functions, one nested inside the other. The first parameter of the outer IIF() function is

If Job is selected for the grouping, the value of the second parameter is returned by the function. In this case, the second parameter is

Therefore, if Job is selected for the grouping, the value of the Job field is used.
If Job is not selected for the grouping, the value of the third parameter is returned. The value of this third parameter is another complete IIF() function:

In this second IIF() function, if Hub is selected for the grouping, the second parameter of this IIF() function is returned. Here, the second parameter is

Therefore, if Hub is selected for the grouping, the value of the Hub field is used.
Finally, if Hub is not selected for the grouping, the value of the third parameter of this IIF() function is returned. Here, the third parameter is

Therefore, if Hub is not selected for the grouping, the value of the City field is used.
We used the same expression for both the grouping and the group sorting. The group-sorting property sorts the groups themselves so they come out in the proper order. We also set the sorting for the Details group. This provided a default sort order for the rows within each group. In other words, it provided a sorting at the detail level.
In many cases, a report needs to start each new group on a new page. We used the Between each instance of a group page break option in the Tablix Group Properties dialog box to force the report to start a new page between each grouping. Additional page break options can be set to force a page break before the first grouping or after the last grouping. Page breaks can also be set for other report items. For instance, you can force a page break before the beginning of a tablix or after the end of a tablix.
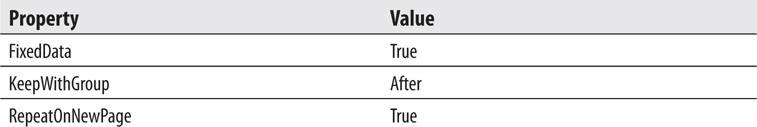
We used the Advanced Mode in the Groups area to control the properties of a special “Static” group within the tablix. This static group represented the table header row, which contained the column headers. The FixedData property keeps the content of this static group visible as we scroll down a page. The RepeatOnNewPage property keeps the content of this static group visible as we go from page to page.
The KeepWithGroup property is key to making the RepeatOnNewPage property function. We need to specify which group this static group is repeated with: the group coming before the static group or the group coming after the static group. If the KeepWithGroup property is set to None, the RepeatOnNewPage property does absolutely nothing.
The floating header does, indeed, seem to float over the columns of the report as you scroll down the page. For this reason, the background of a floating header row should be set to something other than transparent. If this is not done, the column data shows right through the header, making it rather difficult to read. Let’s fix this right away in Task 3.
SSDT, Visual Studio, and Report Builder Steps
1. Return to design mode.
2. Click anywhere on the tablix. Click the gray square for the tablix header row. (The row containing the column headings.) Modify the following property:

3. Right-click the Employee Number text box in the tablix header row, and select Text Box Properties from the context menu. The Text Box Properties dialog box appears.
4. Select the Interactive Sorting page.
5. Check the Enable interactive sorting on this text box check box.
6. Make sure the Detail rows radio button is selected.
7. Select [EmployeeNumber] from the Sort by drop-down list.
8. Click OK to exit the Text Box Properties dialog box.
9. Right-click the Last Name text box in the tablix header row, and select Text Box Properties from the context menu. The Text Box Properties dialog box appears.
10. Select the Interactive Sorting page.
11. Check the Enable interactive sorting on this text box check box.
12. Make sure the Detail rows radio button is selected.
13. Click the Expression button (the button with fx on it) next to the Sort by drop-down list. The Expression dialog box appears.
14. Type the following in the Set expression for: SortExpression area:

15. Click OK to exit the Expression dialog box.
16. Click OK to exit the Text Box Properties dialog box.
17. Right-click the Hire Date text box in the tablix header row, and select Text Box Properties from the context menu. The Text Box Properties dialog box appears.
18. Select the Interactive Sorting page.
19. Check the Enable interactive sorting on this text box check box.
20. Make sure the Detail rows radio button is selected.
21. Select [HireDate] from the Sort by drop-down list.
22. Click OK to exit the Text Box Properties dialog box.
24. Click the Interactive Sort button next to the Last Name column, as shown in Figure 8-25.
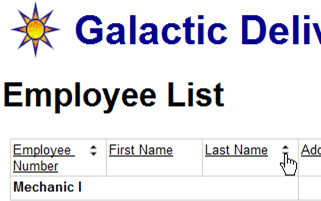
Figure 8-25 The Employee List report with interactive sorting
25. Page through the report and note that within each group the rows are now sorted by last name in ascending order.
26. Click the Interactive Sort button next to the Last Name column again. You return to the first page of the report. Again, page through the report and note that the rows are now sorted by last name in descending order.
27. Click the Interactive Sort button next to the Hire Date column heading. You return to the first page of the report.
28. Page through the report once more. The rows are now sorted by hire date in ascending order.
29. Go to page 5 of the report.
30. Scroll up and down through the page, and notice the table headers always remain visible at the top of the page without the transparency problem we saw earlier.
31. Save the report.
Task Notes The interactive sort feature enables the user viewing the report to choose the sort order he or she would like to see. This could also be done using a report parameter passed as part of the query that creates the dataset. This scheme requires the query to be rerun every time the sort order is changed. Interactive sorting, on the other hand, redisplays the report in the newly selected sort order without rerunning the dataset query. The sorting is all done within the report renderer, using the data already collected from the data source.
The Interactive Sorting page of the Text Box Properties dialog box, shown in Figure 8-26, gives us a number of options for the interactive sort. In our report, we chose to have the interactive sort work on the detail rows of the tablix. This option changes the order of the detail records within each of the groups in the tablix. There is also a radio button that enables the sorting of groups themselves within the tablix. In addition, there is an option to enable the sorting of other groups and data regions based on this interactive sort selection.
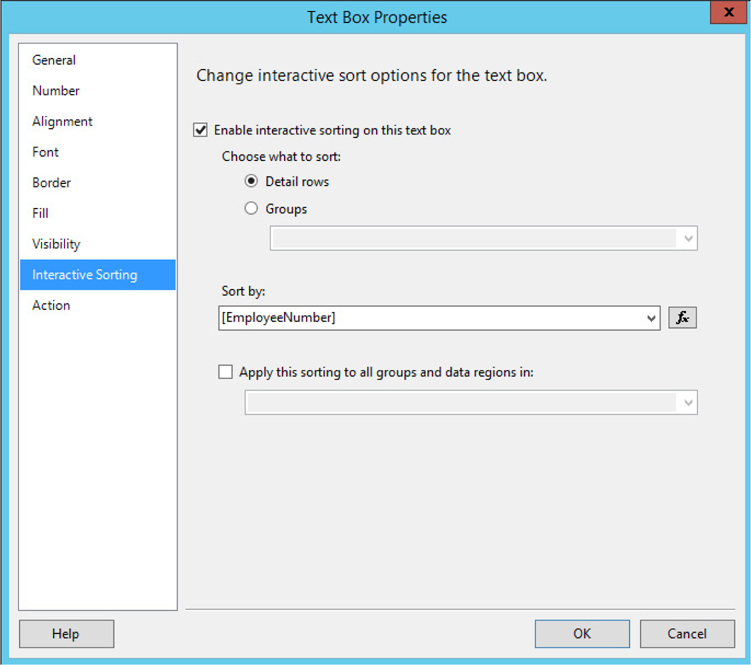
Figure 8-26 The Interactive Sorting page of the Text Box Properties dialog box
Enable multiple columns
Put information from the database into the report header
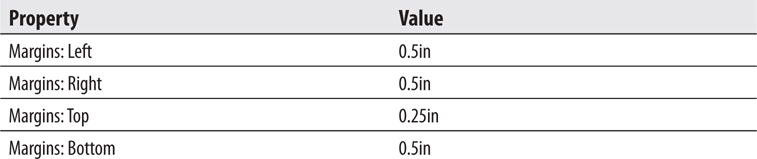
Business Need The Galactic Delivery Services personnel department has a new version of the employee manual. The personnel department needs mailing labels to send the new manual out to each employee. The mailing labels are to be printed on a 2½-inches-wide by 1-inch-high label. The label sheet has three labels across the sheet and ten labels down the sheet, with no margin between each label.
The labels should be sorted by ZIP code and then last name. It would also be helpful if the total number of labels is printed in the top margin of the first page printed. Finally, a sequence number should be printed in the lower-right corner of each label.
1. Create the Mailing Label Content
2. Add the Report Header and Multiple Columns
SSDT, Visual Studio, and Report Builder Steps
1. Create a new blank report called EmployeeMailingLabels. Do NOT create this report from the GDSReport template.
2. If you are using Report Builder, delete the Click to add title text box and remove the page footer.
3. Create a data source called Galactic in this new report. This new data source should reference the Galactic shared data source.
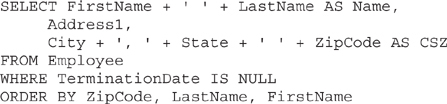
4. Create a dataset called Employees with the following query:
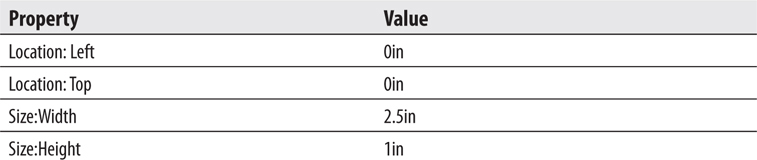
5. Use the List template to place a tablix onto the body of the report. Modify the following properties of the tablix:
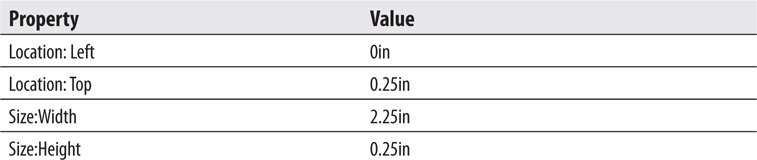
6. In the Report Data window, select the Name field and drag it onto the tablix. Select the resulting text box, and set the following properties:

7. Drag the Address1 field onto the tablix, and set the following properties of the resulting text box:
8. Drag the CSZ field onto the tablix, and set the following properties of the resulting text box:
9. Place a text box onto the list, and set the following properties of the text box:
10. Right-click the text box you just added, and select Expression from the context menu. The Expression dialog box appears.
11. Expand the Common Functions item in the Category pane, and select Miscellaneous. The Item list in the center contains the miscellaneous functions available in Reporting Services.
12. Double-click RowNumber in the Item list to add the RowNumber aggregate to the expression.
13. To complete the expression, type “Tablix1”) after the (.
14. Click OK to exit the Expression dialog box.
15. Adjust the size of the tablix if it grew during the creation of the layout.

16. Adjust the report body so it is exactly the same size as the tablix report item.
17. Preview/run the report. Your report should appear similar to Figure 8-27.
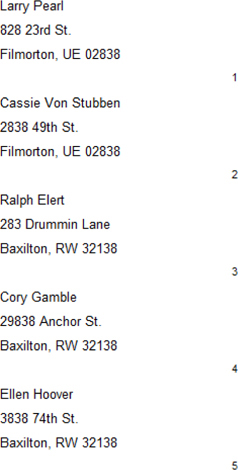
Figure 8-27 The Employee Mailing Labels report preview after Task 1
18. Save the report.
Task Notes The Expression dialog box provides assistance in building expressions. Earlier, we talked about the syntax checking done as you type an expression and the jagged red line that indicates an error. The Expression dialog box enables you to add global variables, parameters, fields, and even common functions to an expression with a double-click.
The business requirements call for a sequence number on each label. To do this, we look to the functions available in Reporting Services. The RowNumber function provides just what is needed.
In the next section, you finalize the formatting of the mailing labels. One of the business requirements was for the count of the number of employees at the top of the first page of labels. The employee count can be determined from the Employees dataset, so we have the information we need. The only place we can put this employee count without messing up the label layout is in the page header.
SSDT, Visual Studio, and Report Builder Steps
1. Return to design mode.
2. If you are using SSDT or Visual Studio, select Report | Add Page Header from the main menu. If you are using Report Builder, select Header | Add Header on the Insert tab of the ribbon.
3. Drag the Name field from the Report Data window, and drop it in the page header layout area.
4. Position the text box created in Step 3 in the upper-left corner of the page header. Make the text box as wide as the Name, Address1, and CSZ fields in the report body. A blue alignment line will appear when these text boxes are the same width.
5. Drag the page header so it is only as tall as the text box you just created. This is done by clicking the dotted line between the page header and the report body and dragging upward.
6. Right-click the text box in the page header, and select Expression from the context menu. The Expression dialog box appears.
NOTE
The Name field was placed on the report layout outside of a data region. Therefore, the field was placed inside an aggregate function to get a single value. By default, a numeric field is placed inside a Sum() aggregate and a non-numeric field is placed inside a First() aggregate.
7. Replace the word “First” with Count to get a count of the number of records in the dataset.
8. Modify the expression so it appears as follows:

9. Click OK to exit the Expression dialog box.
10. Right-click the text box in the page header, and select Text Box Properties from the context menu. The Text Box Properties dialog box appears.
11. Select the Visibility page.
12. Select the Show or hide based on an expression radio button under the When the report is initially run prompt.
13. Click the fx button below and to the right of the radio button you just selected. The Expression dialog box appears.
14. Expand Common Functions in the Category pane, and select Program Flow in the list on the left.
15. Double-click IIf in the Item pane.
16. Select Built-in Fields in the Category pane.
17. Double-click PageNumber in the Item pane.
18. Type > 1, true, false) at the end of the expression.
19. Click OK to exit the Expression dialog box.
20. Click OK to exit the Text Box Properties dialog box.
21. Click in the design window someplace outside of the report body. In the Properties window, Report will be selected at the top of the window.
22. Modify the following properties of the report:
23. Right-click anywhere in the design window outside of the report body, and select Report Properties from the context menu. The Report Properties dialog box appears.
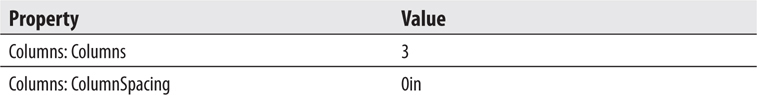
24. Modify the following properties:
25. Click OK to exit the Report Properties dialog box. Your report layout should appear similar to Figure 8-28.
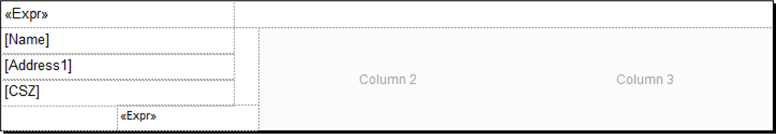
Figure 8-28 The Employee Mailing Labels report layout after Task 2
26. Preview/run the report. Click the Print Layout toolbar button. The report appears similar to Figure 8-29 when using the Page Width zoom setting.
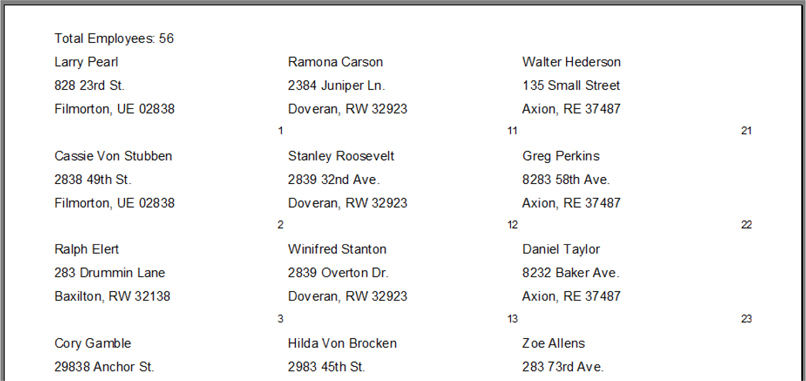
Figure 8-29 The Employee Mailing Labels report print layout preview after Task 2
27. Click the Print Layout toolbar button to exit print layout mode.
28. Save the report.
Task Notes The business requirements specify that the employee count should only be displayed on the first page. The page header has properties that hide it on the first page or the last page. There is no option to have it display only on the first page. To accomplish this, you created an expression to control the visibility of the text box in the page header. If the page number is less than or equal to 1, the employee count is visible. If the page number is greater than 1, the employee count is hidden.
In addition, you need to set up the report layout to match the label sheet. This is done using properties of the report itself. The Columns property, of course, specifies the number of columns in the report. The Spacing property specifies the amount of space in between each column. These must be set using the Properties window. In addition, the margins need to be set appropriately. The margin properties can be set through the Properties window or with the Report Properties dialog box.
Because the labels are three across with 2½ inches per label and no spacing between labels, the labels take up 7½ inches. Therefore, the left and right margins must be set to ½ inch each to get a total of 8½ inches in width. A similar set of calculations tells us that the top and bottom margins must also be ½ inch each, but ¼ inch must be subtracted from the top margin to accommodate the page header.
Implementing cascading parameters
Using SQL stored procedures
Using table filters
Using the NoRows property
Business Need The Galactic Delivery Services personnel department needs to monitor the amount of overtime put in at each of its repair and distribution hubs to determine when additional personnel must be hired. The personnel department needs a report that lists the employees with more than 45 hours worked in a given week at a given hub. The report should have two sections. The first section should list employees with more than 45 hours and fewer than 55 hours worked for the selected week. The second section should list employees with more than 55 hours worked for the selected week.
The user should be able to select a work week from a drop-down list and then see a second drop-down list, showing the hubs that have one or more employees with more than 45 hours for the selected week. The user selects a hub from this second list and then sees the report for that hub.
Two stored procedures in the Galactic database should be used for retrieving data. The stp_HubsOver45 stored procedure returns a list of hubs with one or more employees who have more than 45 hours worked for the selected week. The stp_EmployeesOver45 stored procedure returns a list of employees who have more than 45 hours worked for the selected week at the selected hub. We discuss stored procedures in the Task Notes.
1. Create a New Report and Three Datasets
2. Create the Report Layout
3. Add Data Bars to the Report
SSDT, Visual Studio, and Report Builder Steps
1. Create a new report from the GDSReport template. Name the new report Overtime in the Chapter08 folder.
2. Create a data source called Galactic in this new report. This new data source should reference the Galactic shared data source.
3. Create a dataset called Weeks with the following query:
4. Right-click the Galactic entry in the Report Data window. Select Add Dataset from the context menu. The Dataset Properties dialog box appears.
5. Enter HubsOver45 for the name in the Dataset Properties dialog box.
6. Select the Stored Procedure radio button under the Query type prompt.
7. Select stp_HubsOver45 from the Select or enter stored procedure name drop-down list.
8. Click OK to exit the Dataset Properties dialog box. An entry for the HubsOver45 dataset appears in the Report Data window.
9. Right-click the Galactic entry in the Report Data window. Select Add Dataset from the context menu. The Dataset Properties dialog box appears.
10. Enter EmployeesOver45 for the name in the Dataset Properties dialog box.
11. Select the Stored Procedure radio button under the Query type prompt.
12. Select stp_EmployeesOver45 from the Select or enter stored procedure name drop-down list.
13. Click OK to exit the Dataset Properties dialog box. An entry for the EmployeesOver45 dataset appears in the Report Data window.
Task Notes For two of our three datasets, we used stored procedures rather than queries. A stored procedure is a query or a set of queries given a name and stored in the database itself. You can think of a stored procedure as a data manipulation program created and kept right inside the database.
Stored procedures have several advantages over queries:
Speed A certain amount of preprocessing must be done on any query before it can be run in the database. This preprocessing creates an execution plan. Essentially, SQL Server selects the approach it will use to actually execute the query. Stored procedures are preprocessed when they are created, and the resulting query plan is saved with the stored procedure. This means when you execute a stored procedure, you do not need to wait for the preprocessing. The result is faster execution time.
Simplicity A developer or database administrator can create a stored procedure that uses a number of intricate queries. When you execute the stored procedure, you do not need to understand, or even see, this complexity. All you need to do is execute the stored procedure to get the result set you need.
Security When you query a set of tables, you must be given rights to see any and all data in each of the tables. However, when a stored procedure is used, you only need rights to execute the stored procedure. You do not need rights to any of the tables being queried by the stored procedure. The stored procedure can then control which rows and columns can be seen by each user.
Reusability A single stored procedure can be used by a number of reports. Therefore, complex queries do not have to be created over and over again when a number of reports need to use the same data.
Maintainability When changes are made to the database structure, the developer or database administrator can make the corresponding changes in the stored procedure so the stored procedure continues to return the same result set. Without stored procedures, a change in the database structure could result in a number of reports needing to be edited.
For these reasons, it is often advantageous to use stored procedures rather than queries for your datasets.
NOTE
Querying against database views has a number of the same benefits as stored procedures and is also a good choice as the source for your datasets. Because querying views is much the same as querying tables (they present fields to the Query Builder just as tables do), we will not spend time discussing views.
When you are using a stored procedure for your dataset, all you need to do is set Query Type to Stored Procedure and select the name of the stored procedure. The Report Designer can figure out the parameters required by the stored procedure and add them to the report. Can’t get much simpler than that!
SSDT, Visual Studio, and Report Builder Steps
1. Expand the Parameters entry in the Report Data window. Notice two parameters, Week and HubCode, were created automatically for us based on the parameters required by the stored procedures we selected.
2. Right-click the entry for the Week parameter in the Report Data window, and select Parameter Properties from the context menu. The Report Parameter Properties dialog box appears.
3. Select the Available Values page.
4. Select the Get values from a query radio button.
5. Select Weeks from the Dataset drop-down list. Select Week from the Value field drop-down list. Select Week from the Label field drop-down list.
6. Click OK to exit the Report Parameter Properties dialog box.
7. Right-click the entry for the HubCode parameter in the Report Data window, and select Parameter Properties from the context menu. The Report Parameter Properties dialog box appears.
8. Change Prompt to Hub.
9. Select the Available Values page.
10. Select the Get values from a query radio button.
11. Select HubsOver45 from the Dataset drop-down list. Select HubCode from the Value field drop-down list. Select Hub from the Label field drop-down list.
12. Click OK to exit the Report Parameter Properties dialog box.
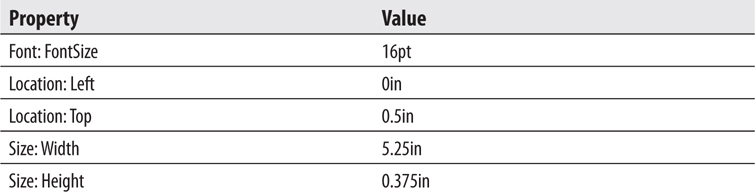
13. Place a text box onto the body of the report. Modify the following properties of this text box:


14. Place a second text box onto the body of the report. Modify the following properties of this text box:
15. Right-click this text box, and select Expression from the context menu.
16. Type the following in the Set expression for: Value area:

17. Click OK to exit the Expression dialog box.
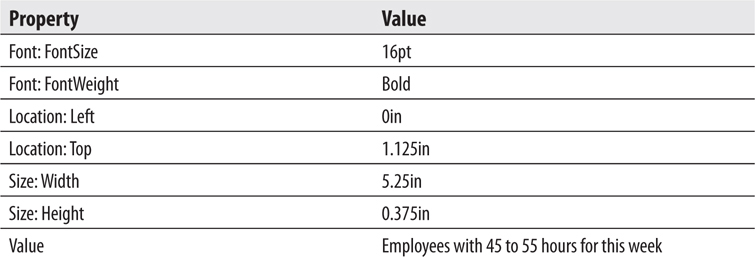
18. Place a third text box onto the body of the report. Modify the following properties of this text box:
19. Use the table template to add a tablix onto the body of the report immediately below the third text box.
20. Place the EmployeeNumber field from the EmployeesOver45 dataset in the leftmost cell in the detail row of the tablix.
21. Place the FirstName field from the EmployeesOver45 dataset in the center cell in the detail row of the tablix.
22. Place the LastName field from the EmployeesOver45 dataset in the rightmost cell in the detail row of the tablix.
23. Drag the HoursWorked field from the EmployeesOver45 dataset, and use the field to add a new column on the right side of the tablix.
24. Select the tablix header row. Modify the following property:

25. Select the leftmost table column. Modify the following property:

NOTE
Remember, you can use the items in the Report Formatting toolbar or Report Builder ribbon to do things such as turning on underlining and changing the text alignment.
26. Right-click the gray box in the upper-left corner of the tablix, and select Tablix Properties from the context menu. The Tablix Properties dialog box appears.
27. Select the Filters page.
28. Click Add to create a new filter entry.
29. Select [HoursWorked] from the Expression drop-down list.
30. Select <= from the Operator drop-down list.
31. Type =55 for Value.
32. Click OK to exit the Tablix Properties dialog box.
33. Modify the following property of the tablix using the Properties window:

34. Select both the tablix and the text box containing the string “Employees with 45 to 55 hours for this week.” Press CTRL-C to copy these two report items. We are going to paste a copy of these two items and use it to create the layout for the Employees over 55 Hours portion of the report.
35. Drag the report body larger. Do this by dragging the dashed line between the report body and the page footer.
36. Press CTRL-V to paste a copy of the two report items. Drag the two new items so they are below the originals.
37. Select the new text box by itself. Change the value of the text box to Employees with over 55 hours for this week.
38. Click anywhere in the new tablix, right-click the gray box in the upper-left corner of the tablix, and select Tablix Properties from the context menu. The Tablix Properties dialog box appears.
39. Select the Filters page.
40. Select > from the Operator drop-down list.
41. Click OK to exit the Tablix Properties dialog box. Your report layout should appear similar to Figure 8-30.
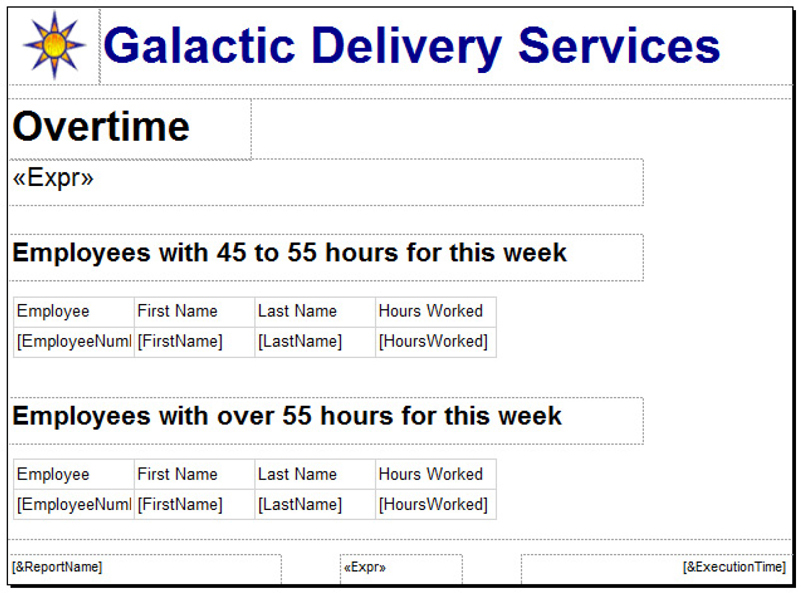
Figure 8-30 The Overtime report layout
42. Preview/run the report.
43. Notice the Week drop-down list is enabled but the Hub drop-down list is disabled. Select 2016–15 from the Week drop-down list.
44. Once a week is selected, the Hub drop-down list is enabled. Select Borlaron Repair Base from the Hub drop-down list. Click the View Report button. Your report should appear similar to Figure 8-31.
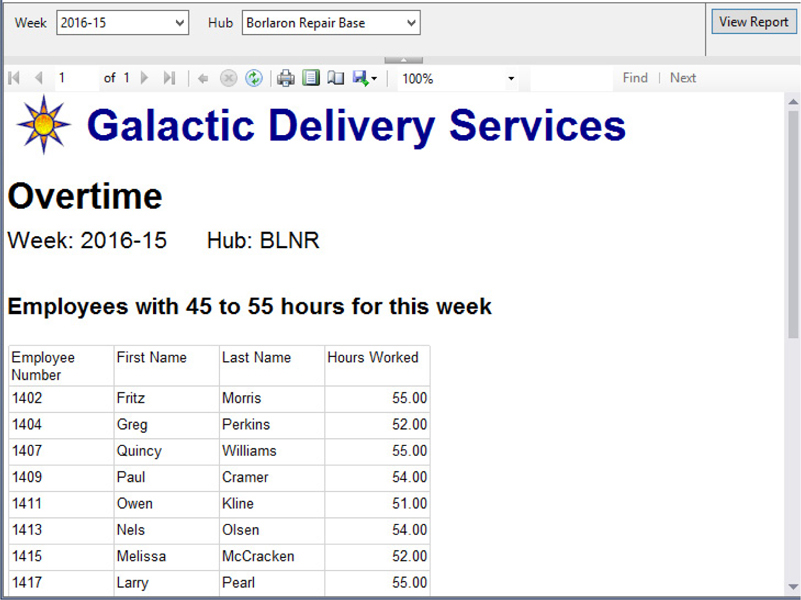
Figure 8-31 The Overtime report preview
45. Select 2016–11 from the Week drop-down list. Borlaron Repair Base is still selected in the Hub drop-down list. Click the View Report button. Note the text under the “Employees with over 55 hours for this week” heading.
46. Save the report.
Task Notes In this report, we used the same dataset to populate two tablixes. We got different information in the two tablixes by applying different filters on each. The filter for the upper table on the report says we only want records in this tablix where the number of hours worked is less than or equal to 55. The filter for the lower tablix on the report says we only want records in this tablix where the number of hours worked is greater than 55. In this way, we can divide the data in the dataset to fulfill the business requirements of the report.
You may have noted that we used an equals sign in front of the number 55 in the Value field for our filter expressions. This is due to the fact that without an equals sign in front of it, the Value is interpreted as a string constant. In other words, without the equals sign, the report would have been trying to compare an integer database field with the string “55”, which results in an error. When we place the equals sign in front of the value, Reporting Services interprets this as an expression. The expression “=55” results in an integer value of 55, which is just what we want for our comparison.
In addition to what you saw here, filters can be applied to data in other locations. A dataset can have a filter applied to it after it has been selected from the database. Individual groups within a table, matrix, or chart can also utilize filters.
Filters work well in situations like the one in this report where we want to use one dataset to provide a slightly different set of records to multiple data regions. They can also be useful for taking data from a stored procedure that provides almost, but not quite, the result set you need. It is usually best, however, to have your filtering done by your select query or stored procedure rather than by the report. The reason is in most cases it is considerably faster and more efficient if the database does the filtering as it executes the query or stored procedure. It does not make sense to have your query select 1000 records from the database if your report is going to filter out all but 10 of these records. Filters are a good tool to have; just remember to use them wisely.
In the Overtime report, we used two drop-down lists to let the user select the parameters for our report. The Week drop-down list enables the user to select the week of the year for which the report should be run. This drop-down list is populated by the Weeks dataset. The Hub drop-down list lets the user select the hub for which the report should be run. This drop-down list is populated by the HubsOver45 dataset. The HubsOver45 dataset requires a value from the Week drop-down list before it can return a list of the hubs with employees working more than 45 hours for that week. In this way, the data that populates the Hub drop-down list is dependent on the value selected in the Week drop-down list.
Reporting Services is smart enough to recognize this dependency and act accordingly. If no value is selected in the Week drop-down list, the Hub drop-down list cannot be populated, so it is disabled. Every time the selected value in the Week drop-down list changes, the Hub drop-down list is repopulated.
Finally, in this report we used the NoRowsMessage property of each of the tablixes. This property enables you to define a string that is output when there are no rows to populate the tablix. When the filter on either tablix in the report filters out all the rows in the dataset, the content of the NoRowsMessage property is displayed. This is more helpful to the user than simply having a blank space where a tablix should be. The NoRowsMessage property is available on any of the data region report items.
SSDT, Visual Studio, and Report Builder Steps1. Return to design mode.
2. Click the Data Bar entry in the Toolbox, if you are using SSDT or Visual Studio, or on the Insert ribbon tab, if you are using Report Builder. (Just click. Do not click and drag.)
3. Move the mouse pointer over the Design area; you will see the data bar insert cursor.
4. Click the cell containing “[HoursWorked]” in the detail row of the upper tablix. The Select Data Bar Type dialog box appears.
5. Select the Bar type style as shown in Figure 8-32.
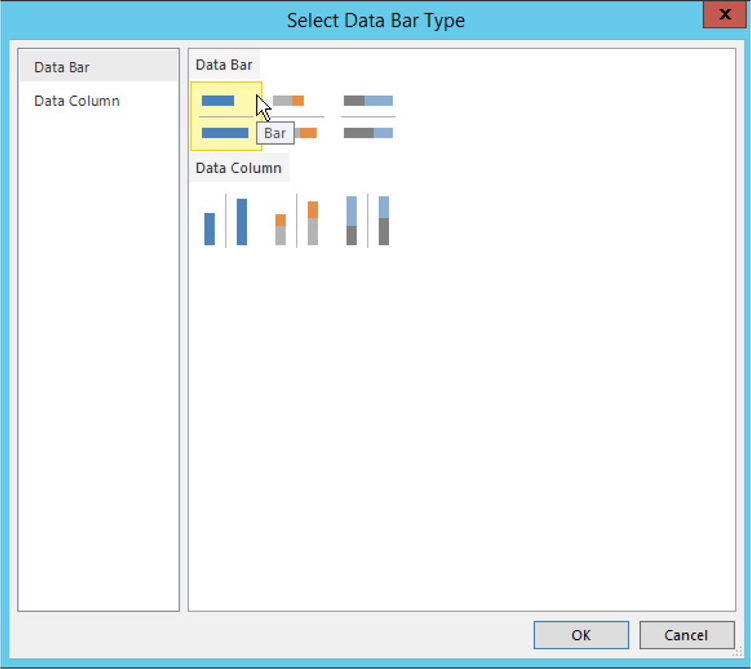
Figure 8-32 The Select Data Bar Type dialog box
6. Click OK. The text box is replaced by a data bar in this cell of the tablix.
7. Repeat Step 2 through Step 6 for the cell containing “[Hours Worked]” in the detail row of the lower tablix.
8. Double-click the data bar in the upper tablix. The Chart Data window appears.
9. In the Values pane of the Chart Data window, click the drop-down arrow next to HoursWorked—the upper of the two items in the Values pane.
10. Select Show Data Labels from the menu as shown in Figure 8-33.
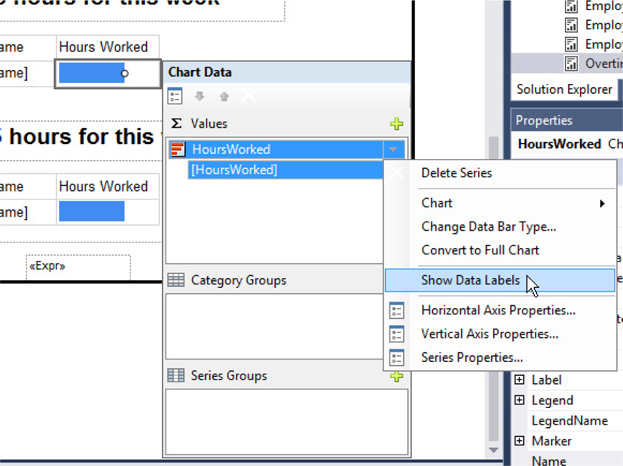
Figure 8-33 The menu for Values in the Chart Data window
11. Click the same drop-down arrow, and select Horizontal Axis Properties from the menu. The Horizontal Axis Properties dialog box appears.
12. Modify the following properties of the Horizontal Axis using the dialog box:
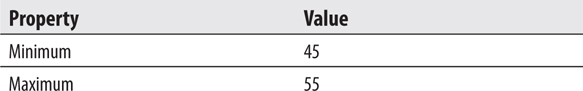
13. Click OK to exit the Horizontal Axis Properties dialog box.
14. Double-click the data bar in the lower tablix. The Chart Data window appears.
15. In the Values pane of the Chart Data window, click the drop-down arrow next to HoursWorked—the upper of the two items in the Values pane.
16. Select Show Data Labels from the menu.
17. Click the same drop-down arrow, and select Horizontal Axis Properties from the menu. The Horizontal Axis Properties dialog box appears.
18. Modify the following properties of the Horizontal Axis using the dialog box:

19. Click OK to exit the Horizontal Axis Properties dialog box.
20. Preview/run the report.
21. Select 2016–15 from the Week drop-down list.
22. Select Borlaron Repair Base from the Hub drop-down list. Click the View Report button. Your report should appear similar to Figure 8-34.
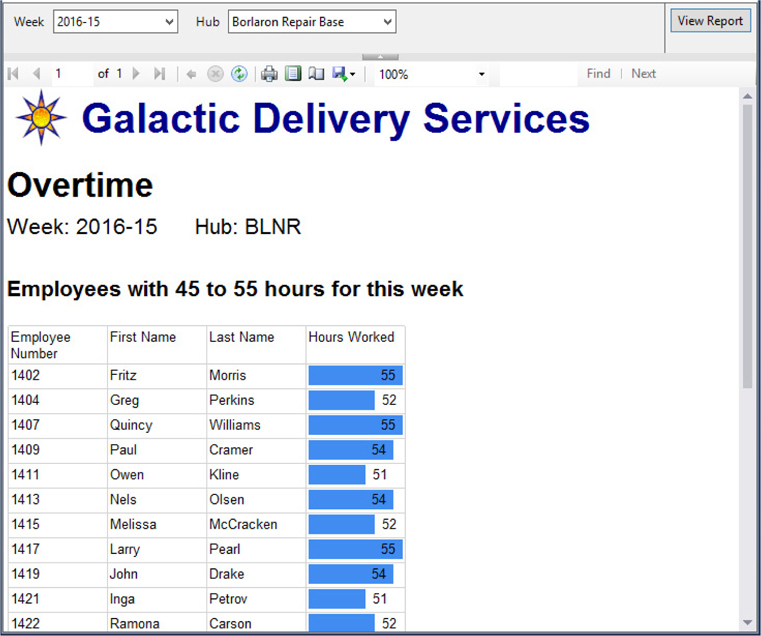
Figure 8-34 The Overtime report with data bar preview
23. Save the report.
Task Notes The data bar provides a way to easily visualize relative quantities. It enables us to add a touch of color and interest to a tablix report. The sparkline and the indicator perform a similar function, allowing us to provide a compact graphical interpretation of a quantity or series of quantities. We will use the sparkline and the indicator in examples later in this book.
The data bar is essentially a regular chart spread across a number of rows or columns of a tablix. It is possible to make a chart behave exactly like a data bar, but it requires the manipulation of a number of chart parameters. The data bar item gives us an efficient way to get this behavior. Just as we can make a chart behave as a data bar, we can convert a data bar to a regular chart item. This is done by right-clicking on a data bar and selecting Convert to Full Chart from the context menu.
In the previous task, we got a little help formatting our data bar item because we placed it in a tablix cell that was already displaying a field from the dataset. The report authoring environment was smart enough to recognize this situation and to associate that dataset field with the data bar item it created. That is why when we displayed the Chart Data window, it already showed the HoursWorked field. If this prepopulation had not been done for us, we would have had to use the green plus sign to associate a field with the data bar as we did with the chart item in Chapter 6.
Implementing fixed and dynamic columns and rows in the same tablix
Using the Switch() function
Business Need The Galactic Delivery Services personnel department is finding the Employee Time Report to be useful. To make the report even more useful, they would like to add summary information to the report. To the right of the current report, they would like to summarize the hours worked by the day of the week—in other words, how many hours were put in on Mondays, Tuesdays, Wednesdays, and so on. They would like a summary of the hours worked at each delivery hub specified by hub code.
Finally, at the bottom of the report, they would like a summary of the hours worked by job type. Our database does not contain a definition of job type. Job type is an ad hoc classification that the personnel department uses for some analysis. All levels of mechanics, both I and II, form one job type. All levels of sorters, both I and II, form a second job type, and transport pilots and transport copilots make up the third job type.
1. Copy and Rename the Existing Report
2. Modify the Dataset and the Layout
SSDT, and Visual Studio Steps1. Reopen the Chapter08 project, if it was closed. Close the Overtime report, if it is open.
2. Right-click the EmployeeTime Report in the Solution Explorer, and select Copy from the context menu.
3. Right-click the Chapter08 project in the Solution Explorer, and select Paste from the context menu. A copy of the report appears in the Solution Explorer.
4. Right-click this new copy, and select Rename from the context menu. Rename the report RevisedEmployeeTime.rdl.
5. Double-click the entry for the RevisedEmployeeTime report to open this report for editing.
Report Builder Steps1. Click the File tab of the ribbon and select Open from the menu.
2. Double-click the entry for the EmployeeTime report to open it.
3. Click the File tab of the ribbon and select Save As from the menu. The Save As Report dialog box appears.
4. Enter RevisedEmployeeTime for Name.
5. Click Save.
Task Notes We have kept a copy of the original report layout in case you want to refer back to it. We have a second copy of the report ready for us to modify to satisfy the new user requirements. Saving a copy of a report layout that your users really like before making modifications is a good idea, even if it is the users themselves asking for the modifications. Users have been known to change their minds and utter the words, “I think I liked it better the way it was.”
SSDT, Visual Studio, and Report Builder Steps
1. In the Report Data window, expand the Datasets folder.
2. Right-click EmployeeTime and select Query from the context menu. The Query Designer window opens.
3. Add the HubCode field to the end of the field list, as shown here in bold:
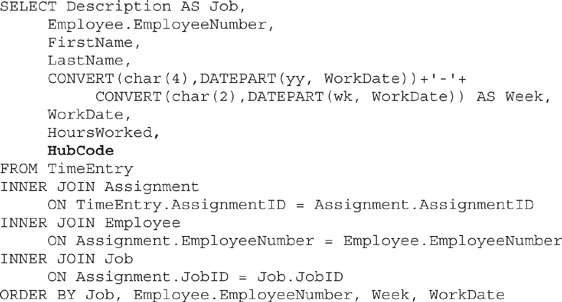
4. Run the query to make sure no errors exist. Correct any typos that may be detected.
5. Click OK to exit the Query Designer window.
6. Right-click in the bottom row of the tablix. Select Tablix: Insert Row | Below from the context menu. A new static row is added at the bottom of the tablix.
7. Right-click in the row you just added, and select Tablix: Add Group | Row Group: Adjacent Below from the context menu. The Tablix group dialog box appears.
8. Select [HubCode] from the Group by drop-down list.
9. Click OK to exit the Tablix group dialog box. A new row group is added at the bottom of the tablix.
10. Merge the leftmost three cells in the bottom row of the tablix.
11. Select the HubCode field in the newly merged cells.
12. Merge all of the cells in the second-from-the-bottom row in the tablix.
13. Set the following properties of this newly merged cell:
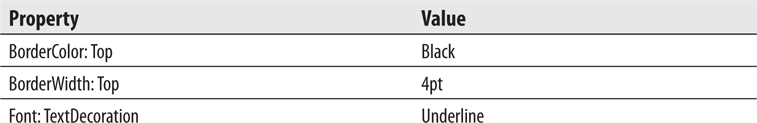
14. In the cell in the lower-right corner of the tablix, select the HoursWorked field. This field will automatically be enclosed in a Sum() aggregate function.
15. Set the following property of this cell:

16. Preview/run the report. The bottom of your report should appear as shown in Figure 8-35.
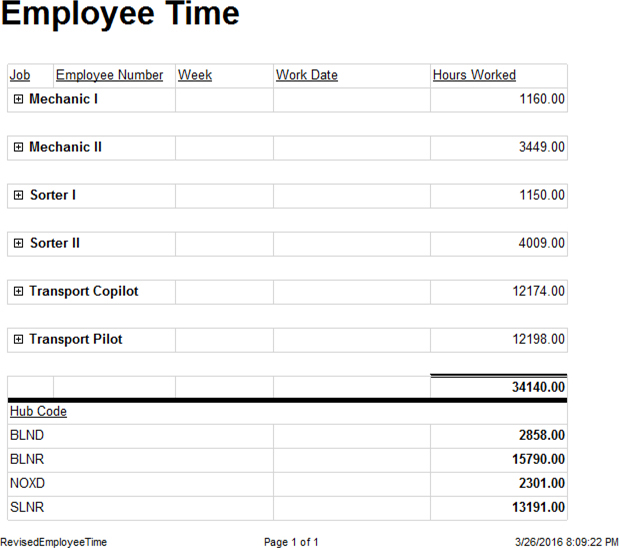
Figure 8-35 The Revised Employee Time report with Hub Code summary
17. Return to design mode.
18. Right-click in the bottom row of the tablix. Select Tablix: Insert Row | Outside Group – Below from the context menu. A new static row is added at the bottom of the tablix.
19. Right-click in the row you just added, and select Tablix: Add Group | Row Group: Adjacent Below from the context menu. The Tablix group dialog box appears.
20. Click the fx button next to the Group by drop-down list. The Expression dialog box appears.
21. Enter the following in the Set expression for: GroupExpression area:

22. Highlight the entire expression you just entered, and press CTRL-C to copy this text.
23. Click OK to exit the Expression dialog box.
24. Click OK to exit the Tablix group dialog box. A new row group is added at the bottom of the tablix.
25. Merge the leftmost three cells in the bottom row of the tablix.
26. Right-click in the newly merged cells, and select Text Box: Expression from the context menu. The Expression dialog box appears.
27. Delete the equals sign from the Set expression for: Value area, and press CTRL-V to paste the expression you entered in Step 21.
28. Click OK to exit the Expression dialog box.
29. Merge all of the cells in the second-from-the-bottom row in the tablix.
30. Set the following properties of this newly merged cell:
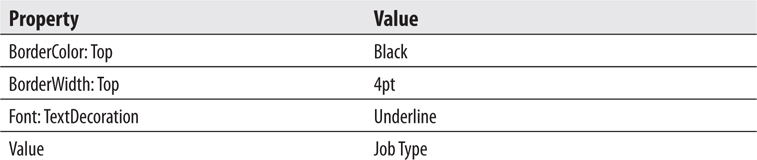
31. In the cell in the lower-right corner of the tablix, select the HoursWorked field. This field will automatically be enclosed in a Sum() aggregate function.
32. Preview/run the report. The bottom of your report should appear as shown in Figure 8-36.
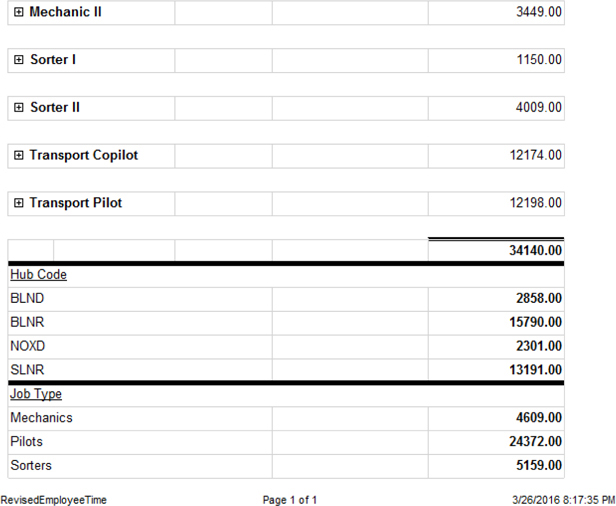
Figure 8-36 The Revised Employee Time report with Job Type summary
33. Return to design mode.
34. Right-click in the rightmost column in the tablix, and select Tablix: Insert Column | Right from the context menu. A new column is added to the right of the tablix.
35. Size the new column so it is approximately one-fourth its original width.
36. Right-click in the new column, and select Tablix: Add Group | Column Group: Adjacent Right from the context menu. The Tablix group dialog box appears.
37. Click the fx button next to the Group by drop-down list. The Expression dialog box appears.
38. Expand the Common Functions entry in the Category pane. Select the Date & Time entry in the Category pane. Double-click the Weekday entry in the Item pane.
39. Select Fields (EmployeeTime) in the Category pane. Double-click the WorkDate field in the Field pane.
40. Type ) at the end of the expression.
41. Click OK to exit the Expression dialog box.
42. Click OK to exit the Tablix group dialog box. A new column group is added at the right of the tablix.
43. Right-click the upper cell in the new column, and select Textbox: Expression from the context menu. The Expression dialog box appears.
44. Expand the Common Functions entry in the Category pane. Select the Date & Time entry in the Category pane. Double-click the WeekdayName entry in the Item pane.
45. Double-click the Weekday entry in the Item pane.
46. Select Fields (EmployeeTime) in the Category pane. Double-click the WorkDate field in the Field pane.
47. Type )) at the end of the expression.
48. Click OK to exit the Expression dialog box.
49. Using the Field Selector, select the HoursWorked field in each of the three cells below the cell you just modified. In each case, the field will be enclosed in a Sum() aggregate function.
50. Click the gray rectangle at the top of the second column from the right (the narrow column) to select the entire column. Modify the following property:

51. The tablix layout should appear as shown in Figure 8-37.

Figure 8-37 The Revised Employee Time report final layout
52. Preview/run the report. The tablix portion of the report should appear as shown in Figure 8-38.
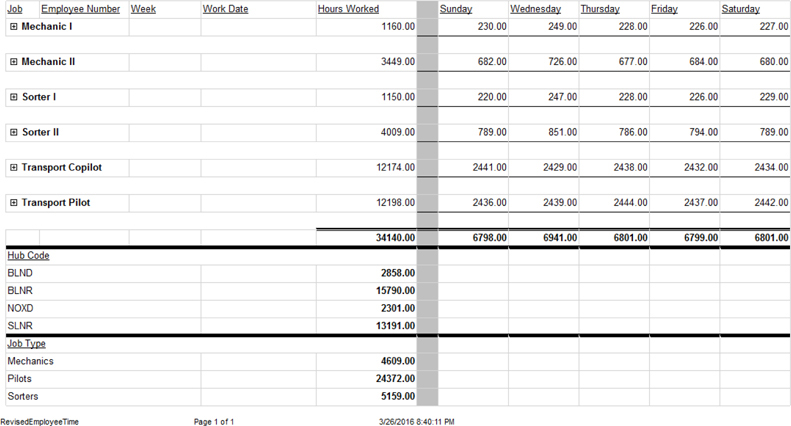
Figure 8-38 The Revised Employee Time report final preview
53. Save the report.
Task Notes The types of additional summary information requested in the business need for this report are the reason the tablix came along. Without the tablix, this kind of formatting was difficult, if not impossible. With the tablix, however, the report is straightforward to create, if perhaps a bit confusing at first. The key is to look at the symbols in the gray boxes across the top and down the left side of the tablix, along with the entries in the Row Groups and Column Groups areas. As was discussed previously, these symbols in the gray boxes tell you which columns and rows are static and which are dynamic. The entries in the Row Groups and Column Groups areas allow you to edit the properties of each dynamic grouping.
Static rows and static columns appear once in the tablix. The first row in the tablix containing the column headings is an example of a static row. The narrow column containing the gray background is an example of a static column. Each appears only once in the rendered report.
Dynamic rows and columns repeat, depending on the data in the dataset used to populate the tablix. The group header rows are examples of dynamic rows. The rightmost day of the week group column is an example of a dynamic column. We don’t know how many of these rows or columns will appear in the report until it is actually rendered.
Dynamic groups can be nested one inside the other. This is the case with the original version of the Employee Time report, where we had Job, Employee, Week, and Detail groupings nested one inside the other. Dynamic groups can also be adjacent to one another, as our hub code and job type groups were in the revised version of the report.
To create the job type group, we used the Switch() function. The Switch() function is similar to the IIF() function. The IIF() function enables us to test a single Boolean (true/false) statement and return one value if it is true and another if it is false. The Switch() function allows us to test multiple Boolean statements in a specific order. The function will return the value associated with the first Boolean statement that turns out to be true.
Here is the expression we used in the report:
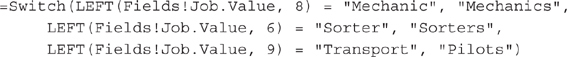
The Switch() function first tests to see if the left eight characters of the Job field are equal to the word Mechanic. If so, the string “Mechanics” is returned by the function. If it is not, the function tests to see if the left six characters of the Job field are equal to the word Sorter. If so, the string “Sorters” is returned by the function. Finally, the function tests to see if the left nine characters of the Job field are equal to the word Transport. If so, the string “Pilots” is returned by the function.
Using the Lookup function
Using the LookupSet function
Using the MultiLookup function
Using the Join function
Using the Split function
Business Need As with the Employee Time report, the Galactic Delivery Services personnel department likes the Employee List report. To add to its functionality, they would like to add information about the total hours worked by each employee. They would also like to see the levels of education for other employees at the hub where the employee works and the highest level of education for each union the employee is a member of.
We could modify our existing query for this report or create a complex stored procedure to gather and return all of these items. Instead, we are going to make use of some existing stored procedures that return the data required. These additional stored procedures will each have their own dataset in the report. It is not possible to join data between two datasets in a report. What we can do instead is use the Lookup functions in Reporting Services to look up a value from one dataset and find related information in another dataset.
1. Copy and Rename the Existing Report, Add Datasets, and Utilize the Lookup Functions
SSDT, Visual Studio, and Report Builder Steps
1. Copy the EmployeeList report the same way you copied the EmployeeTime report in the previous exercise. Name the copy of the report RevisedEmployeeList.rdl. Double-click the RevisedEmployeeList report to edit it.
2. In the Report Data window, expand the Data Sources folder.
3. Right-click the entry for the Galactic data source, and select Add Dataset from the context menu. The Dataset Properties dialog box appears.
4. Enter TotalHours for Name.
5. Select the Stored procedure radio button.
6. Select stp_TotalHoursWorked from the Select or enter stored procedure name drop-down list.
7. Click OK to exit the Dataset Properties dialog box.
8. Right-click the entry for the Galactic data source, and select Add Dataset from the context menu. The Dataset Properties dialog box appears.
9. Enter EdByHub for Name.
10. Select the Stored procedure radio button.
11. Select stp_EducationByHub from the Select or enter stored procedure name drop-down list.
12. Click OK to exit the Dataset Properties dialog box.
13. Right-click the entry for the Galactic data source, and select Add Dataset from the context menu. The Dataset Properties dialog box appears.
14. Enter EdByUnion for Name.
15. Select the Stored procedure radio button.
16. Select stp_HighestEdByUnion from the Select or enter stored procedure name drop-down list.
17. Click OK to exit the Dataset Properties dialog box.
18. Scroll through the Design area to the right side of the table.
19. Right-click anywhere in the rightmost column of the table, and select Tablix | Insert Column | Right from the context menu.
20. Enter Total Hours in the topmost cell of this new column.
21. Right-click the bottom-most cell of this new column, and select Expression from the context menu. The Expression dialog box appears.
22. Enter the following in the Set expression for: Value area:

23. Press ESC to get rid of the auto-complete list.
24. Continue typing the following in the Set expression for: Value area.

Don’t forget to type the period.
25. Click OK to exit the Expression dialog box.
26. Right-click anywhere in the right-most column of the table, and select Tablix | Insert Column | Right from the context menu.
27. Enter Educ. for Hub in the top-most cell of this new column.
28. Right-click the bottom-most cell of this new column, and select Expression from the context menu. The Expression dialog box appears.
29. Enter the following in the Set expression for: Value area:

30. Press ESC to get rid of the auto-complete list.
31. Continue typing the following in the Set expression for: Value area.
Don’t forget to type the period. Also, be sure to include a space after each comma, including the comma in quotes.

32. Click OK to exit the Expression dialog box.
33. Right-click anywhere in the right-most column of the table, and select Tablix | Insert Column | Right from the context menu.
34. Enter Educ. for Union in the top-most cell of this new column.
35. Right-click the bottom-most cell of this new column, and select Expression from the context menu. The Expression dialog box appears.
36. Enter the following in the Set expression for: Value area:

37. Press ESC to get rid of the auto-complete list.
38. Continue typing the following in the Set expression for: Value area.

Don’t forget to type the period. Also, be sure to include a space after each comma, including the commas in quotes.
39. Click OK to exit the Expression dialog box.
40. Preview/run the report. The report should appear as shown in Figure 8-39.
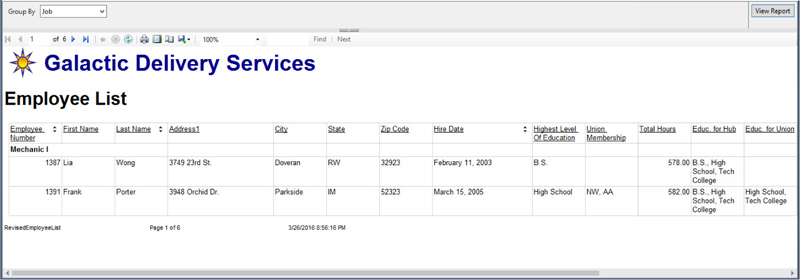
Figure 8-39 The revised Employee List report
41. Save the report.
Task Notes As stated in the business need for this report revision, Reporting Services does not allow us to directly join the records from two datasets. The three functions used here, Lookup, LookupSet, and MultisetLookup, allow us to take a value from one dataset and use it to look up one or more values from a second dataset. This enables us to get behavior that comes very close to this join behavior.
In our first requirement for this revision, we were asked to find the total hours worked for each employee in the report. The stp_TotalHours stored procedure returns a dataset that includes two columns. The first is the Employee Number, and the second is the total hours worked for that employee. To get the results we want, we need to look up each Employee Number and put the associated total hours worked in the report column.
The Lookup function does this for us. It works with two datasets: the current dataset and the lookup dataset. The current dataset is the dataset tied to the data region that is displaying the result of the lookup. In this exercise, the current dataset is the Employees dataset. The lookup dataset is the dataset where the result of the Lookup function is coming from. In this exercise, the lookup dataset is the TotalHours dataset.
The parameters of the Lookup function are shown in Table 8-1.
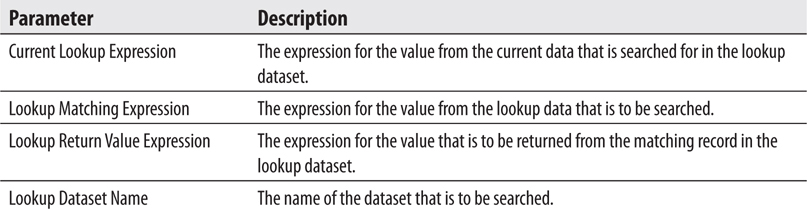
Table 8-1 Parameters of the Lookup and LookupSet Functions
In our second requirement for this revision, we were asked to find the levels of education completed by employees at this employee’s hub. The stored procedure used to return this data provides a hub name and a level of education completed by one or more employees working at that hub. The stored procedure result set includes three records for the Borlaron Repair Base: one for high school, one for tech college, and one for a bachelor of science (B.S.) degree. This is because one or more employees working at the Borlaron Repair Base has a highest level of education of high school. One or more of these employees has a highest level of education of tech college, and one or more of these employees has a highest level of education of B.S. degree.
Given this structure, our lookup can return multiple values. For instance, when we look up the Borlaron Repair Base, we will get three matching records: high school, tech college, and B.S. degree. Fortunately, the LookupSet function can return multiple values. It does this by returning an array of values as the result of each lookup operation.
The LookupSet function works with two datasets: the current dataset and the lookup dataset, just like the Lookup function. It also has the same parameters as the Lookup function. The only difference is the LookupSet function returns an array of values rather than a single value. It is up to us to take that array and turn it into something we can display in a report text box. We use another function, the Join function, for this purpose.
The Join function takes two parameters. The first parameter is an array. The second parameter is a separator. The Join function takes all of the values in the array and puts them together in a string. It puts the separator text between each value. If we call the Join function with an array containing three values: High School, Tech College, and B.S. degree, along with a separator of “,”, then we get the string “High School, Tech College, B.S. degree.”
In our third requirement for this revision, we were asked to find the highest level of education for members of each union that a given employee is a member of. The stp_HighestEdByUnion stored procedure returns only one record for each union. However, an employee can be a member of more than one union. Therefore, we may need to look up the highest education value for more than one union. The MultiLookup function does this for us.
The MultiLookup function works with two datasets: the current dataset and the lookup dataset, just like the Lookup and LookupSet functions. It returns an array of values just like the LookupSet function. It differs in that its first parameter is an array rather than a single value. See Table 8-2.
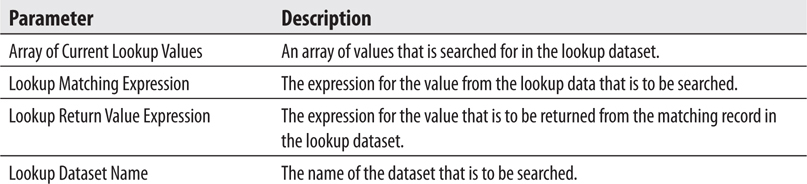
Table 8-2 Parameters of the MultiLookup Function
It is up to us to create an array to pass as the first parameter. We use one more function, the Split function, for this purpose.
The Split function takes two parameters. The first parameter is a string of values that are separated by a set of characters—for example, a comma and a space. The second parameter is the separator. The Split function looks at the string of values until it finds the first occurrence of the separator. Everything up to the point of the separator is placed in the first element of an array. Everything between the first and second occurrences of the separator is placed in the second element of the array, and so on. After all of the separators have been found in the string, the array is returned as the result of the function. The split function enables us to turn a comma-separated list of union memberships into an array that can be used as the first parameter of the MultiLookup function.
The Lookup, LookupSet, and MultiLookup functions give us the flexibility we need to perform just about any type of lookup that might be required.
In Chapter 1, we talked about the fact that the report definitions are stored using the Report Definition Language (RDL). RDL was created by Microsoft specifically for Reporting Services. It was one of the first published Extensible Markup Language (XML) document standards created by Microsoft.
Microsoft has gone public with the specifications for RDL. Third parties can create their own authoring environments for creating report definitions. If the RDL from these third-party tools conforms to the RDL standard, the reports created by these tools can be managed and distributed by Reporting Services.
Because RDL is an XML document, you can look at a report definition in its raw form. If you were so inclined, you could use Notepad to open an RDL file and look at its contents. In fact, you don’t even need Notepad. You can look at the contents of an RDL file right in SSDT or Visual Studio.
NOTE
This ability to view the contents of an RDL file is not available in Report Builder.
If you are using SSDT or Visual Studio, right-click the entry for Overtime.rdl in the Solution Explorer, and then select View Code from the context menu. You see a new tab in the layout area called Overtime.rdl. This tab contains the actual RDL of the report, as shown in Figure 8-40.
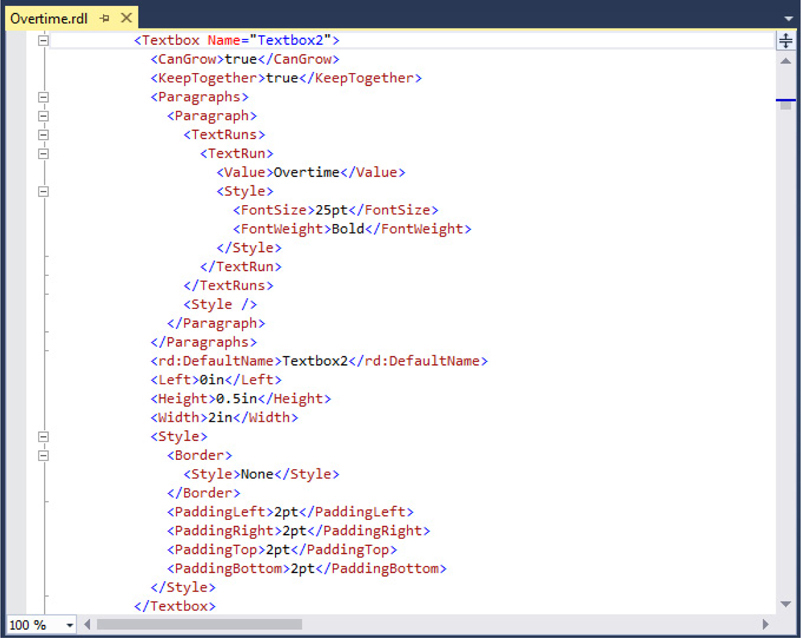
Figure 8-40 The RDL for the Overtime report
Because the RDL is an XML document, it is made up of pairs of tags. A begin tag is at the beginning of an item, and an end tag is at the end of the item. A begin tag is simply a string of text, the tag name, with < at the front and > at the back. An end tag is the same string of text with </at the front and > at the back. This pair of tags creates an XML element. The information in between the two tags is the value for that element. In the following example, the Height element has a value of 0.625in:

There can never be a begin tag without an end tag, and vice versa. In fact, it can be said that XML is the Noah’s Ark of data structures, because everything must go two by two.
In addition to simple strings of text, XML elements can contain other elements. In fact, a number of elements can nest one inside the other to form complex structures. Here’s an example:
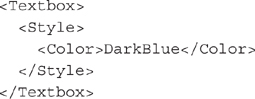
In some cases, begin tags contain additional information as attributes. An attribute comes in the form of an attribute name, immediately following the tag name, followed by an equals sign (=) and the value of the attribute. In this example, the Textbox element has an attribute called Name with a value of “Textbox1”:

The RDL contains several sections: the page header, the body, the data sources, the datasets, the embedded images, the page footer, and the report parameters. Each section starts with a begin tag and is terminated by an end tag. For example, the page header section of the RDL starts with <PageHeader> and is terminated by </PageHeader>.
In Figure 8-40, you can see the entire XML structure for Textbox2. The begin tag of the text box includes a Name attribute. This corresponds to the Name property of the text box. In between the begin and end tags of the text box element are additional elements, such as the FontSize. These elements correspond to the other properties of this text box. Only those properties that have been changed from their default values are stored in the RDL.
One other interesting thing about viewing the RDL is you can make changes to the RDL and have them affect the report design. Use the text find capabilities of this RDL editor to find the “ReportParameters” section of the RDL. Find the Prompt element within the Week report parameter element, as shown in Figure 8-41. Replace “Week” with “Work Week” and click Save All on the toolbar. Right-click the entry for Overtime.rdl in the Solution Explorer, and then select View Designer from the context menu. Click the Preview tab. You notice the prompt has been changed to Work Week.

Figure 8-41 Using the Find capability within the RDL code view
NOTE
You may see several informational messages in the Error List window. You can ignore these messages. The messages will disappear from the Error List window when you close the rdl.
If you do find a reason to make modifications directly to the RDL, do so with care. If you break up a begin/end pair or enter an invalid value for a property element (such as puce for a color), you can end up with a report that will not load in the Report Designer. Save your work immediately before making changes directly to the RDL. In just about every case, however, the designer works better for making changes to a report layout, so do your editing there.
In this chapter, we continued to unlock additional features of Reporting Services. We’re always working toward the goal of giving you the tools you need to meet your reporting needs. You should now be well on your way to being able to say, “Yes, I can do that!”
In the next chapter, we look at some of the advanced features of Reporting Services. After that, we work with the Mobile Report Publisher.