Sharing Business Intelligence
In This Chapter

SQL Server 2000 Reporting Services was Microsoft’s entry into the web-based reporting arena. This first version of Reporting Services enabled you to easily share business information—what is commonly known as “business intelligence” these days—with management, co-workers, business partners, and customers throughout the world. In an interconnected workplace, it makes sense that your reporting solution should offer companywide, nationwide, and even worldwide communication.
SQL Server 2005 Reporting Services built on the success of the original. Where almost every other aspect of the SQL Server 2005 release represented a completely new platform, Reporting Services simply added to the solid foundation provided by the earlier version to make a great product even better. The 2005 release provided an additional report-authoring environment, improved report-development features, and enhanced capabilities for distributing reports.
The SQL Server 2008 release brought major changes to Reporting Services. The report processing and rendering engine was completely rewritten. This allowed Reporting Services to be more robust, especially when rendering large reports. This overhaul also allowed for major changes to the report definition structure and a simplification of the inner workings of the report-rendering engine.
The interim SQL Server release, SQL Server 2008 R2, which came out in 2010, added more data visualizations and report-authoring enhancements. Databars, sparklines, indicators, and maps were added to the array of tools available for presenting information on reports in a graphical format. Individual report items could be saved in a report part gallery for reuse by other report authors. The SQL Server 2012 and SQL Server 2014 releases saw some minor enhancements to Reporting Services, but none of the major changes to the Reporting Services architecture of the previous versions.
All that brings us to the latest release of Reporting Services, delivered as part of SQL Server 2016—a release that, once again, brings exciting new features and architectural changes to the product. But before we dive in to the latest release, let’s take a quick look back at Reporting Services’ beginnings.
Reporting Services was code-named Rosetta during its original development at Microsoft. This name comes from the Rosetta Stone, a stone slab found in 1799 that contains an inscription in both Egyptian hieroglyphics and Greek. This stone provided the key piece of information necessary to unlock the mystery of Egyptian hieroglyphics for the modern world. Just as the Rosetta Stone brought key information across 1,400 years of history, Rosetta, or Reporting Services, is designed to bring key information across distances to unlock the mystery of success for your business.
The Rosetta project, which I was privileged to play a very, very small part in, was originally conceived as a feature of SQL Server 2005. However, as Microsoft told prospective customers about the features in Rosetta and demonstrated the first alpha versions, the reaction was strong: “We need this product and we need it now!” Because of this reaction, Microsoft decided that Rosetta would not wait for 2005, but, instead, would be made its own product to work with SQL Server 2000.
Just what are the features of Reporting Services that got everyone so excited? Reporting Services provides an environment for creating a number of different types of reports from a number of different data sources. The reports are previewed and refined using one of several authoring tools. Once completed, the reports are deployed to a report server, which makes the reports available via the Internet in a structured, secure environment. Last, but not least, the report management and distribution portion of Reporting Services is free of charge when installed on a server already running SQL Server.
Why did this set of features generate so much excitement? When you put them all together, the result is a product that facilitates the creation, management, and timely use of business intelligence.
Because you are reading this book, you are probably the keeper of some type of information that is important to your organization. You may have information on sales, finance, production, delivery, or one of a hundred other areas. All this information makes up the business intelligence necessary to keep today’s corporate, academic, nonprofit, and governmental entities humming along.
In addition to maintaining this information, you have a need to share this information with others. This need to share may have come from an important lesson you learned in kindergarten (“The world would be a much happier place if we all learned to share”) or, more likely, this need to share your information was probably suggested to you by a manager or executive somewhere higher up the food chain. See if any of these situations sound familiar.
Your company’s order-entry system automatically updates the inventory database in near real time. In your company’s line of business, some orders can require a large quantity of a given product. Because of this, it is important that the production manager knows about these changes in the inventory level in a timely manner so he can adjust production accordingly.
The production manager has asked you to provide him with an up-to-date inventory report. He would like this report to be available on his PC. He would also like to be able to view the report on his tablet or on his smartphone so he can get the latest information wherever he happens to be.
You are responsible for maintaining information on the amount of credit your company will extend to each of its clients. This information is updated daily in the company database. A report containing the credit information for all clients is printed weekly at corporate headquarters and mailed to each sales representative.
The vice president of sales has requested that the credit information be made available to the sales staff in a timelier manner. He has asked that this report be accessible over the Internet from anywhere across the country. The sales representatives will print the report when they have access to the Internet and then carry it with them for those times when they cannot get online. He has also asked that this online version of the report be as up to date as possible.
The chief executive officer (CEO) for your company has a hands-on management style. She likes to participate in all facets of the decision-making process and, therefore, needs to stay well informed on all aspects of the company. This includes the corporate balance sheet, inventory and production, and the company’s stock price. She wants this information presented on screen as key performance indicators, as well as available in a more detailed format for analysis.
The CEO expects all this information to be available on her PC when she arrives for work each morning at 7:00 A.M. The information must be in a format that’s appropriate to present to the corporate vice presidents at their meeting each morning at 9:00 A.M. As you search for solutions to this one, remember no budget is allocated for this project—and, of course, your job is on the line.
These situations, and a thousand others just like them, confront businesses each day. In our world of massive connectivity, these types of requests are not unreasonable; even if that is the case, it does not mean these requests are easy to fulfill.
The first candidate to explore when you’re looking to move information across the Internet is, of course, Hypertext Markup Language (HTML). You could use one of a number of tools for creating data-driven HTML pages. This would include Microsoft’s ASP.NET, any of a number of Java environments, Hypertext Preprocessor (PHP)—the list goes on and on.
Each of these environments is good at creating dynamic web content. However, they all take time and a certain level of programming knowledge. With deadlines looming, you may not have the time to create custom web applications to solve each of these problems. If you are used to manipulating data with Crystal Reports or other reporting environments, you may not be ready to jump into full-blown application development, and you may not have a desire to do so at any time in the near future.
Even if you did create an application for each of these scenarios, one important requirement of the vice president of sales is this: the information must be printable. HTML screens can look great in a browser window, but they can cause problems when printed. The content can be too wide to fit on the page, and there can be problems with page breaks. These types of formatting issues could make the output difficult for the sales representatives and the production manager to read. Let’s look for another option!
Because the capability to control the printed output is important, Adobe PDF should be considered. Portable Document Format (PDF) files look good, both on the screen and in print. You can control where the page breaks occur and make sure everything looks great. However, several issues need to be overcome with PDF files.
First of all, you need some type of utility to produce output in a PDF format. This could be Adobe’s full version of Acrobat or some other utility. Once this has been obtained, a document must be created that contains the desired database information. This is usually a report created with a reporting tool or development software. After this document is created, it is converted into a PDF document using an export function or a special printer driver.
Once the PDF document has been created, it can be copied to a website or online file repository for access through the Internet. However, as soon as the PDF document is created, it becomes a static entity. It does not requery the database each time it is requested from the website. To remain up to date, the PDF document must be re-created each time the source data is changed.
Perhaps there is a better way.
Reporting environments from other companies certainly overcome the limitations of our first two options. These third-party products allow reports to be built without requiring large amounts of programming. They can also dynamically generate output in a format such as Adobe PDF that will perform well onscreen and in print.
The problem with third-party reporting environments such as Cognos or Tableau is the cost. Some products can run into tens or hundreds of thousands of dollars. This can be enough to break the budget—if indeed there is a budget—for reporting projects such as the ones discussed previously.
Now you can begin to see why companies get so excited about Reporting Services. It provides an elegant solution for all three of your demanding users—the production manager, the vice president of sales, and the chief executive officer. Reporting Services does not have the drawbacks—cost, complexity, lack of flexibility—inherent in the possible solutions considered previously.
Reporting Services provides a simple drag-and-drop approach to creating reports from database information. You can use a number of different tools to author reports. The Report Builder and the Report Designer in Visual Studio/SQL Server Data Tools let you truly unlock the power of Reporting Services to convey complex information.
You do not need to be a programmer to create Reporting Services reports. However, if you are comfortable with programming constructs, Chapters 8 and 9 include some simple Visual Basic expressions that can be used to spice up your report’s presentation. Note, however, these expressions are not necessary to create useful reports. They are also simple enough that even those who are totally new to Visual Basic .NET can master them with ease.
With Reporting Services, you can view reports in your browser. Reporting Services provides a high-quality presentation of each report using dynamic HTML. Reports are presented in multiple pages with “DVR button” controls for navigating between pages.
Because Reporting Services uses dynamic HTML, it does not require any additional programs to be downloaded on your PC. There is no ActiveX control to install, no Java applet to download. Any browser that supports HTML 5 can view reports.
In addition to presenting reports in your browser using dynamic HTML, Reporting Services can render a report in a number of additional formats. These include an Adobe PDF document, a Tagged Image File Format (TIFF) image, an Excel spreadsheet, a Word document, and even a PowerPoint presentation. All these formats look great onscreen when they are viewed, or on paper when they are printed.
When Reporting Services renders a report, it gathers the most recent data from the database, formats the data in the manner the report’s author specifies, and outputs the report into the selected format (that is, HTML, PDF, TIFF, and so on).
Even when being output in the PDF or TIFF format for printing, a report can be configured to requery the database every time it is accessed. This ensures the report is always up to date.
Reporting Services provides several different ways to deliver reports to end users. Using either the Reporting Services web portal or SharePoint, users can access reports via an intranet or the Internet. Reporting Services also includes security features, which ensure that users access only the reports they should.
Users can also subscribe to reports they would like to receive on a regular basis. Reporting Services will store a copy of the rendered report in a Windows file share or SharePoint document library, or send out a copy of the report as an e-mail attachment to each subscriber on a regularly scheduled basis. Alternatively, a Reporting Services administrator can send out a copy of the report as an e-mail attachment to a number of recipients on a mailing list. If that isn’t enough, reports can be embedded right in .NET applications.
There are now three ways to visualize your data in SQL Server 2016 Reporting Services:
As a key performance indicator (KPI) in the web portal
In a report suitable for printing
In a report that adapts for display on tablets and smartphones
This flexibility gives you the tools to get the information to your user the way they want to see it on the device most convenient at the time. Along with this functionality delivered by the SQL Server environment, you can also pin Reporting Services reports to a Power BI dashboard and render them using the Power BI mobile app.
For anyone who has a licensed copy of SQL Server 2016, the price of Reporting Services is certainly right. Free! As long as the report server is installed on the same computer as the SQL Server database engine, your SQL Server 2016 license covers everything. With this single server architecture, it will not cost you one additional penny to share your reports with others using Reporting Services. Of course, some features will require a SQL Server Enterprise Edition license. More about that as each of those features is discussed.
Let’s take one more look at the three scenarios we considered earlier—the production manager, the vice president of sales, and the chief executive officer. How can you use the features of Reporting Services to fulfill the requests made by each of them?
The production manager wants a report showing the current inventory. It is certainly not a problem to query the inventory data from the database and put it into a report. He can request a report with up-to-the-second data wherever he is. With Reporting Services’ new mobile reports, he can view that report on any device.
The solution for the vice president of sales is even more straightforward. He wants a report with credit information for each client. No problem there. Next, he wants the report available to his sales staff, accessible via the Internet. To achieve this, you can publish the report on the Reporting Services web portal. You can even set up security so only sales representatives with the appropriate user name and password can access the report.
In addition, the vice president of sales wants the report to look good when printed. This is achieved with no additional work on the development side. When the sales representatives retrieve the report from the website, it is displayed as HTML. The sales representatives can then print the report using the print feature available within Reporting Services. Now they are ready to go knocking on doors!
For the CEO, you can build KPIs in the web portal along with a report or, perhaps a series of reports, that reflects the state of her company. This will serve to keep her informed on all facets of her business. When she wants to present this information to the corporate vice presidents, she exports a report to a PowerPoint presentation. The best part is that because you already have a SQL Server 2016 license, the Reporting Services solution costs the company nothing. You have earned a number of bonus points with the big boss, and she will make you the chief information officer before the end of the year!
When it comes to sharing information in this day and age, we need to think beyond the printed report. As demonstrated by our earlier user scenarios, data visualizations and analysis can be delivered on a number of platforms. We want to have the right tool for use with each of these platforms. To that end, Microsoft has created a number of reporting and data visualization tools. In fact, as was already noted, there are a number of different tools under the SQL Server reporting umbrella.
To assist us in selecting the right tool for each job, Microsoft has broken down reports into four distinct types:
Paginated reports
Mobile reports
Interactive reports
Analytical reports
Not surprisingly, Microsoft has a tool that specializes in each of these report types:
Paginated reports are those reports that require exact placement and formatting of all elements on the report. These are also the reports that are required to look good when printed. SQL Server Reporting Services facilitates this type of reporting.
Mobile reports are built to be displayed on smartphones and tablets. Although it might be tempting to think we can take paginated reports and just shrink them down or rearrange them to display properly in the smaller footprint of a tablet or phone, Microsoft begs to differ. They believe the most effective mobile reports are built from the ground up with mobile in mind. After working with the SQL Server Mobile Report Publisher, I think you will agree.
Interactive reports are created to allow the user to explore the data. The interactive reporting environment focuses on allowing the user to continuously interact with the data by slicing, filtering, and drilling down. This interactivity is provided at the expense of exact control over layout and format. Although Reporting Services supports filtering and drilldown, it does not focus on these aspects of data interaction in the same way that Power BI does.
Analytical reports are created within what has been the leading tool for data analysis for many years—Microsoft Excel. Pivot tables and pivot charts provide robust reporting right within an Excel spreadsheet.
This book will examine two of the four report types, paginated reports and mobile reports, and the tools used to create them. Paginated reports are created using either the Report Builder or the Report Designer. The Report Builder supports the construction of full-featured Reporting Services reports. It features a user interface similar to that of Microsoft Word 2013 or Microsoft Excel 2013, so it should be familiar for users comfortable with those products. The Report Designer, found in SQL Server Data Tools and Visual Studio, also supports all of the features of Reporting Services. In addition, it provides tools for project organization and source-code management for those reporting projects that have a lifecycle similar to that of a software development project (version control, check-in/check-out, etc.). Mobile reports are created using the SQL Server Mobile Publisher.
This book can help you get the most from the incredibly rich report-authoring features available in Report Builder, the Report Designer, and the Mobile Publisher. These environments contain everything necessary to create a wide variety of reports. Everything you need to select information from data sources, create a report layout, and test your creation is right at your fingertips.
Each Reporting Services paginated report contains two distinct sets of instructions that determine what the report will contain. The first is the data definition. The data definition controls where the data for the report will come from and what information will be selected from that data. The second set of instructions is the report layout. The report layout controls how the information will be presented on the screen or on paper. Both of these sets of instructions are stored using the Report Definition Language (RDL).
Figure 1-1 shows this paginated report structure in a little more detail.
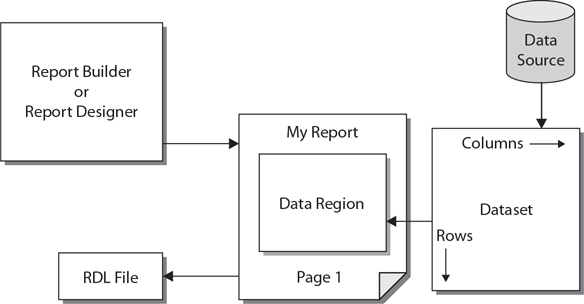
Figure 1-1 Paginated report structure
The data definition for a paginated report contains two parts: the data source and the dataset. The data source is the database server or data file that provides the information for your report. Of course, the data source itself is not included in the report. What is included is the set of instructions the report needs to gain access to that data source. These instructions include the following:
The type of source you will be using for your data (for example, Microsoft SQL Server 2016, Oracle, DB2, or Microsoft Access). Reporting Services will use this information to determine how to communicate with the data source.
The name of the database server or the path to the data file.
The name of the database.
The login for connecting to this data source, if a login is required.
When the report is executing, it uses the data source instructions contained in the report to gain access to the data source. It then extracts information from the data source into a new format that can be used by the report. This new format is called a dataset.
The content of the dataset is defined using a tool called the Query Designer. The Query Designer helps you build a database query. The database query may be in Transact-Structured Query Language (T-SQL) for querying relational data, Multidimensional Expression language (MDX) for querying SQL Server Analysis Services data models, or Data Mining Expression language (DMX) for querying data-mining data. The query provides instructions to the data source, telling it what data you want selected for your report.
The data selected by the query into the dataset consists of rows and columns. The rows correspond to the records the query selects from the data source. The columns correspond to the fields the query selects from the data source. (MDX queries are flattened into a table of rows and columns.) Information on the fields to be selected into the dataset is stored as part of the definition of the dataset. Only the query and the information on what the resulting columns will be called and the type of data they will hold is stored in the definition of the dataset. The actual data is not stored in the definition of the dataset, but instead is selected from the data source when the report is run.
The data that the report has extracted into a dataset is not of much use to you unless you have some way of presenting it to the user. You need to specify which fields go in which locations on the screen or on paper. You also need to add things such as titles, headings, and page numbers. All of this forms the paginated report layout.
In most cases, your report layout will include a special area that interacts with the dataset. This special area is known as a data region. A data region displays all the rows in the dataset by repeating a section of the report layout for each row.
The information in the data definition and the report layout is stored using the Report Definition Language (RDL). RDL is an Extensible Markup Language (XML) standard designed by Microsoft specifically for storing report definitions. This includes the data source instructions, the query information that defines the dataset, and the report layout. When you create a report in the Report Designer, it is saved in a file with an .rdl extension.
If you have not worked with XML, or are not even sure what it is, don’t worry. The Report Designer, Report Builder, and Reporting Services will take care of all the RDL for you. For those of you who want to learn more about RDL, we’ll take a quick peek under the hood in Chapter 8.
Figure 1-2 shows the Report Designer. This is one of the tools you can use for creating and editing reports throughout this book. We will look at some features of the Report Designer now and discuss them in more detail in Chapters 5 through 9.

Figure 1-2 The Report Designer
The design surface, in the center of Figure 1-2, is where you create your report layout. To do this, you use five of the other areas visible in Figure 1-2: the Report Data window, the Toolbox, the Properties window, the Parameter pane, and the Grouping pane. You will learn how these work in the following sections. The design surface shares space with the Preview tab. The Preview tab will show you how the report layout and the data combine to create an honest-to-goodness report.
The Report Data window, along the left side of Figure 1-2, provides a list of database fields and other types of information you can use in your report. The Report Data window makes it easy to add information to your report layout. Simply drag the desired object from the Report Data window and drop it in the appropriate location on your report layout. The Report Designer takes care of the rest.
The Toolbox contains all the report items you use to build your reports. These report items, sometimes called controls, are responsible for getting the text and graphics to show up in the right place on your reports. As with any construction project, you can only construct reports properly after you learn how to use the tools (report items) in the Toolbox. You learn how to use each of the report items in the Toolbox in Chapters 4 through 9.
Just like the objects in the Report Data window, the report items in the Toolbox are placed on the report layout with a simple drag-and-drop. However, whereas fields are pretty much ready to go when they are dropped onto the design surface, report items almost always need some formatting changes to get them just the way you want them. This is done by changing the size, the color, the font, or one of many other characteristics of the report item.
Unlike the layout shown in Figure 1-2, the Toolbox is often hidden on the left side of the screen with only the word “Toolbox” visible along the side of the screen. This is the default configuration for the Report Designer. When in this layout, the Toolbox is displayed by clicking the word “Toolbox.”
The Properties window, shown in the lower-right corner of Figure 1-2, is the place where you control the characteristics of each report item. The Properties window always shows the characteristics, or properties, for the report item currently selected in the design surface. You will see an entry in the Properties window for every aspect of this report item that you can control.
The top of the Properties window shows the name of the selected report item. In Figure 1-2, the text box named “EmployeeNumber” is selected. The left column in the Properties window shows the name of each property that can be changed for that report item. The right column shows the current setting for each of those properties. For example, in Figure 1-2, you can see the EmployeeNumber text box has a Height of 0.25in.
The Parameter pane is at the top of the design surface in Figure 1-2. This pane is used to change the arrangement of the report parameters. This capability is new in SQL Server 2016.
The Grouping pane is at the bottom of the design surface in Figure 1-2. This pane, made up of the Row Groups area and the Column Groups area, is where you control how grouping operates within the report. The advanced row grouping and column grouping that are now possible in a report are what make Reporting Services a powerful tool for creating complex report layouts.
The Report Builder functions similar to the Report Designer. Figure 1-3 shows a report being created using the Report Builder.

Figure 1-3 The Report Builder
The Report Builder uses the ribbon-style user interface found in Microsoft Office 2010 and later. This is the main difference between the Report Designer and the Report Builder. The Report Builder does not have a Toolbox. Instead, the report items are found on the Insert tab of the ribbon. The other tabs on the ribbon provide additional controls for formatting report items placed on the design surface.
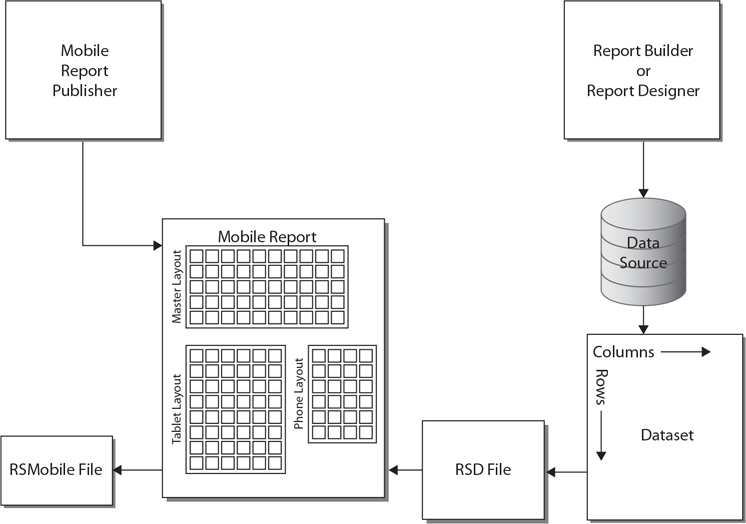
Like paginated reports, mobile reports consist of two distinct parts that determine what the report will contain. In fact, they are the same two parts: the data definition and the report layout. Figure 1-4 shows this mobile report structure in more detail.
Figure 1-4 Mobile report structure
The data definition for a mobile report contains the same two parts, the data source and the dataset, as a paginated report. In fact, the data definition for a mobile report is created using the Report Designer or the Report Builder. The data source is called a shared data source because it can be shared by multiple datasets. It is stored in a Report Data Source (RDS) file.
The dataset is called a shared dataset because it can be shared by multiple mobile reports. It is stored in a Report Shared Dataset (RSD) file. We will see that paginated reports can also make use of shared data sources and shared datasets.
The actual layout of a mobile report specifies how the data in the shared dataset will be presented to the user. The mobile report layout is actually three layouts in one. In a mobile report you will create a master layout, a tablet layout, and a phone layout. The report will use whichever layout is most appropriate to the device displaying the report.
It may sound a bit overwhelming, having to create three layouts for every report. However, you will find as we work on mobile reports in Chapter 10 that the Mobile Report Publisher makes this task quick and easy. You will also see how creating three separate layouts allows us to provide our user with a great data visualization experience no matter what size device they are using.
Mobile report definitions are stored in RSMobile files. These files store the layout information in a proprietary format. Unlike the XML format in the paginated report’s RDL file, this format cannot be viewed without the aid of the Mobile Report Publisher.
Figure 1-5 shows the Mobile Report Publisher. This is the tool you use for creating and editing mobile reports. We will look at some of the features of the Mobile Report Publisher now and discuss them in more detail in Chapter 10.
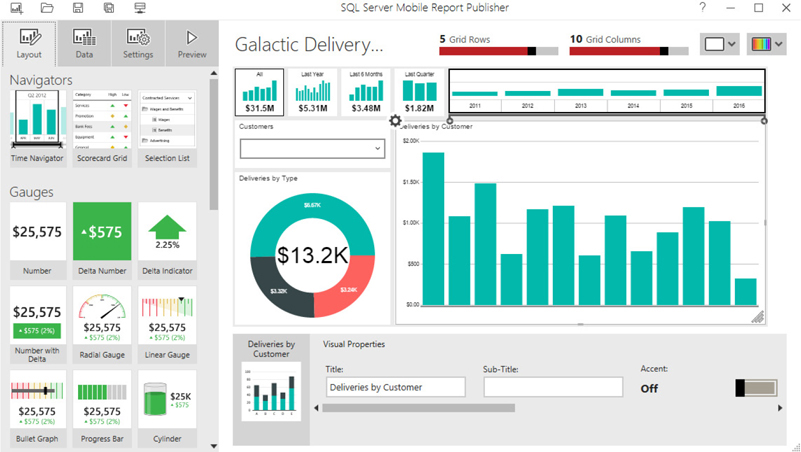
Figure 1-5 The Mobile Report Publisher
The Mobile Report Publisher has four tabs for creating and managing the content of a mobile report.
The Layout tab is used to create the three layouts—master, tablet, and phone—for your report. The Layout tab consists of the following panes:
The Layout Item pane works like the toolbox in the Report Designer and Report Builder. This is where you will find all of the data visualizations and other tools that make up your report layout.
The Layout Grid is similar to the Design Surface in Report Designer and Report Builder. This is where you will create each of the three layouts.
The Visual Properties pane gives you the ability to control some aspects of the appearance and function of the items on the layout.
The Data tab is used to manage the data utilized by the report. When a mobile report is first created, it utilizes a simulated set of data during the initial layout operation. This simulated data allows you to focus on the layout of the report first and then add connections to the actual data once the layout has been created.
When you are ready, the Data tab lets you select one or more datasets for use in your report. Once the datasets are selected, you use the Data tab to link the data to the items that make up the report layout. This is also the place to control how the data is filtered when the user views the report.
The Settings tab is the place to adjust a few of the overall settings for the mobile report. This includes the report title and language. You can also control the way weeks and years are handled within the report.
The Preview tab shows you what the report looks like when the user runs the report. This tab also lets you test the filtering you have created within the report.
Once you finish building your reports, both paginated and mobile, and have them looking exactly the way you want, it is time to share those reports with others. This is the time when your report moves from its safe childhood life inside the Report Designer, Report Builder, or Mobile Report Publisher to its adult life on a report server. This is known as deploying or publishing the report. Let me assure you, reports pass through deployment much easier than you and I passed through adolescence!
The report server is the piece of the puzzle that makes Reporting Services the product it is. This is the software environment that enables you to share your reports with the masses—at least, those masses who have rights to your server. Figure 1-6 shows the basic structure of the report server.

Figure 1-6 Report server architecture
When a report, shared data source, or shared dataset is deployed to a report server, a copy of the object’s definition is put in that server’s Report Catalog. The Report Catalog is a set of databases used to store the definitions for all of the reports and other objects available on a particular report server. It also stores the configuration, security, and caching information necessary for the operation of that report server.
Even though you may use any Open Database Connectivity (ODBC)– or Object Linking and Embedding Database (OLE DB)–compliant data source to supply data to your reports, the Report Catalog database can only exist on an instance of SQL Server. The Report Catalog database is created as part of the Reporting Services installation process. Except for creating regular backups of any Report Catalog databases, it is probably a good idea to leave the Report Catalog alone.
When a report needs to be executed, the report processor component of the report server directs the show. The report processor retrieves the report, along with any required shared data sources and shared datasets, from the Report Catalog and orchestrates the operation of the other components of the report server as the report is produced. It takes the output from each of the other components and combines them to create the completed report.
As the report processor encounters dataset definitions, it retrieves the data to populate that dataset. It does this by first following the instructions in the data source for connecting to the database server or file that contains the data. The report processor selects a data provider that knows how to retrieve information from this type of data source.
The data provider then connects to the source of the data and selects the information required for the report. The data provider returns this information to the report processor, where it is turned into a dataset for use by the report.
Once all the data for the report has been collected, the report processor is ready to begin processing the report’s layout. To do this, the report processor looks at the format requested. This might be HTML, PDF, TIFF, or one of several other possible formats. The report processor then uses the renderer that knows how to produce that format.
The renderer works with the report processor to read through the report layout. The report layout is combined with the dataset, and any repeating sections of the report are duplicated for each row in the dataset. This expanded report layout is then translated into the requested output format. The result is a report ready to be sent to the user.
The request handler is responsible for receiving requests for reports and passing those requests on to the report processor. Once the report processor has created the requested report, the request handler is also responsible for delivering the completed report. In the next section, you will learn about the various methods the request handler uses for delivering reports.
We have discussed how a report is created by the report server. What we have not discussed is where that report is going after it is created. The report may be sent to a user through the web portal. It may be sent in response to a web service request that came not from a user, but from another program. It may also be e-mailed to a user who has a subscription to that report.
One way for users to request a report from the report server is through the Reporting Services web portal. This website is created for you when you install Reporting Services in native mode. Figure 1-7 shows a screen from the web portal.
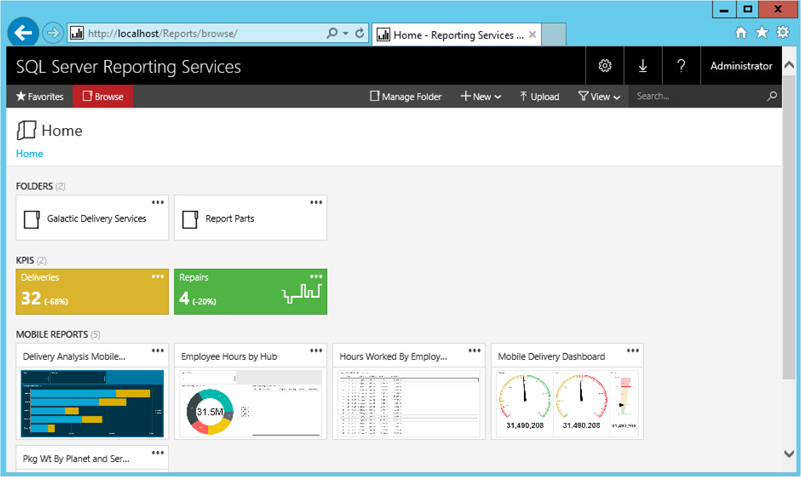
Figure 1-7 The Web Portal
The web portal organizes reports and other content into folders. Users can browse through these folders to find the report they need. They can also search the report titles and descriptions to locate a report.
The web portal also includes security that can be applied to folders and reports. With this security, the site administrator can create security roles for the users who will be accessing the site. These security roles control which folders and reports a user is allowed to access. You will learn about security when we look at the web portal in Chapter 11.
In the web portal, reports are always displayed using the HTML format. Once a report has been displayed as an HTML page, the user can then export the report into any of the other available formats.
The web portal also supports the creation of key performance indicators. These KPIs can present concise snapshots of important information about your organization. The KPIs can be combined to create dashboards right within the web portal.
SharePoint may also be set up to serve as a means for users to request reports. This can be done in two ways. The first uses the Report Explorer and Report Viewer web parts. These web parts can be used in a SharePoint web application to allow users to navigate report folders and to view reports on a Reporting Services report server.
The Report Explorer and Report Viewer web parts were originally made available as part of SQL Server 2000 Reporting Services Service Pack 2. They were part of SQL Server 2005 Reporting Services and SQL Server 2008 Reporting Services as well. The web parts have not been upgraded to take advantage of new features and functionality since SQL Server 2008.
The second means of utilizing Reporting Services through SharePoint involves a tight integration of the two products. In this configuration, a SharePoint 2010 or later installation will actually become the host for the report server’s Report Catalog. In addition, the SharePoint user interface replaces the web portal as the user interface for locating and viewing reports, as well as for managing the report server. Accessing reports through SharePoint integration is as easy and intuitive as accessing any other document on the SharePoint site.
If the users do not want to go to the report, the request handler can send the report to them. In other words, users do not necessarily need to come to the web portal to receive a report. They can have the report delivered to them through a subscription service. The web portal enables users to locate a report on the site and then subscribe to it so it will be delivered to them in the future.
When users subscribe to a report, they provide an e-mail address to which the report will be delivered. The content of the report can either be embedded in the body of the e-mail or be included as an e-mail attachment, depending on the requested format. Users can specify the format for the report at the time they create their subscription.
The site administrator can also set up report subscriptions. These function like a mass mailing, using a list of e-mail addresses. Rather than requiring each user to access the web portal to create their own subscription, the site administrator can create one subscription that is delivered to every user in a list.
In addition to delivering reports to humans, either at their request or on a subscription basis, the request handler can deliver reports to other software applications. This is done through a series of web services. A web service is a mechanism that allows programs to communicate with each other over the Internet.
A program calls a web service on the report server, requesting a particular report in a particular format. The request handler relays this request to the report processor, just like any other request for a report. The completed report is returned as the response to the web service request to the program that originated it.
Web services use a standard called Simple Object Access Protocol (SOAP). SOAP is supported by both Windows and non-Windows environments, so a program running on a non-Windows computer that supports SOAP can receive a report created by Reporting Services.
One example of application interaction are the native mobile apps available for use with Reporting Services. Reports can be retrieved from the server and displayed on our mobile devices using these apps. The apps make use of the web service interface to request reports from the report server.
Now that you have been introduced to all of the capabilities of Reporting Services, I hope you are ready to dive in and make it work for you. In the next chapter, you will learn about the installation and setup of Reporting Services. If Reporting Services has already been installed, you can skip ahead to Chapter 3.
In Chapter 3, we make sure you have a firm understanding of database basics before getting to the actual building of reports in Chapter 4. Chapter 3 also introduces you to Galactic Delivery Services (GDS), the company we use as a case study throughout the remainder of the book. Even if your database skills are tip-top, you should spend a few minutes in Chapter 3 getting to know GDS.
 NOTE
NOTE