Obtaining the Galactic Database
In This Chapter
Obtaining the Galactic Database
Getting Started with the Authoring Environment

If the relational database concepts of Chapter 3 were new to you, you may feel like you have been through a twister and are not in Kansas anymore. You can take heart, however, knowing you have completed the preliminaries and are now ready to start building reports. So, without further ado, strap on your ruby slippers and follow the yellow-brick road, because you are off to see the wizard!
That wizard is, of course, the Report Wizard. Like the ruler of the Emerald City, the Report Wizard is not all-powerful. For example, the Report Wizard will not let you make use of all the features available in Reporting Services. The wizard is, however, a great place to get a feel for the way reports are constructed.
Beginning with this chapter, we will create sample reports using the Galactic database. If you have not done so already, download the sample code from this book’s web page at www.mhprofessional.com. Search for the book’s web page using the ISBN, which is 9781259641503, and then use the “Downloads & Resources” tab to download the zip file containing the book’s material. Follow the instructions in the zip file to install the Galactic database and the other sample code as needed.
In Chapter 1, we talked about the two different report-authoring environments available for Reporting Services—the Report Designer and the Report Builder. Both environments provide access to all of the features of Reporting Services. The exercises in this book can be completed with either the Report Designer, found in SQL Server Data Tools (SSDT) and Visual Studio (VS), or the Report Builder, which is its own stand-alone application. You can choose whichever environment you are most comfortable with. You may wish to try a few of the exercises using SSDT or VS and a few of the exercises using Report Builder to decide which works best for you.
Report Builder approaches report authoring similar to the way you would author a document in Word or Excel. SSDT and Visual Studio approach report authoring more like software development. (In fact, SSDT is a special version of the Visual Studio development environment operating under a different name.)
When using Report Builder, it is up to you to save your reports in an organized manner. You must create folders, either on the Report Server or in the file system, that will group your reports in a meaningful manner. When using SSDT or Visual Studio, multiple reports are grouped together for you inside a project.
SQL Server Data Tools and Visual Studio can be used for a number of business intelligence and software development tasks. SQL Server Data Tools-BI is used to create Integration Services packages for data extract, transform, and load (ETL). It also is used to create Analysis Services BI Semantic Models. Visual Studio is used to create Windows applications, web applications, and web services.
To facilitate this variety of capabilities, these development environments support many different types of projects. These project types organize the multitude of solutions that can be created within the development environment into related groups. Reporting Services reports are created using the Business Intelligence | Reporting Services project template.
When you choose to create a new project in SSDT or in Visual Studio, you will see the New Project dialog box shown in Figure 4-1. The Installed Templates area of the screen shows the group of project templates you will be concerned with: Business Intelligence. The Business Intelligence group includes templates for a number of different projects.
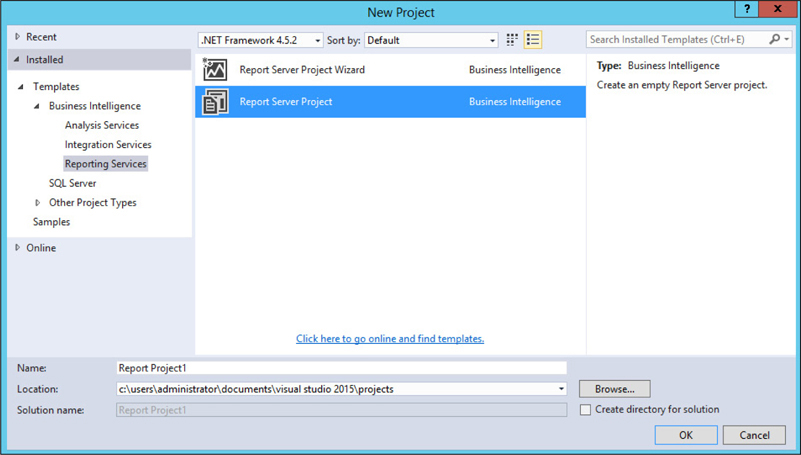
Figure 4-1 The New Project dialog box
If you are using Visual Studio, you may see other groupings of project templates in addition to Business Intelligence for other types of software development.
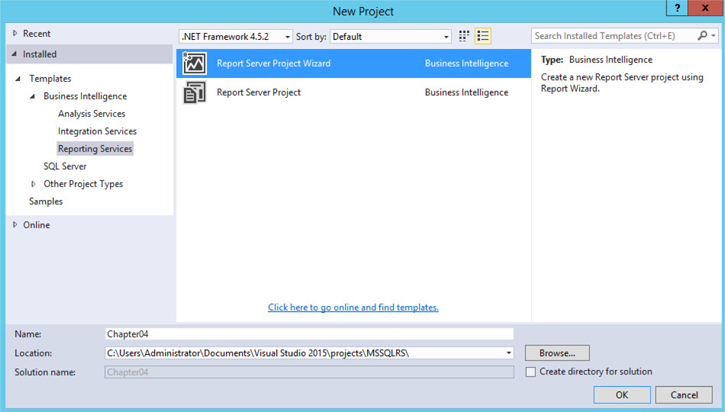
You will look at two project templates in this book: Report Server Project Wizard and Report Server Project. Either one will ultimately create a report project. The Report Server Project Wizard template uses the Report Wizard to guide you through the process of creating the first report in your new report project. The Report Server Project template simply creates an empty report project and turns you loose.
The Report Builder is available as a free download from Microsoft. The easiest way to download Report Builder is to use the download link in the web portal. To do this, open a browser and navigate to the web portal. By default, the URL for the web portal is:

or

where {servername} is the name of the server where you installed Reporting Services. If the web portal is not installed in the default location, look at the web portal URL page of the Reporting Services Configuration Manager (see Chapter 2) to determine the appropriate URL.
 NOTE
NOTE
It takes a minute or so for the web portal to load the first time it is accessed after a PC reboot. Be patient.
Once the web portal Home page is displayed in the browser, you can click the Download button (the down arrow at the top of the screen) and select Report Builder from the drop-down menu that appears. This will take you to the appropriate page on the Microsoft website to download the Report Builder application. Follow the instructions on the web page to complete the download.
Once you have downloaded the Report Builder, you can launch it from the Windows Start menu/Start screen or you can launch it from the web portal. To launch the Report Builder from the web portal, click New | Paginated Report from the web portal toolbar, as shown in Figure 4-2.
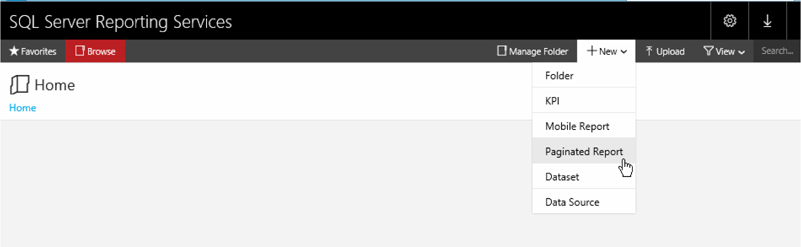
Figure 4-2 Launching the Report Builder from the web portal
Once you have installed the Galactic database, you are ready to build your first Reporting Services report. Of course, few people build reports just for the fun of it. Usually, there is some business reason for this endeavor. In this book, as stated in the previous chapter, we use the business needs of Galactic Delivery Services (GDS) as the basis for our sample reports.
Each of the sample reports used in this book is presented in a manner similar to what you see in this section. The report is introduced with a list of the Reporting Services features it highlights. This is followed by the business need of our sample company, Galactic Delivery Services, which this report is meant to fill. Next is an overview of the tasks that must be accomplished to create the report.
Finally, there are the steps to walk through for each task. In addition to the step-by-step description, each task includes a few notes to provide additional information on the steps you just completed. Follow the step-by-step instructions to complete the task, and then read through the task notes to gain additional understanding of the process you have just completed. You can complete the step-by-step instructions using SSDT, Visual Studio, or the Report Builder.

Some tasks have one set of instructions for SSDT and Visual Studio and another set of instructions for Report Builder. Other tasks have the same set of steps for all environments. The SSDT and Visual Studio instructions are marked with the “DT” icon. The Report Builder instructions are marked with the “RB” icon. When the same set of instructions apply to both environments, both icons will be present. Be sure to follow only those sets of steps that apply to your report authoring environment.
Here is our first attempt at creating a report: the Customer List Report.
Creating a data source
Using the Query Designer to create a dataset
Using the Report Wizard to create a table report
Business Need The accounting department at Galactic Delivery Services would like an e-mail directory containing all the billing contacts for its customers. The directory should be an alphabetical list of all GDS customers. It must include the customer name, along with a billing contact and a billing e-mail address for each customer.
1. Begin a New Project in the SSDT or Visual Studio, or Preparing to Create a New Report in the Report Builder
2. Create a Data Source
3. Create a Dataset
4. Choose the Report Layout
 SSDT and Visual Studio Steps
If you are using SSDT or Visual Studio, follow these steps. If you are using the Report Builder, skip ahead to the Report Builder instructions indicated by the “RB” in the left margin.
1. Run SSDT or Visual Studio. Depending on your configuration, you may see the Start page, as shown next.
NOTE
The first illustration shows the default configuration of SSDT. Your screen may vary if this configuration has been changed.
2. Click the New Project toolbar button to create a new project. This displays the New Project dialog box, as shown in the following illustration. (You can create a new project in three different ways: Select File | New | Project from the Main menu; click the New Project toolbar button; or click the New: Project link on the Start page.)
3. Expand Business Intelligence and select Reporting Services in the Installed | Templates area of the dialog box.
4. Select Report Server Project Wizard in the center area of the dialog box.
5. Type Chapter04 for the project name. This project will contain all the reports you create in this chapter using SSDT or Visual Studio.
6. Click Browse to open the Project Location dialog box.
7. The dialog box should default to the Documents/Visual Studio 2015/Projects folder. If it does not, navigate to this folder.
8. Click the New Folder button.
9. Enter MSSQLRS for the name of the new folder. This folder will contain all the projects you create for this book. Press ENTER.
10. Click Select Folder in the Project Location dialog box.
11. Make sure the Create directory for solution check box is unchecked. The New Project dialog box should now look like the second illustration.
Task Notes for SSDT and Visual Studio We have now established a name and location for this project. This must be done for every project you create. Because SSDT and Visual Studio use the project name to create a folder for all the project files, the project name must be a valid Windows folder name. You can use the Browse button to browse to the appropriate location, as we did here, or you can type the path in the Location text box.
NOTE
Valid folder names can contain any character, except the following:
/ ? : & \ * “ < > | # %
In addition, a folder cannot be named “.” or “...”.
The project name is appended to the end of the location path to create the full path for the folder that will contain the new project. In our example, a folder called Chapter04 will be created inside the folder MSSQLRS. All the files created as part of the Chapter04 project will be placed in this folder.
 Report Builder Steps
If you are using the Report Builder, follow these steps.
1. Open a browser and navigate to the web portal as discussed earlier in this chapter.
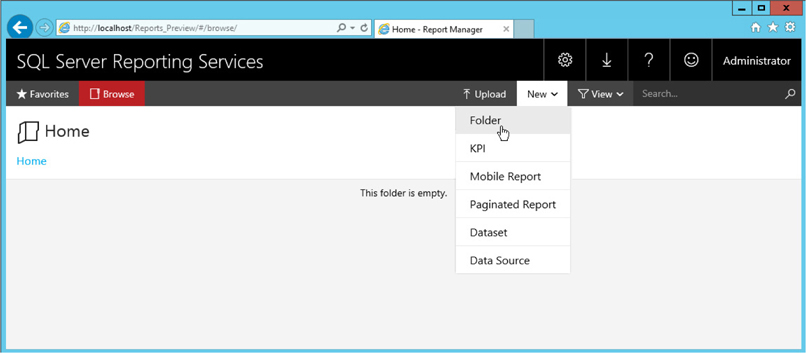
2. Click the New item in the menu bar and select Folder as shown next.
The look of and controls on some of the upcoming screens will be slightly different if you are running Windows 10.
3. The New Folder dialog box appears. Type Galactic Delivery Services for the Name. The New Folder dialog box will appear as shown.
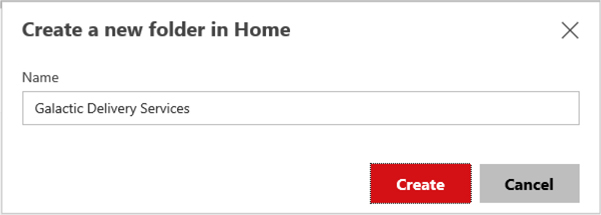
4. Click Create.
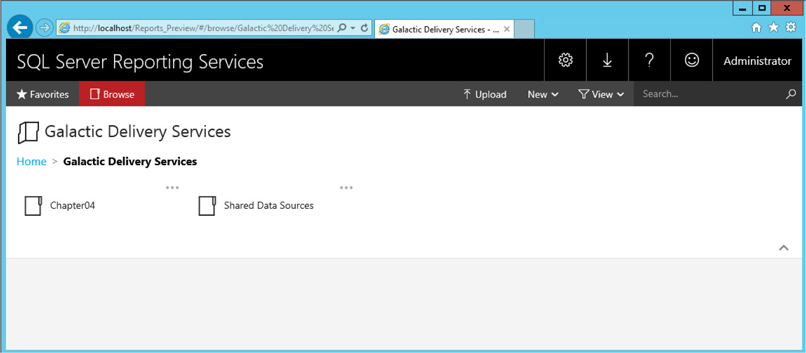
5. Click the entry for the Galactic Delivery Services folder to navigate to that folder.
6. Click the New menu item and select Folder as we did before.
7. Type Shared Data Sources and click Create.
8. Click the New menu item and select Folder once more.
9. Type Chapter04 and click Create. The Galactic Delivery Services folder appears as shown here.
Task Notes for Report Builder When using Report Builder for these exercises, we are going to save the resulting reports right on the report server. It is possible to save Report Builder reports directly to the file system. However, working with the report server and the web portal user interface on that report server allows us to work with a shared data source, which is a Reporting Services best practice.
If you do not have access to a report server, you can still create and save reports using Report Builder. You will first need to install Report Builder as its own application, rather than launching it from the web portal. You can then launch Report Builder from your PC and save your reports in the file system. You will also have to create a data source in each report rather than using a shared data source.
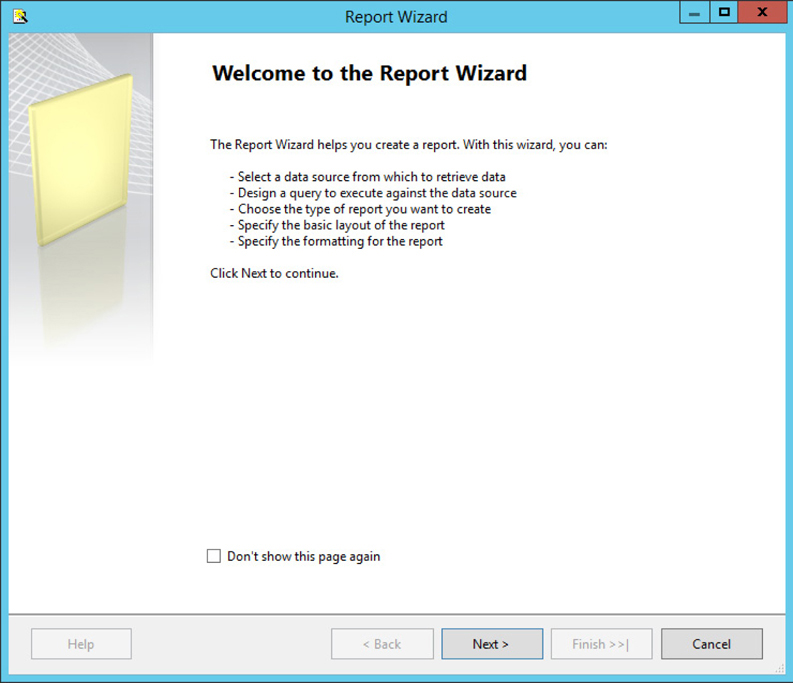
SSDT and Visual Studio Steps1. Click OK in the New Project dialog box to start the Report Wizard. The Welcome to the Report Wizard page appears, as shown next.
2. Click Next. The Select the Data Source page appears.
3. Replace “DataSource1” with Galactic for the Name.
4. Select Microsoft SQL Server from the Type drop-down list, if it is not already selected.
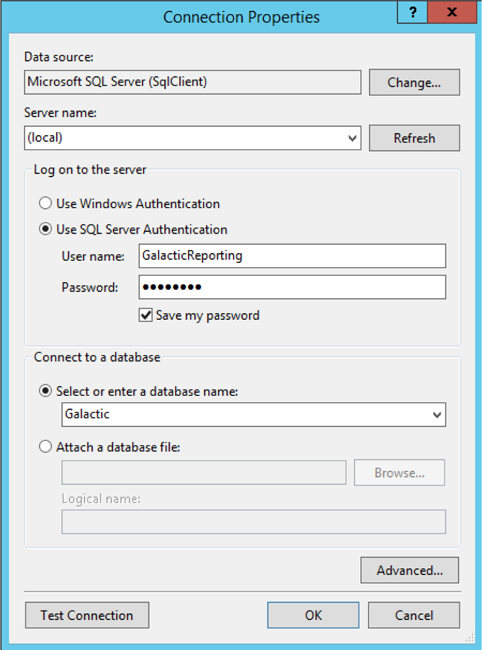
5. Click Edit. The Connection Properties dialog box appears.
6. Type the name of the Microsoft SQL Server database server instance that is hosting the Galactic database. If the Galactic database is hosted by the default instance of SQL Server on the computer you are currently working on, you may type (local) for the server name.
7. Click the Use SQL Server Authentication radio button.
8. Type GalacticReporting for the User name.
9. Type G@l@ct1c for the Password. (The third character of the password is a lowercase l. The seventh character of the password is the number 1.)
10. Check the Save my password check box.
11. Select Galactic from the Select or enter a database name drop-down list. The Connection Properties dialog box should now look like what is shown here.
12. Click the Test Connection button. If the message “Test connection succeeded” appears, click OK and continue with Step 13. If an error message appears, click OK to close the error message dialog box and make sure the name of your database server, the user name, the password, and the name of your database were entered properly. If your test connection still does not succeed, make sure you have correctly installed the Galactic database.
13. Click OK to return to the Select the Data Source page of the Report Wizard.
14. Check the Make this a shared data source check box. This page should now look like what is shown here.
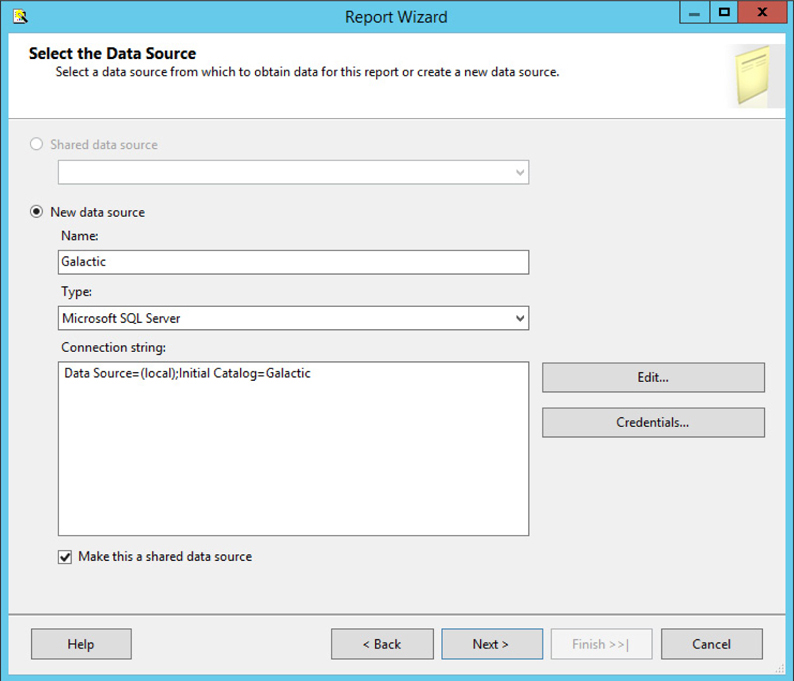
Task Notes for SSDT and Visual Studio As discussed in Chapter 1, the data source is a set of instructions for connecting to the database server or the data file that will provide the information for your report. This set of instructions is also known as a connection string. In this sample report, we used the Connection Properties dialog box to build the connection string.
If you are manually entering a connection string, do not include the login and password information. The connection string is stored as plain text in the report definition file, so a password stored as part of the connection string is easy to discover. Instead, use the Credentials button on the Select the Data Source page to enter the login and password so they are stored in a more secure fashion.
Reporting Services can utilize data from a number of different databases and data files, but you need to tell the wizard what type of database or data file the report will be using. You did this using the Type drop-down list in Step 4 of the previous task. This selection tells Reporting Services which data provider to use when accessing the database or data file. When you select Microsoft SQL Server, Reporting Services uses the .NET Framework Data Provider for SQL Server. This data provider knows how to retrieve information from a SQL Server database.
The Type drop-down list on the Select the Data Source page includes only a few of the possible types of data sources. If you are using data from a data source other than a Microsoft SQL Server database, you need to click the Change button on the Connection Properties dialog box. This displays the Change Data Source dialog box shown in the following illustration.
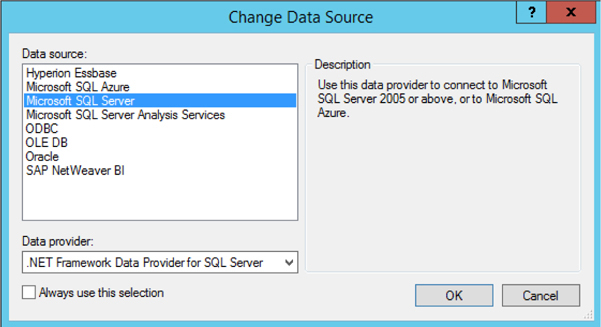
Use this dialog box to select the appropriate data source type.
Each data provider requires slightly different bits of information to create the connection string. The Connection Properties dialog box changes to suit the selected data provider. This means Steps 6 through 11 will vary when you use a data source type other than Microsoft SQL Server. Simply provide the information requested in the Connection Properties dialog box. Be sure to use the Test Connection button to make sure everything is entered properly before leaving the Connection Properties dialog box.
Checking the Save My Password check box on the Connection Properties page allows the data source credentials to be saved with the data source definition. The data source credentials are the user name and password information required to access that data source. The credentials are encrypted before they are saved to help protect them. If you are not comfortable having the credentials stored in this manner, leave both the user name and password fields blank. You will be prompted for the credentials every time you execute the report or modify the dataset. In either case, if the connection to the data source does not use Secure Sockets Layer (SSL) protocol, the credentials will be transmitted as clear text. To avoid this, use integrated security.
NOTE
If you leave the data source credentials blank and your selected data source requires a login, you will be prompted for database credentials when you click Next on the Select the Data Source page. The credentials you enter here are used to create a connection to the data source for the Design the Query page and for the Query Designer. These credentials are not stored with the data source.
A data source can be used by a single report, or it can be shared by several reports in the same project or on the same report server. Checking the Make this a shared data source check box allows this data source to be used by many reports. Shared data sources are stored separately from the reports that use them. Nonshared, or embedded, data sources are stored right in the report definition. If you have a number of reports in the same project that utilize data from the same database or the same data files, you will save time by using a shared data source.
CAUTION
Even though the data source credentials are encrypted, it is never a good idea to use the system administrator account or any other database login with system administrator privileges to access data for reporting. Always create a database login that has only the privileges required for reporting operations, and use this login as the reporting credentials.
Some companies require that reports use data from a development database server while they are being developed and a production database server when the reports are completed. Using a shared data source in this type of an environment makes it easier to switch a number of reports from the development database server to the production database server. The change is made once to the shared data source, and all the reports are ready to go.
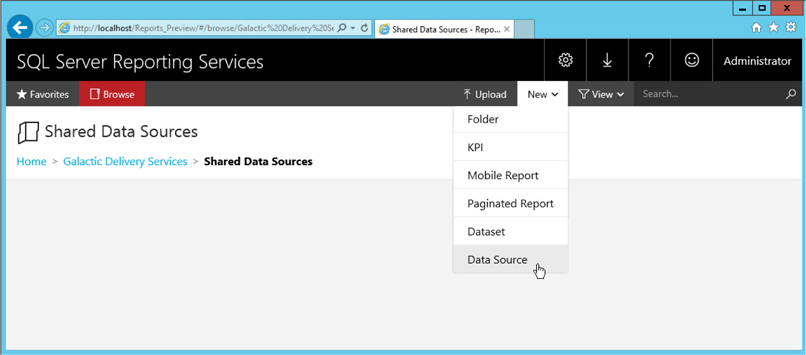
Report Builder Steps1. In the web portal, click the Shared Data Sources folder to navigate to that folder.
2. Click the New item in the menu bar and select Data Source as shown here.
3. The New Data Source page appears. In the Name area, enter Galactic as the data source name.
4. Select Microsoft SQL Server from the Type drop-down list in the Connection section, if it is not already selected.
5. Type the following for the Connection string:

where {servername} is the name of the Microsoft SQL Server database server instance that is hosting the Galactic database. If the Galactic database is hosted by the default instance of SQL Server on the computer you are currently working on, you may use (local) for the server name.
6. Click the Using these credentials radio button.
7. Select Database user name and password from the Type of credentials drop-down list.
8. Type GalacticReporting for the User name.
9. Type G@l@ct1c for the Password. (The third character of the password is a lowercase l. The seventh character of the password is the number 1.)
10. Click the Test Connection button. If the message “Connected successfully” appears near the bottom of the page, continue with Step 11. If an error message appears near the bottom of the page, make sure the connection string (including the correct database server name), the user name, and the password were entered properly. If your test connection still does not succeed, make sure you have correctly installed the Galactic database. When correct, the New Data Source page appears as shown.
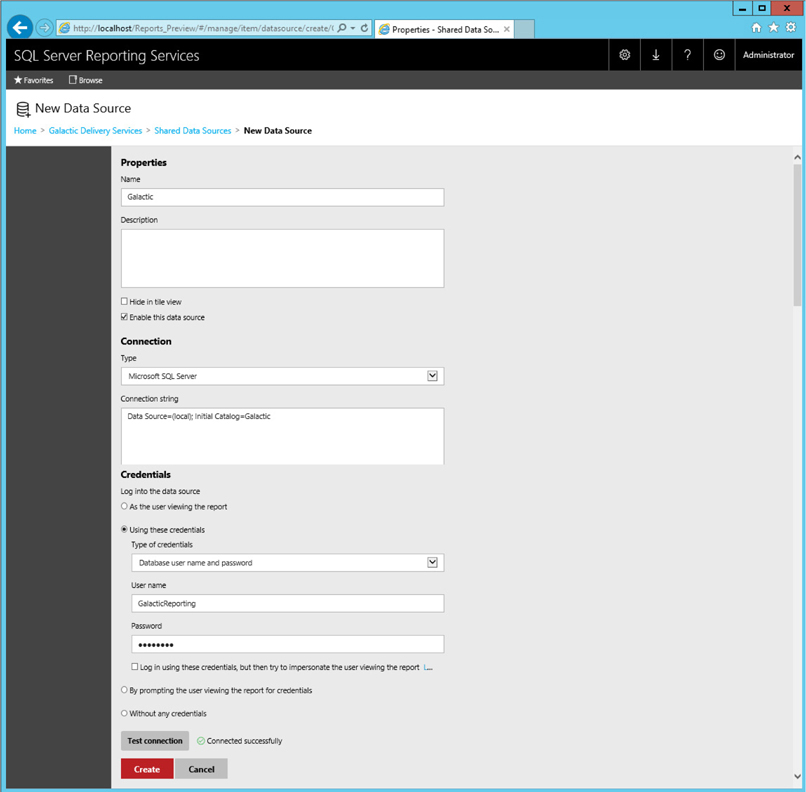
11. Click Create to create the data source.
12. Click the Galactic Delivery Services link in the breadcrumb trail on the left near the top of the page. This returns you to the Galactic Delivery Services folder.
13. Click the New item in the menu bar and select Paginated Report. (If you receive a dialog box as Report Builder starts up, click Run or Allow or Yes.) The Getting Started page appears, as shown here.
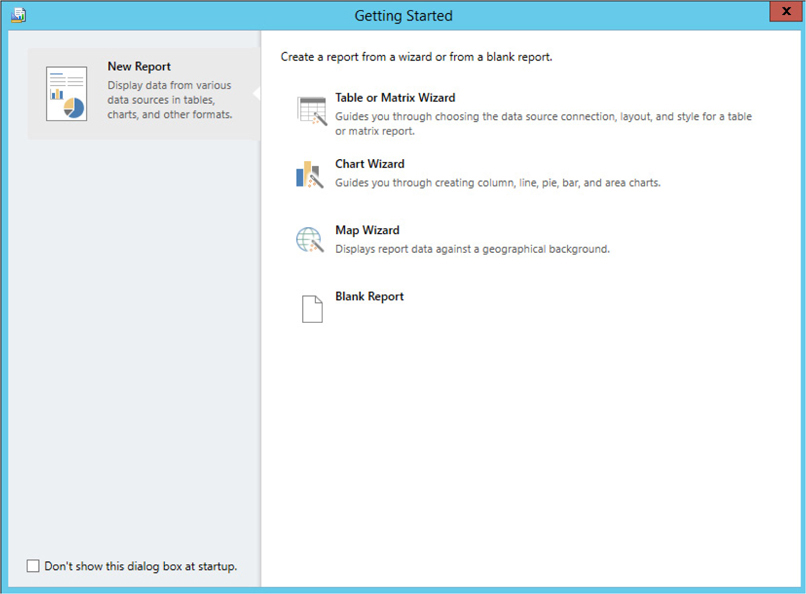
14. With New Report highlighted in the left column, click Table or Matrix Wizard. The Choose a dataset page of the New Table or Matrix Wizard appears.
15. Ensure the Create a dataset radio button is selected. Click Next. The Choose a connection to a data source page of the New Table or Matrix Wizard appears.
16. Click Browse. The Select Data Source dialog box appears.
17. Double-click the Galactic Delivery Services folder, and then double-click the Shared Data Sources folder. The Select Data Source dialog box appears as shown.
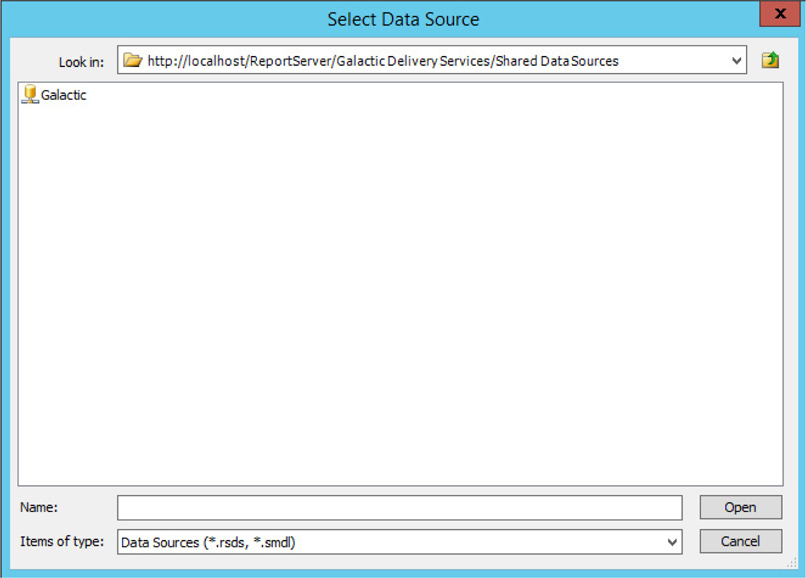
18. Double-click the Galactic shared data source to select it. This is the shared data source that you just created. The Choose a connection to a data source page of the New Table or Matrix Wizard will now appear as shown here.
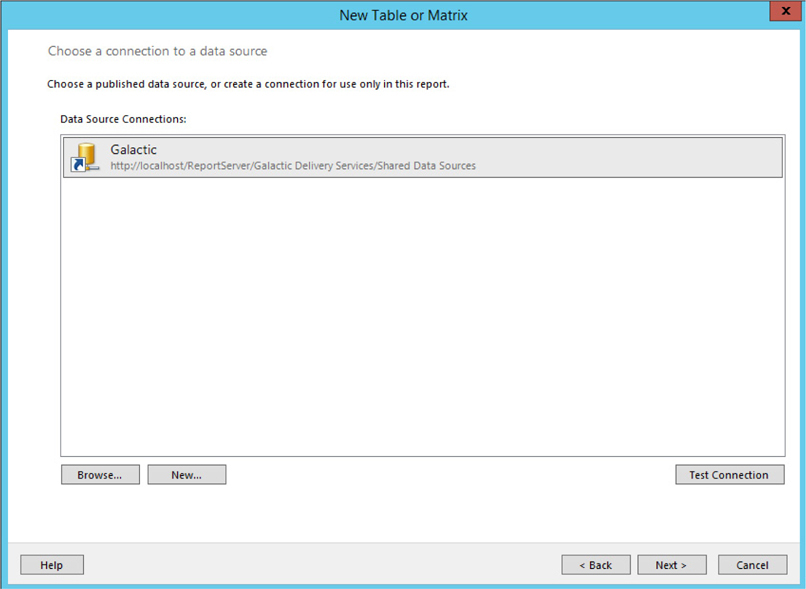
19. Click Next. The Enter Data Source Credentials dialog box will open.
20. Enter G@l@ct1c for the Password. (The third character of the password is a lowercase l. The seventh character of the password is the number 1.)
21. Check the Save password with connection check box. The Enter Data Source Credentials dialog box will appear as shown.
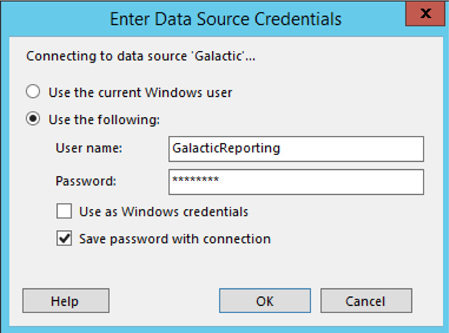
22. Click OK to exit the Enter Data Source Credentials dialog box. You will be taken to the Design a query page of the New Table or Matrix Wizard.
Task Notes for Report Builder As discussed in Chapter 1, the data source is a set of instructions for connecting to the database server or the data file that will provide the information for your report. This set of instructions is also known as a connection string. In this sample report, we had to enter the connection string on the New Data Source page in the web portal. Fortunately, we only need to provide the two items, Data Source (server name) and Initial Catalog (database).
CAUTION
When you are manually entering a connection string, do not include the login and password information. The connection string is stored as plain text in the report definition file, so a password stored as part of the connection string is easy to discover. Instead, use the Credentials area of the New Data Source page to enter the login and password so they are stored in a more secure fashion.
Reporting Services can utilize data from a number of different databases and data files, but you need to tell the wizard what type of database or data file the report will be using. You did this using the Type drop-down list in the Connection section of the page in Step 4. This selection tells Reporting Services which data provider to use when accessing the database or data file. When you select Microsoft SQL Server, Reporting Services uses the .NET Framework Data Provider for SQL Server. This data provider knows how to retrieve information from a SQL Server database.
Each data provider requires slightly different bits of information to make a connection. That means the connection string will vary for different data providers. Connection string information for other data providers is beyond the scope of this book. That information can be found on the Internet.
The information entered in the Credentials area is known as the data source credentials. The data source credentials are the user name and password information required to access that data source. The credentials are encrypted before they are saved to help protect them. If you are not comfortable having the credentials stored in this manner, leave both the user name and password fields blank. You will be prompted for the credentials every time you execute the report or modify the dataset.
A data source can be used by a single report, or it can be shared by several reports on the same report server. Shared data sources are stored separately from the reports that use them. Nonshared, or embedded, data sources are stored right in the report definition. If you have a number of reports in the same project that utilize data from the same database or the same data files, you will save time by using a shared data source.
Although the New Table or Matrix Wizard in Report Builder can utilize a shared data source, it cannot, unfortunately, create a shared data source. That was why we manually created the shared data source in the web portal before we started to create our first report in the Report Builder.
CAUTION
Even though the data source credentials are encrypted, it is never a good idea to use the system administrator account or any other database login with system administrator privileges to access data for reporting. Always create a database login that has only the privileges required for reporting operations, and use this login as the reporting credentials.
Some companies require that reports use data from a development database server while they are being developed and a production database server when the reports are completed. Using a shared data source in this type of an environment makes it easier to switch a number of reports from the development database server to the production database server. The change is made once to the shared data source, and all the reports are ready to go.
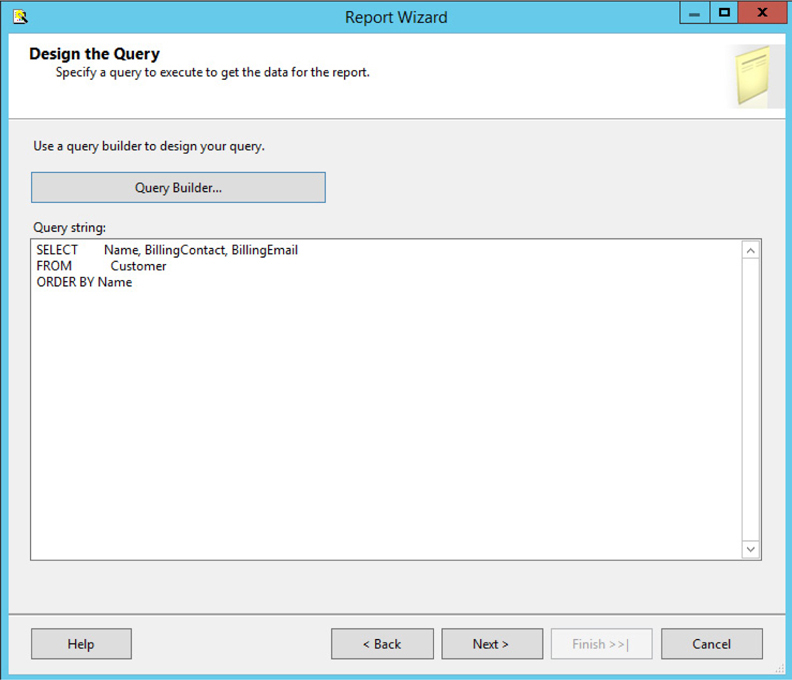
SSDT and Visual Studio Steps1. Click Next. The Design the Query page of the Report Wizard appears.
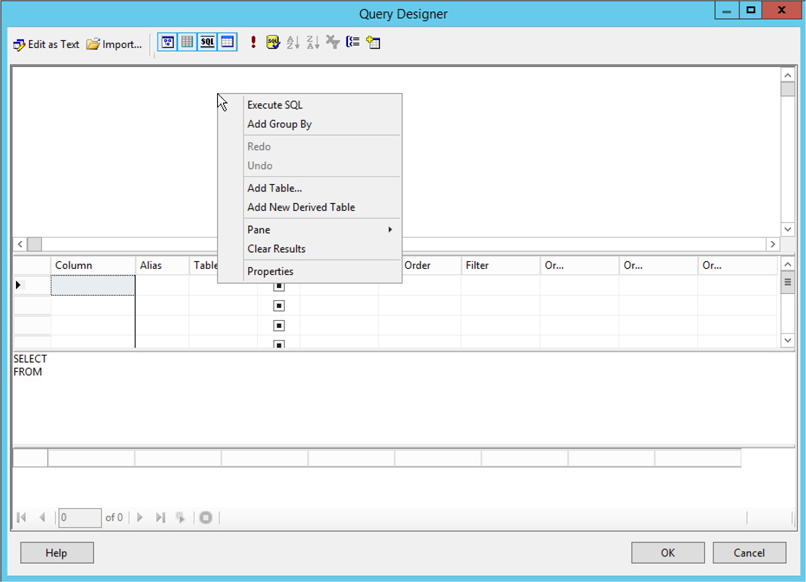
2. Click Query Builder. The Query Designer window opens with the Graphical Query Designer active.
3. The Graphical Query Designer is divided into four horizontal sections. The top section is called the diagram pane. Right-click in the diagram pane. You see the context menu, as shown here.
4. Select Add Table from the context menu. This displays the Add Table dialog box shown here. This dialog box contains a list of all the tables, views, and functions that return datasets, which are found in the data source.
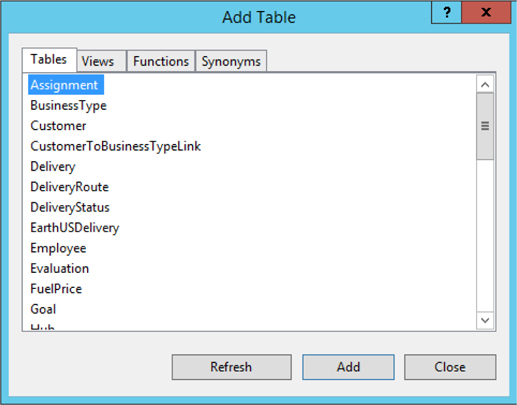
5. Double-click Customer in the list of tables. The Customer table is added to the query.
6. Click Close to exit the Add Table dialog box.
7. A list of the fields in the Customer table is displayed. Check the check box next to the Name field.
8. Scroll down the list of fields, and check the BillingContact and BillingEmail fields as well.
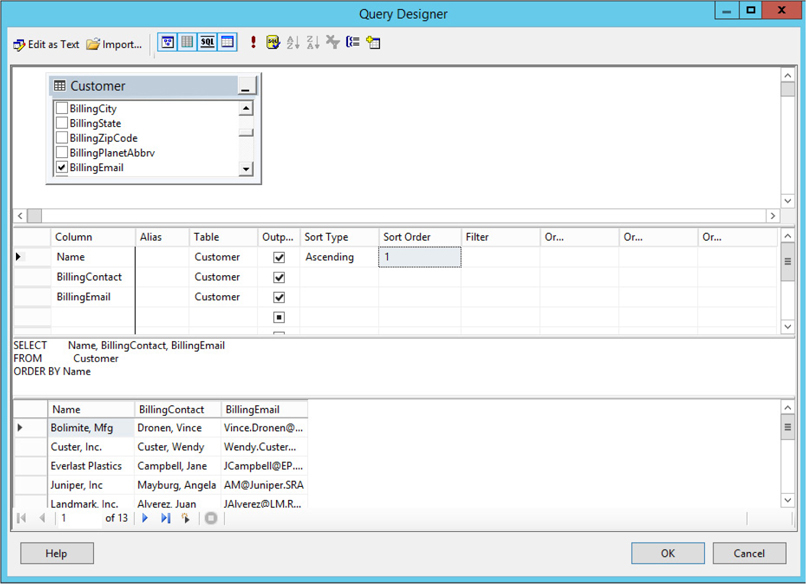
9. The section of the Query Designer directly below the diagram pane is called the criteria pane. In the criteria pane, type 1 in the Sort Order column across from the Name field. Or, you can click in the Sort Order column across from the Name field and select 1 from the drop-down list.
10. The section of the Query Designer directly below the criteria pane is the SQL pane. Right-click in the SQL pane. You see the context menu shown here.
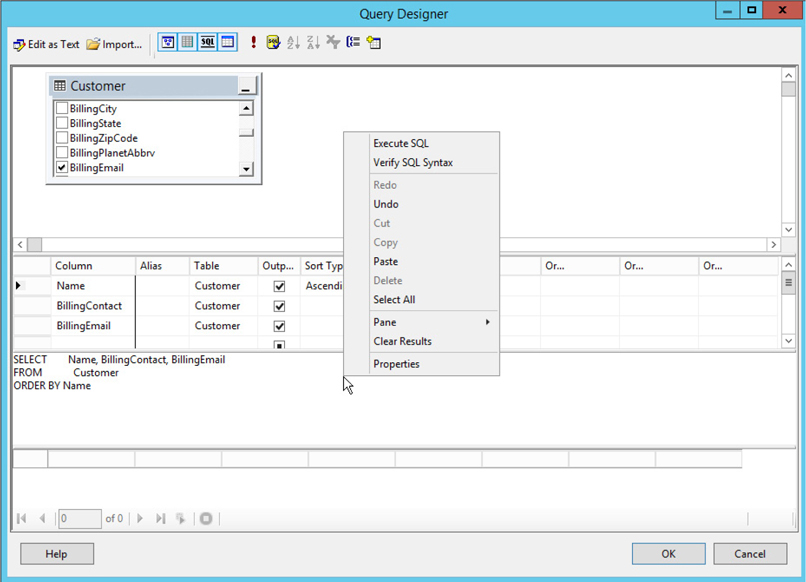
11. Select Execute SQL from the context menu. This runs the query and displays the results in the bottom section of the Query Designer. This bottom section is called the results pane. The Query Designer should now look like the illustration shown here.
12. Click OK to return to the Design the Query page of the Report Wizard. This page should now look like the following illustration. Be sure to read the Task Notes for this task found after the Report Builder steps.
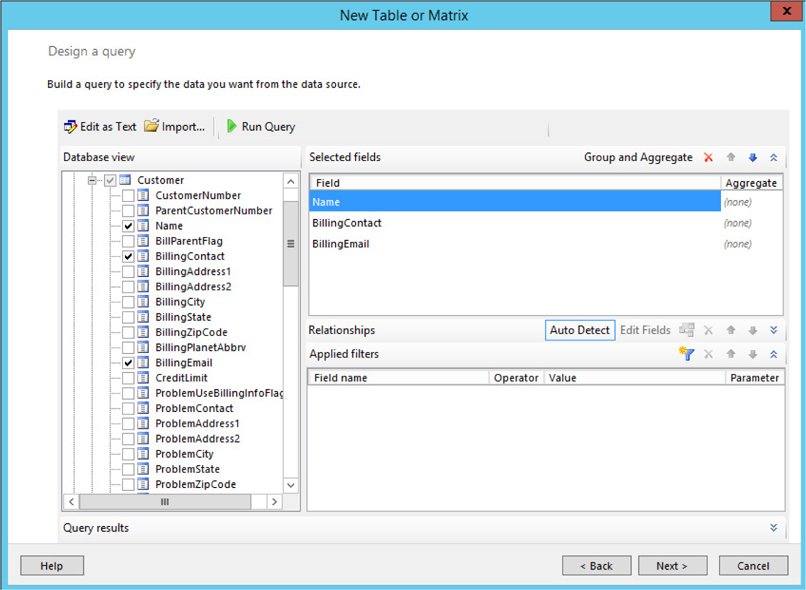
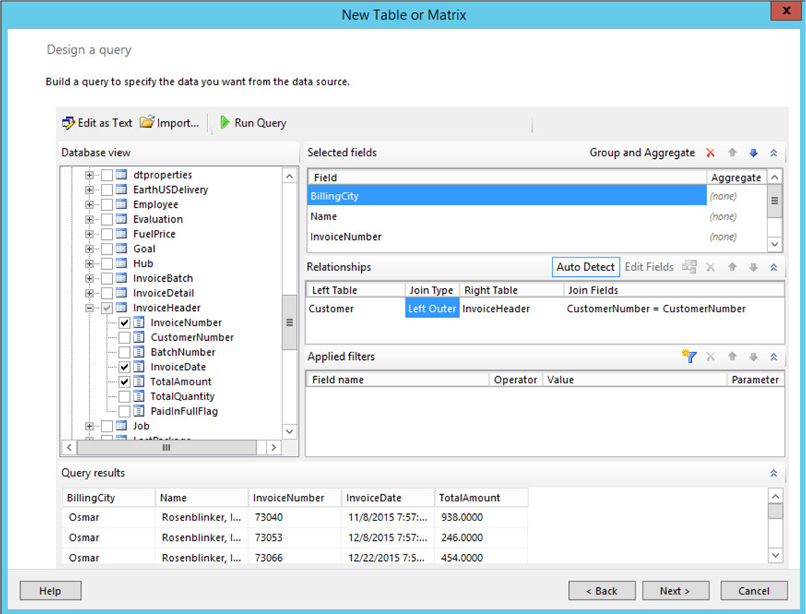
Report Builder Steps1. We left off at the Design a query page of the New Table or Matrix Wizard. This page holds the Graphical Query Designer. The Graphical Query Designer is divided into several panes. The left side is the Database view pane. In the Database view pane, expand the Tables folder.
2. Expand the entry for the Customer table.
3. Check the boxes next to the following fields in the Customer table:
Name
BillingContact
BillingEmail
The selected fields appear in the Selected fields pane. The Design a query page of the New Table or Matrix Wizard should appear as shown here.
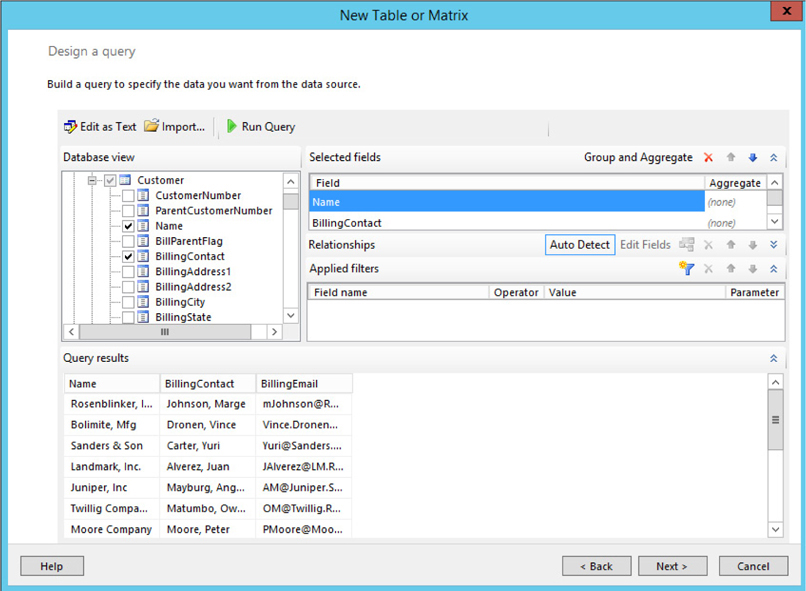
4. Click Run Query from the toolbar. This runs the query and displays the results in the bottom section. This bottom section is called the Query results pane. The page should now appear similar to the following illustration.
Task Notes The dataset represents the information to be retrieved from the data source and used in your report. The dataset consists of two parts. The first part is the database command used to retrieve data. This is the SELECT statement you created using the Query Designer. (If you are using Report Builder, the SELECT statement is created behind the scenes. It is not visible in the Query Designer.) This database command is called the query string.
The second part is the list of the columns in the result set created by executing the query string. This list of columns is called the structure or schema of the result set. The Query Designer determines the field list by executing the query string in a special manner so it returns the structure of the result set, but it does not return any rows in the result set.
When using the Query Designer with SQL Server Data Tools/Visual Studio, those of you familiar with your data source and also familiar with the SELECT statement can type your SELECT statement in the Query String text box on the Design the Query page. This is especially appropriate when you are executing a stored procedure to retrieve data rather than using a SELECT statement. A stored procedure is a program saved inside the database itself that can be used to modify or retrieve data. Using stored procedures in a query string is discussed more in Chapter 8.
It is a good idea to run the query yourself before exiting the Query Designer. We did this in Steps 10 and 11 of the SSDT/Visual Studio steps for this task and in Step 4 of the Report Builder steps for this task. Running the query ensures no errors exist in the SQL statement the Query Designer created for you. It also lets you look at the result set so you can make sure you are getting the information you expected.
SSDT and Visual Studio Steps1. Click Next. The Select the Report Type page of the Report Wizard appears.
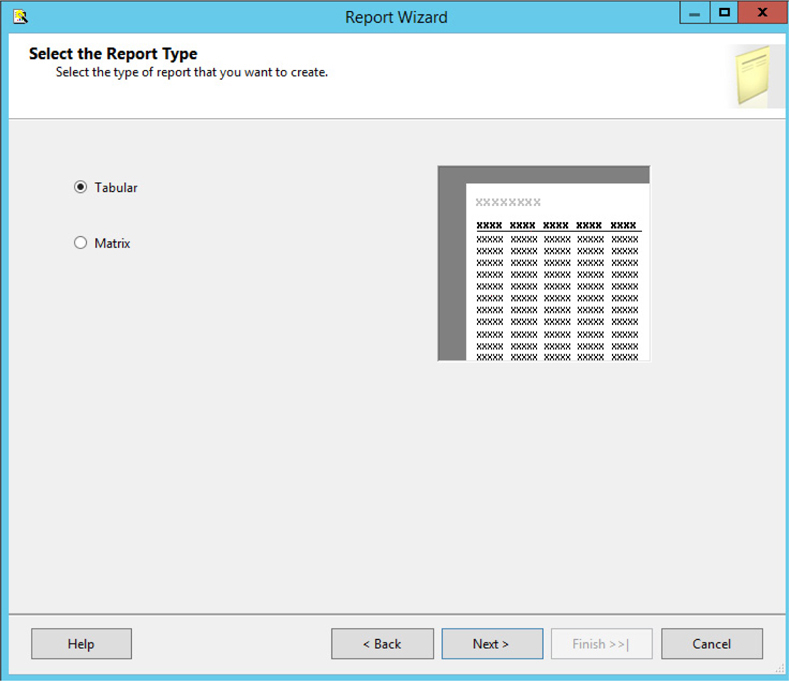
2. Make sure the Tabular radio button is selected, and click Next. The Design the Table page of the Report Wizard appears.
3. With the Name field highlighted in the Available fields list, click Details. The Name field moves to the Displayed fields list.
4. Do the same thing with the BillingContact and BillingEmail fields. The Design the Table page should now look like the following illustration.

5. Click Next. The Completing the Wizard page appears.
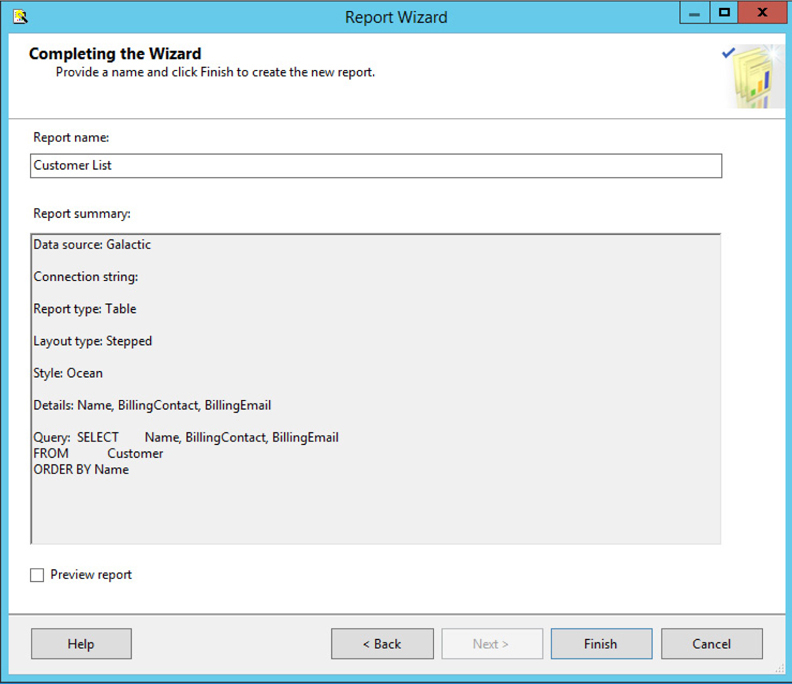
6. Type Customer List for the report name.
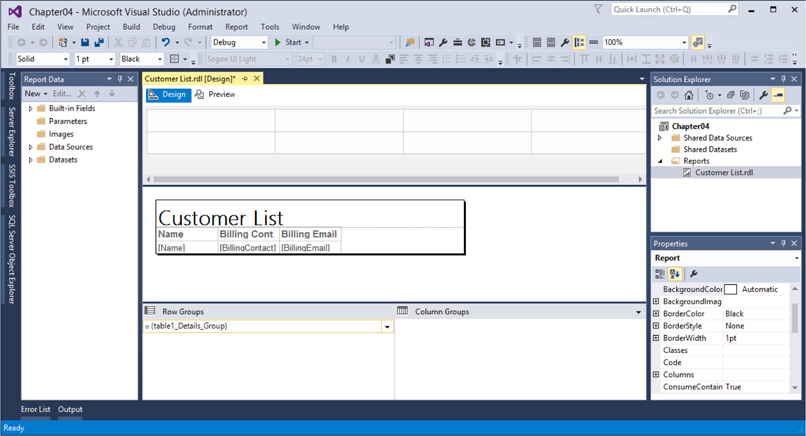
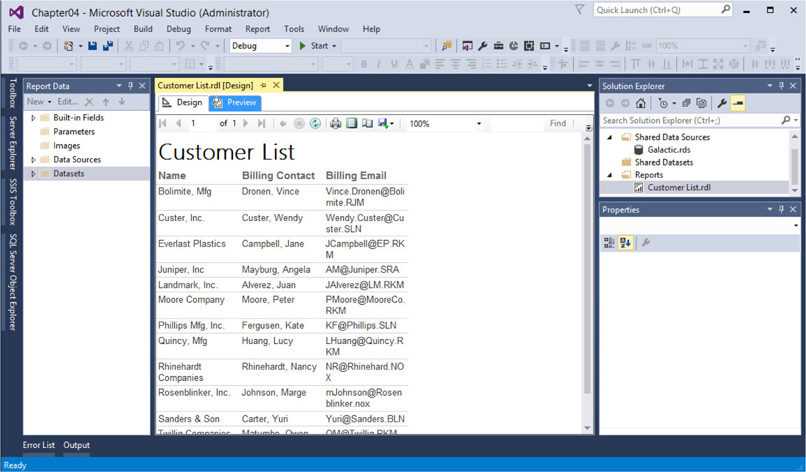
7. Click Finish. The SQL Server Data Tools or Visual Studio window appears with the Report Designer active.
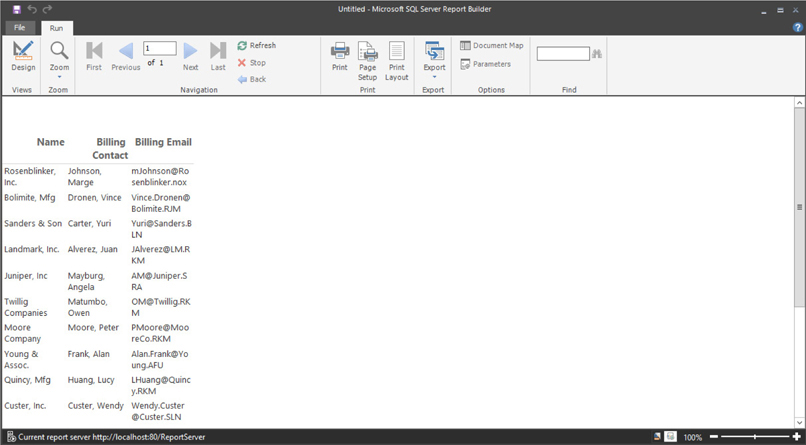
8. Click the Preview tab located just above the report layout. A preview of your report appears.
10. The Report Wizard created columns in our report that seem a bit too narrow. We can improve the report by widening the columns. Click the Name heading (“Name” in a cell without square brackets around it).
11. Place your mouse pointer on the line separating the gray box above the Name heading and the gray box above the Billing Contact heading. Your mouse pointer changes to a double-headed arrow, as shown here.
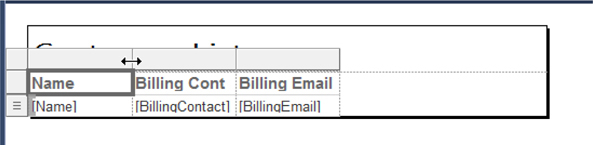
12. Hold down the left mouse button, and move the mouse pointer to the right. This makes the Name column wider.
13. Follow the technique described in Step 13 of this task to widen the Billing Contact and Billing Email columns as well.
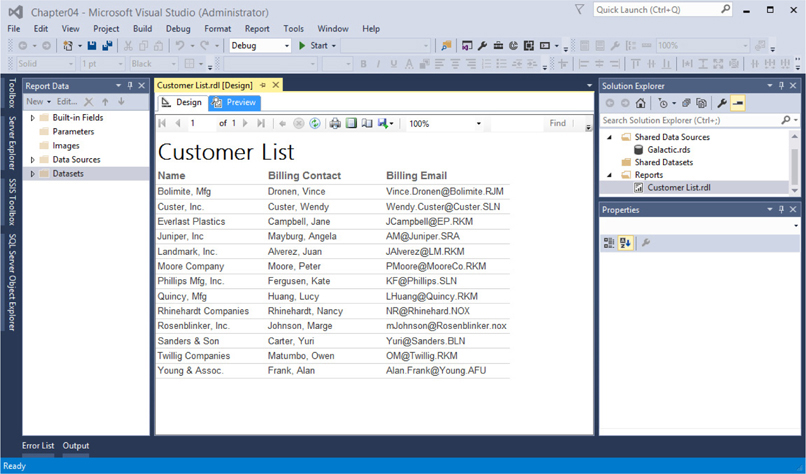
14. Click the Preview tab. Your report should appear as shown here.
15. Repeat Steps 11 through 16 until you are satisfied with the appearance of the report.
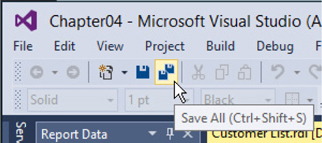
16. When you are satisfied with the report, click the Save All button on the toolbar. This saves the project, the shared data source, and the report files. The Save All button is highlighted in the following illustration. Be sure to read the Task Notes for this task found after the Report Builder steps.
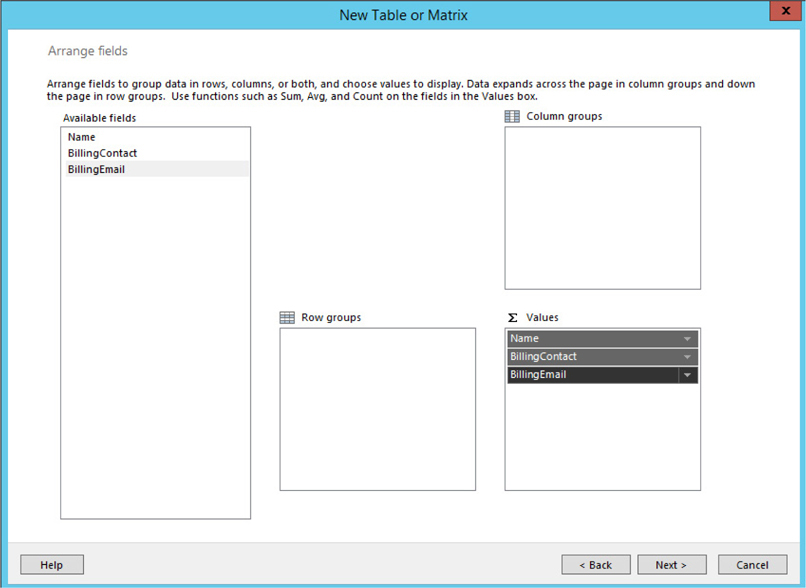
Report Builder Steps1. Click Next. The Arrange fields page of the New Table or Matrix Wizard appears.
2. Drag the Name field from the Available fields list and drop it in the Values area.
3. Do the same thing for the BillingContact and BillingEmail fields. The Arrange fields page should now look like the following illustration.
4. Click Next. The Choose the layout page of the wizard appears as shown here.
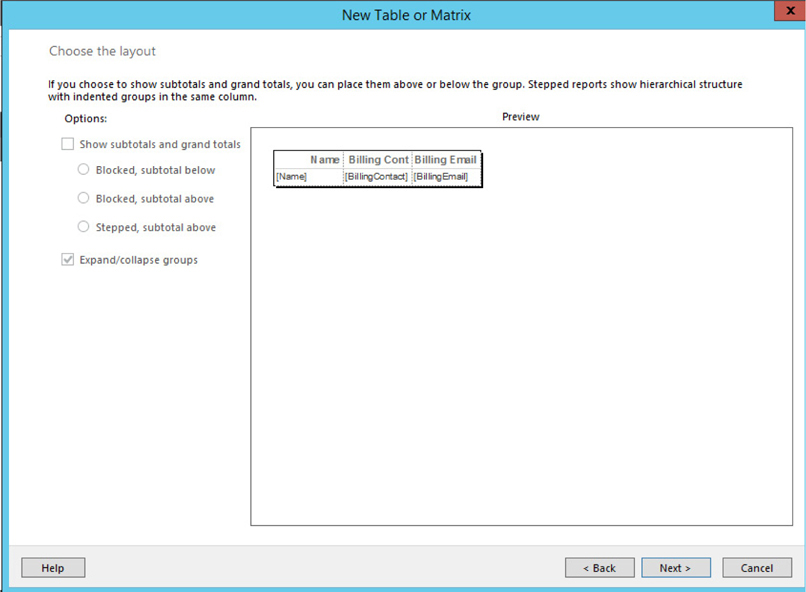
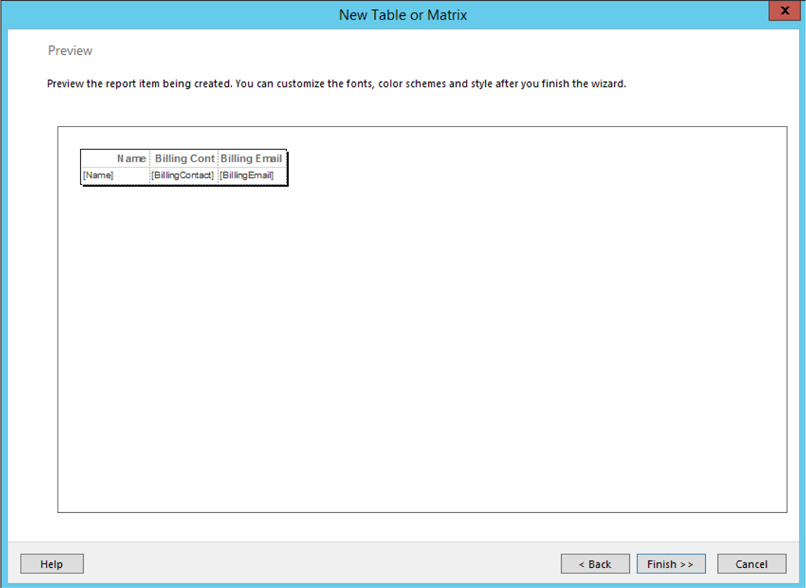
5. Our report layout is too basic to allow us any options here, so everything is disabled. Click Next. The Preview page of the wizard appears, as shown next.
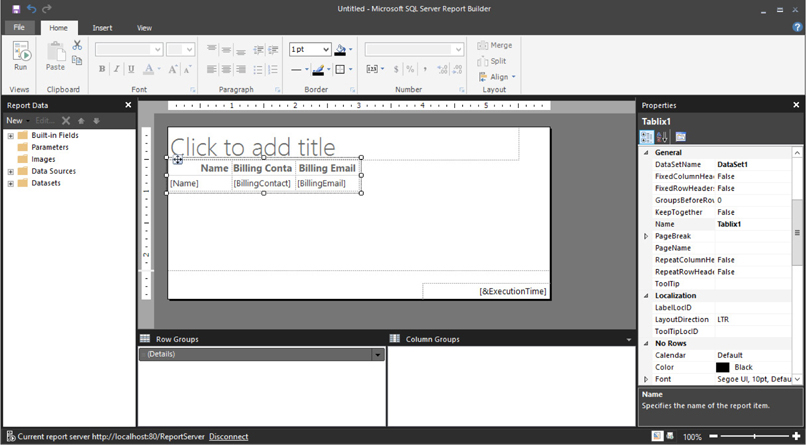
6. Click Finish. Report Builder shows the completed report design.
7. Click the Run button located in the upper-left corner. After a moment, a preview of your report appears.
8. Click the Design button in the upper-left corner.
9. The Report Wizard created columns in our report that seem a bit too narrow. We can improve the report by widening the columns. Click the Name heading (“Name” in a cell without square brackets around it).
10. Place your mouse pointer on the line separating the gray box above the Name heading and the gray box above the Billing Contact heading. Your mouse pointer changes to a double-headed arrow, as shown here.
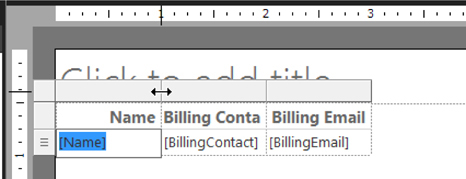
11. Hold down the left mouse button, and move the mouse pointer to the right. This makes the Name column wider.
12. Follow the technique described in Step 11 of this task to widen the Billing Contact and Billing Email columns as well.
13. Click the Run button. Your report should appear as shown here.
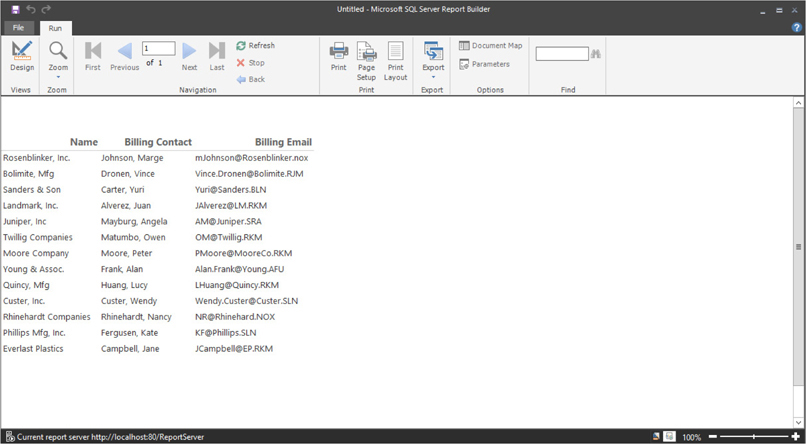
14. Repeat Steps 8 through 13 until you are satisfied with the appearance of the report.
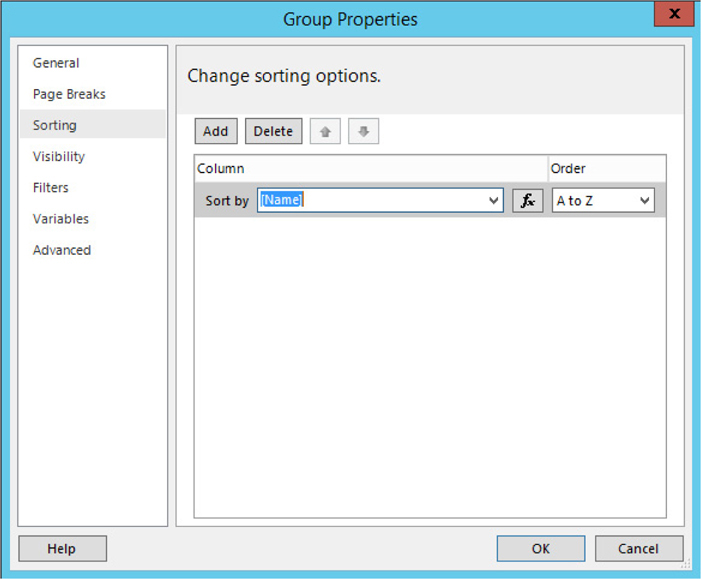
15. As you view the report, notice the customer names are in a random order. The Design a query page of the wizard did not allow us to add an ORDER BY clause to the query. Instead, we will sort the data in the report. While viewing the report design, find the Row Groups area. Click the drop-down arrow next to the “= (Details)” entry and select Group Properties from the list. The Group Properties dialog box appears.
16. Click the entry for the Sorting page of the dialog box.
17. Click Add to add a Sort by column.
18. From the Sort by drop-down list, select “[Name]” to sort by customer name. The Group Properties dialog box should appear as shown.
19. Click OK to exit the Group Properties dialog box.
20. Click the “Click to add title” area, and enter Customer List.
21. Click Run to view the report again. Note the report is now in customer name order.
22. When you are satisfied with the report, click the Save button at the top of the window. This saves the report design. The Save button is highlighted in the following illustration.
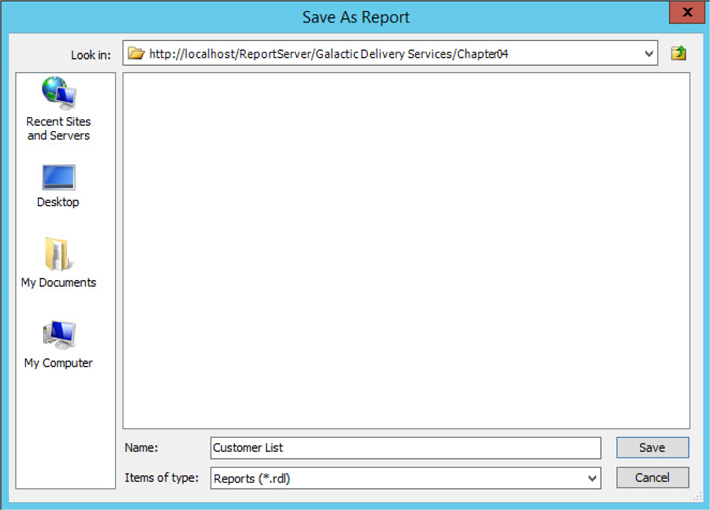
23. The Save As Report dialog box appears. Because you launched Report Builder from the web portal, the Save As Report dialog will default to the Home folder of the report server. If you want to save the report to the file system, use the My Documents or My Computer button on the left side of the dialog box. As discussed, we will save the reports directly to the report server when creating reports with Report Builder. Double-click the Galactic Delivery Services folder, and then double-click the Chapter04 folder.
24. Enter Customer List for the report Name. The Save As Report dialog appears as shown.
25. Click Save.
Task Notes You probably had to adjust the column widths several times to get the report just the way you wanted it to look. This is not a problem. Most reports you create require multiple trips between the Design and Preview/Run modes before everything is laid out as it should be. Knowing you can move back and forth with such ease is a real plus of the Report Designer and the Report Builder.
Congratulations! You have now completed your first report.
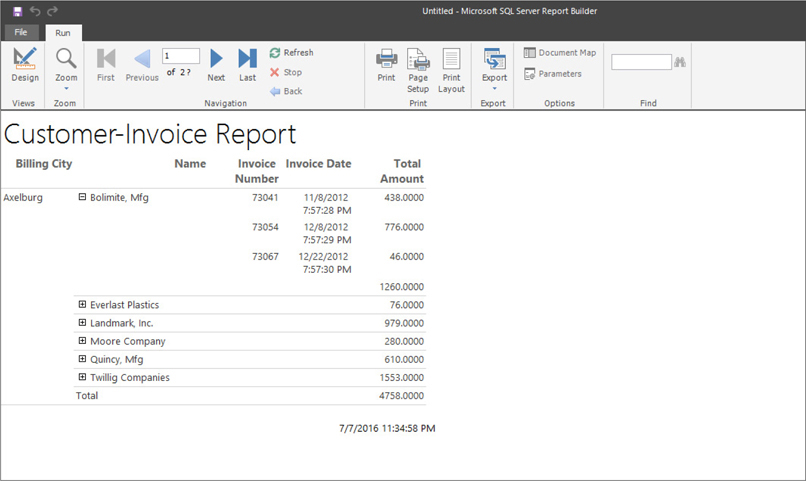
Now that you have a taste of how the Report Wizard works and what it can do, let’s try something a bit more complex. Let’s create a table report that implements an interactive feature called drilldown. With the drilldown type of report, only the high-level, summary information is initially presented to the viewers. They can then click a special area of the report (in our case, that area is designated by a plus [+] sign) to reveal part of the lower-level, detail information. The viewers drill down through the summary to get to the detail.
Using a shared data source
Linking tables
Assigning columns for page breaks and grouping
Enabling subtotals and drilldown
Business Need The accounting department would like a report listing all GDS customers. The customers need to be grouped by billing city, with each city beginning on a new page. The report allows a viewer to drill down from the customer level to see the invoices for that customer.
1. Prepare to Create a Second Report
2. Create a New Report, Select the Shared Data Source, and Create a Dataset
3. Choose the Report Layout
SSDT and Visual Studio StepsIf you have not closed the Chapter04 project since working on the previous section of this chapter, skip to Step 8. Otherwise, follow these steps, starting with Step 1.
1. Run SQL Server Data Tools or Visual Studio.
2. If a link to the Chapter04 project is visible on the Start page, click this link, and the Chapter04 project opens. Proceed to Step 8. If a link to the Chapter04 project is not visible on the Start page, continue with Step 3.
3. Select File | Open | Project/Solution.
4. Click Projects.
5. Double-click MSSQLRS.
6. Double-click Chapter04.
7. Double-click Chapter04.sln. (This is the file that contains the solution for Chapter04.)
8. If the Customer List report is displayed in the center of the screen, click the X on the “Customer List.rdl [Design]” tab to close this report.
Task Notes for SSDT and Visual Studio Steps Opening the Chapter04 solution (Chapter04.sln) and opening the Chapter04 project (Chapter04.rptproj) produce the same end result, so you can do either. Only one project is in the Chapter04 solution, so that project is automatically opened when the solution is opened. When the Chapter04 project is opened, the last report you worked on is displayed in the center of the screen. In this case, it is probably the Customer List report.
You do not need to close one report before working on another. In fact, you can have multiple reports open at one time and use the tabs containing the report names to move among them. In most cases, however, I find that a philosophy of “the less clutter, the better” works well when creating reports. For this reason, I recommend you close all unneeded reports as you move from one report to the next.
Report Builder Steps1. If the Report Builder was closed, open a browser and navigate to the web portal as discussed earlier in this chapter. Click the New item in the menu bar and select Paginated Report. (If you receive a dialog box as Report Builder starts up, click Run or Allow.) The Getting Started page appears.
2. If the Report Builder is open, click the File tab in the upper-left corner and select New from the menu.
SSDT and Visual Studio Steps1. In the Solution Explorer window on the right side of the screen, right-click the Reports folder. You see the context menu shown here.
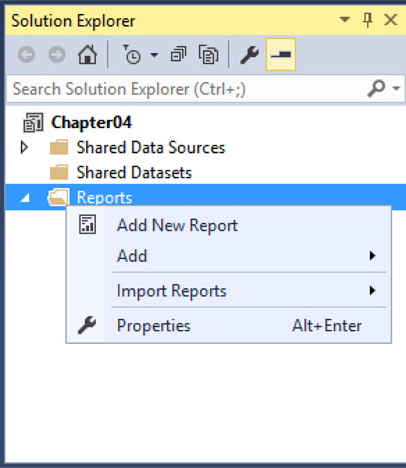
2. Select the Add New Report command from the context menu. This starts the Report Wizard, enabling you to create another report in the current project.
3. Click Next. The Select the Data Source page appears.
4. Make sure the Shared data source radio button is selected and the Galactic data source is selected in the drop-down list, as shown here. Click Next. The Design the Query page appears.
5. Click Query Builder. The Graphical Query Designer appears.
6. Right-click in the diagram pane (the upper area) of the Query Designer screen. You see the diagram pane context menu.
7. Select Add Table from the context menu.
8. Double-click Customer in the list of tables. The Customer table is added to the query.
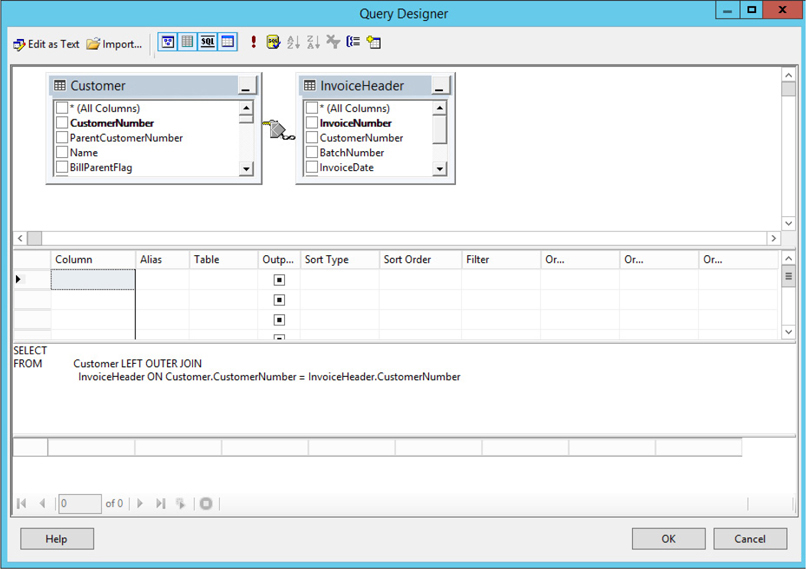
9. Double-click InvoiceHeader in the list of tables. Make sure you select InvoiceHeader and not InvoiceDetail. The InvoiceHeader table is added to the query.
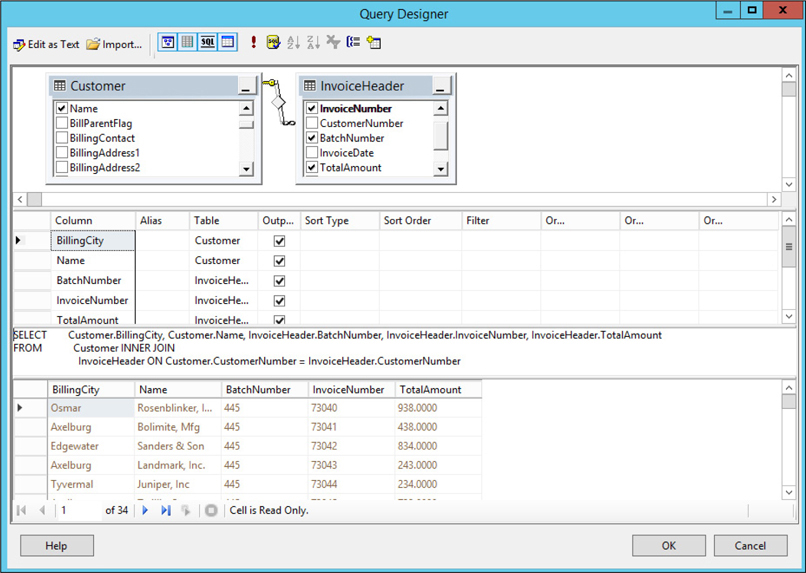
10. Click Close to exit the Add Table dialog box. Notice the Query Designer automatically creates the INNER JOIN between the Customer and the InvoiceHeader tables, as shown in the following illustration.

11. Right-click the gray diamond in the middle of the link joining the Customer and the InvoiceHeader tables. The Join Context menu is displayed, as shown in the following illustration.
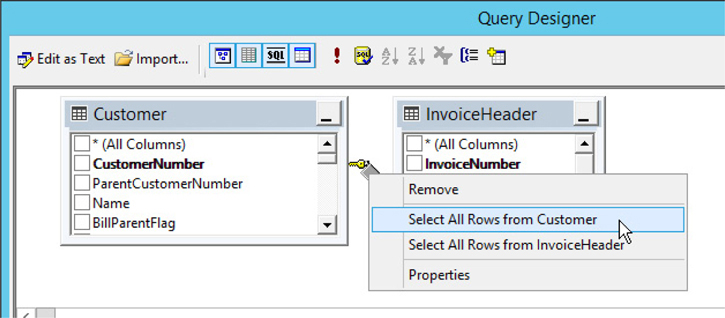
12. Choose the Select All Rows from Customer option from the context menu. The diamond symbol changes, as shown in the next illustration.
13. Scroll down in the list of columns for the Customer table until the BillingCity column name is visible.
14. Check the box next to the BillingCity column in the Customer table.
15. Scroll up in the list of columns for the Customer table, and check the box next to the Name column. This places the Name field after the BillingCity field in the resulting SQL query.
16. In the list of columns for the InvoiceHeader table, check the boxes next to the InvoiceNumber, InvoiceDate, and TotalAmount columns.
17. Place a 1 in the Sort Order column for the BillingCity field either by typing in the cell or using the drop-down list.
18. Place a 2 in the Sort Order column for the Name field.
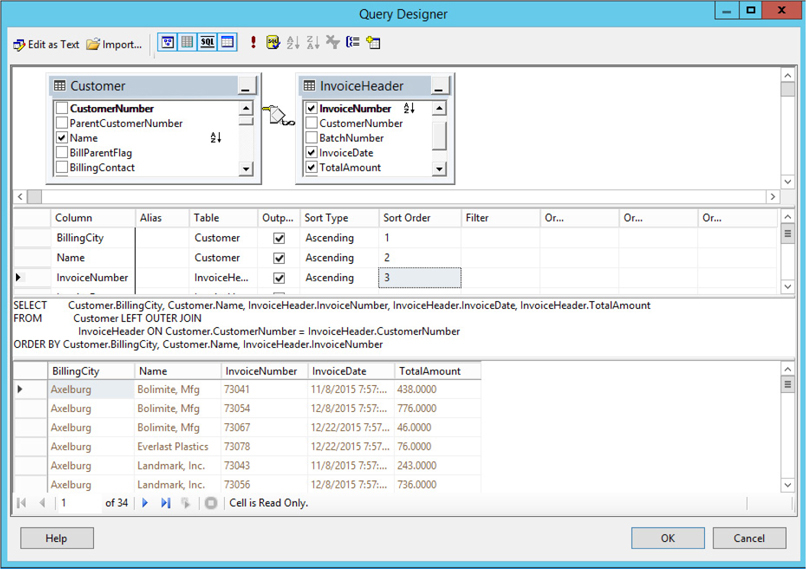
19. Place a 3 in the Sort Order column for the InvoiceNumber field.
20. Right-click in the SQL pane, and select Execute SQL from the context menu. The query executes, and the result set is displayed in the results pane. The Query Designer should appear similar to the following illustration.
21. Click OK. This returns you to the Design the Query page. Be sure to read the Task Notes for this task found after the Report Builder steps.
Report Builder Steps1. With New Report highlighted in the left column of the New Report or Dataset dialog box, click Table or Matrix Wizard. The Choose a dataset page of the New Table or Matrix Wizard appears.
2. Ensure the Create a dataset radio button is selected. Click Next. The Choose a connection to a data source page of the New Table or Matrix Wizard appears.
3. The Galactic shared data source should be selected by default. Click Next. The Graphical Query Designer on the Design a query page of the New Table or Matrix wizard appears.
4. Expand the Tables folder in the Database view pane.
5. Expand the entry for the Customer table.
6. Check the boxes next to the following fields in the Customer table in this order:
BillingCity
Name
7. Scroll down and expand the entry for the InvoiceHeader table.
8. Check the boxes next to the following fields in the InvoiceHeader table:
InvoiceNumber
InvoiceDate
TotalAmount
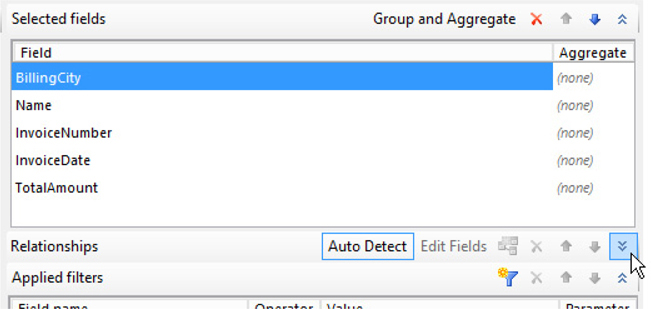
9. Expand the Relationships pane by clicking the double down arrow as shown here.
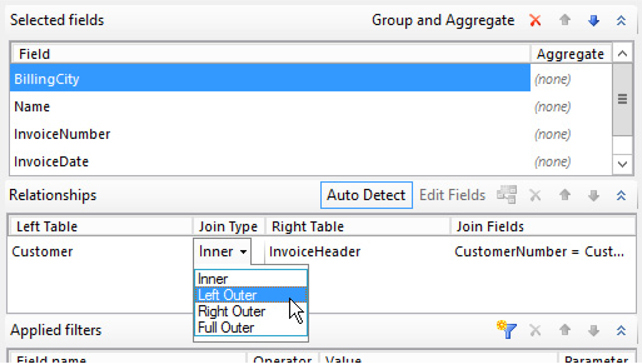
10. Notice the Query Designer automatically creates an INNER JOIN between the Customer and the InvoiceHeader tables. Click the Join Type column entry to activate the context menu as shown. Select Left Outer from the context menu.
11. Click Run Query. The Design a query page should appear similar to the following illustration.
Task Notes The Galactic data source you created in the first report is a shared data source. As such, the wizard defaults to using this shared data source any time a new report is created.
In the Query Designer, when a second table is added to the query, the Query Designer looks at the structure of the database. If there is a relationship defined between the new table and any of the tables already present in the query, a JOIN will be created based on that relationship.
The business need for this report states that the report should include all GDS customers. As you saw in Chapter 3, some customers may not have invoices, so to include all the customers in the report, you need to use a LEFT OUTER JOIN between the Customer table and the InvoiceHeader table.
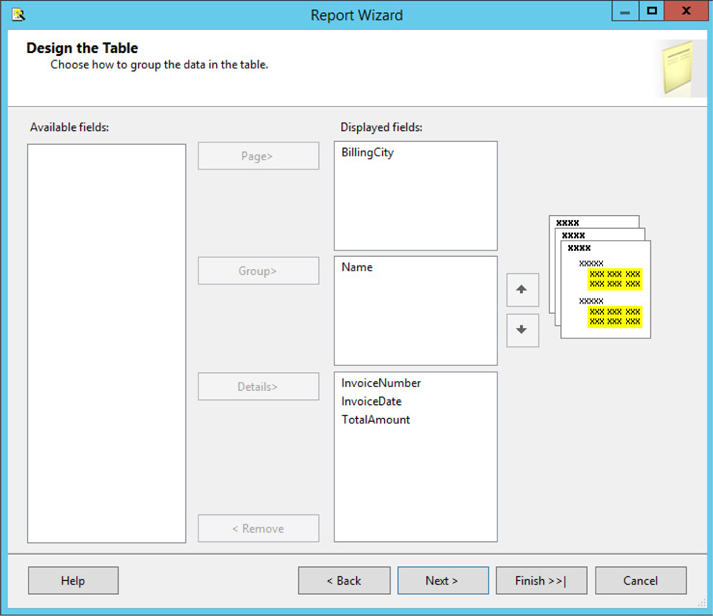
SSDT and Visual Studio Steps1. Click Next. The Select the Report Type page of the Report Wizard appears.
2. Make sure the Tabular radio button is selected, and click Next. The Design the Table page of the Report Wizard appears.
3. With the BillingCity field highlighted in the Available fields list, click Page. The BillingCity field is moved to the Displayed fields list.
4. With the Name field highlighted in the Available fields list, click Group. The Name field is moved to the Displayed fields list.
5. With the InvoiceNumber field highlighted in the Available fields list, click Details. The InvoiceNumber field is moved to the Displayed fields list.
6. With the InvoiceDate field highlighted in the Available fields list, click Details. The InvoiceDate field is moved to the Displayed fields list.
7. With the TotalAmount field highlighted in the Available fields list, click Details. The TotalAmount field is moved to the Displayed fields list. The Design the Table page appears as shown here.
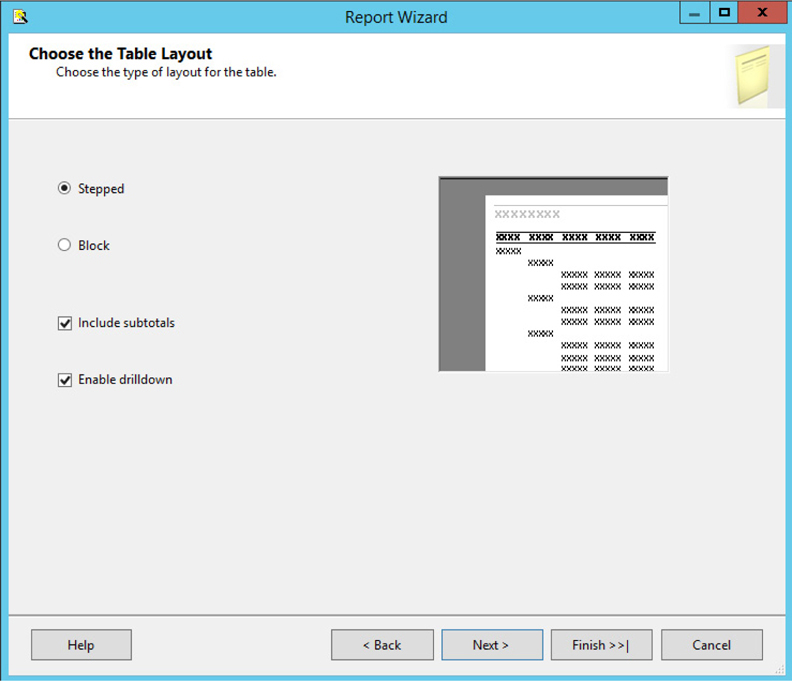
8. Click Next. The Choose the Table Layout page of the Report Wizard appears. This page appears in the Report Wizard because we put fields in the Group area on the Design the Table page.
9. Check the Include subtotals check box.
10. Check the Enable drilldown check box. The Choose the Table Layout page appears as shown.
11. Click Next. The Completing the Wizard page appears.
12. Type Customer-Invoice Report for the report name.
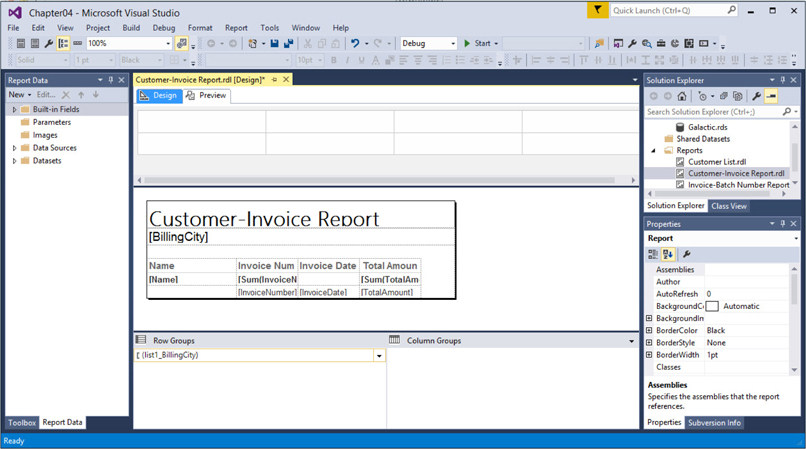
13. Click Finish. The Report Designer window opens as shown here.
14. Widen the Name column, as you did with the previous report.
15. Click the table cell directly under the Invoice Number heading. This cell is highlighted, as shown in the illustration.
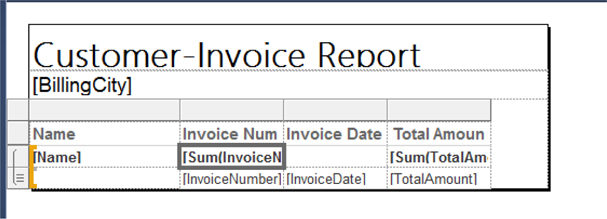
16. Press DELETE on your keyboard to remove the nonsensical totaling of the invoice numbers.
17. Click the Preview tab. A preview of your report appears.
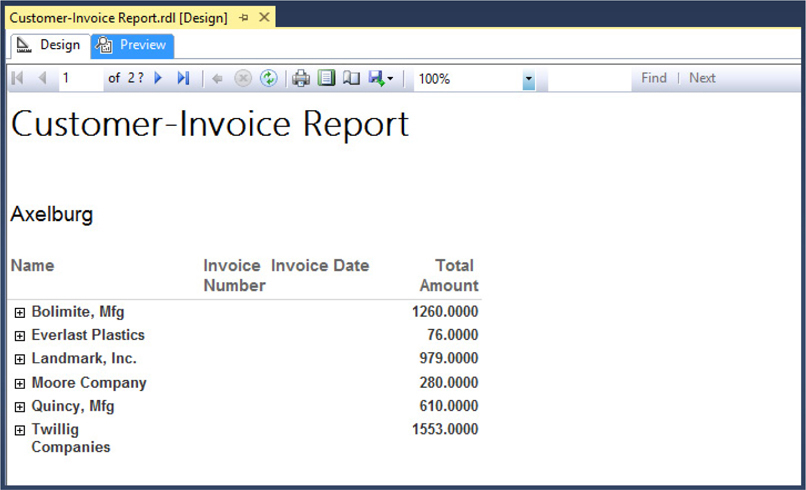
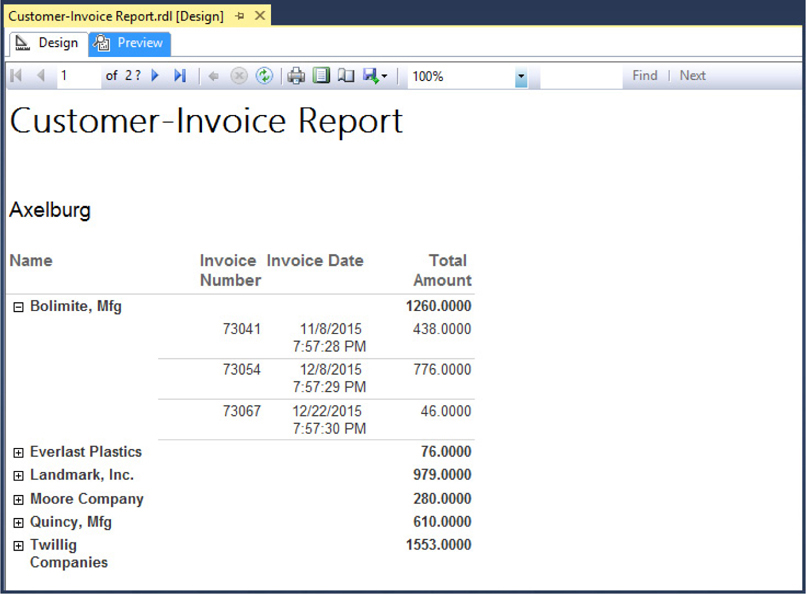
18. Click the plus sign in front of Bolimite, Mfg to view the invoices for this company, as shown next.
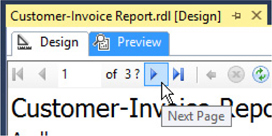
19. Click the Next Page button (the blue triangle just below the Preview tab) to advance to the next page of the report. The Next Page button is highlighted in the following illustration.
20. You can continue to work with the report preview to get a feel for the way report navigation and drilldown work. (For instance, you may want to try clicking the minus [−] sign.)
21. Click the Save All button on the toolbar.
Task Notes for SSDT and Visual Studio When we created the Customer List report, we put all the columns from the dataset into the detail line of the report. This time, we put the BillingCity column in the Page area of the table layout. Because of this, the Report Wizard created a report that begins a new page every time there is a new value in the BillingCity column. In addition, the value of the BillingCity column appears at the top of each report page.
Figure 4-3 shows the dataset used in the Customer-Invoice report. The first 13 rows have a value of Axelburg for the BillingCity column. Therefore, Axelburg appears at the top of Page 1 of the report. All the rows with Axelburg in the BillingCity column will be on Page 1 of the report.
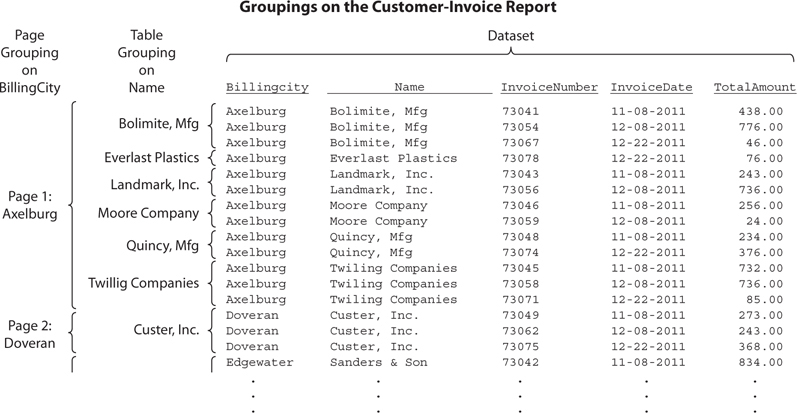
Figure 4-3 Groupings on the Customer-Invoice report
Using the Report Wizard, we put the Name column in the Group area of the table layout. This means the report will create a new group each time the value of the Name column changes. Again, looking at Figure 4-3, you can see the first three rows have a value of Bolimite, Mfg in the Name column. Therefore, these three rows will be combined in the first group on Page 1 of the report.
By checking the Enable drilldown check box, you told the Report Wizard to create a report in which the detail lines for each grouping are initially hidden. The detail lines for a group become visible when the plus sign for that group is clicked. By checking the Include subtotals check box, you told the Report Wizard to total any numeric columns in the detail and to show those totals in the group header for each group.
Let’s look again at the first few rows of the dataset shown in Figure 4-3. The first three rows have a value of Bolimite, Mfg in the Name column. Because of this, these three rows are grouped together for the report shown after Step 17 in Task 3. In this report, the number 1260.0000 appears across from Bolimite, Mfg. This is the total of all the invoices in the detail rows for Bolimite, Mfg.
Because the Report Wizard tried to add up any and all numeric columns, it also created an entry in the grouping for a total of the invoice numbers. Adding up the invoice numbers does not result in a meaningful value, so we deleted this grouping entry in Steps 15 and 16 of this task.
Report Builder Steps1. Click Next. The Arrange fields page of the New Table or Matrix Wizard appears.
2. Drag the BillingCity and Name fields to the Row groups area.
3. Drag the InvoiceNumber, InvoiceDate, and TotalAmount fields to the Values area. The Arrange fields page of the New Table or Matrix Wizard appears as shown here.
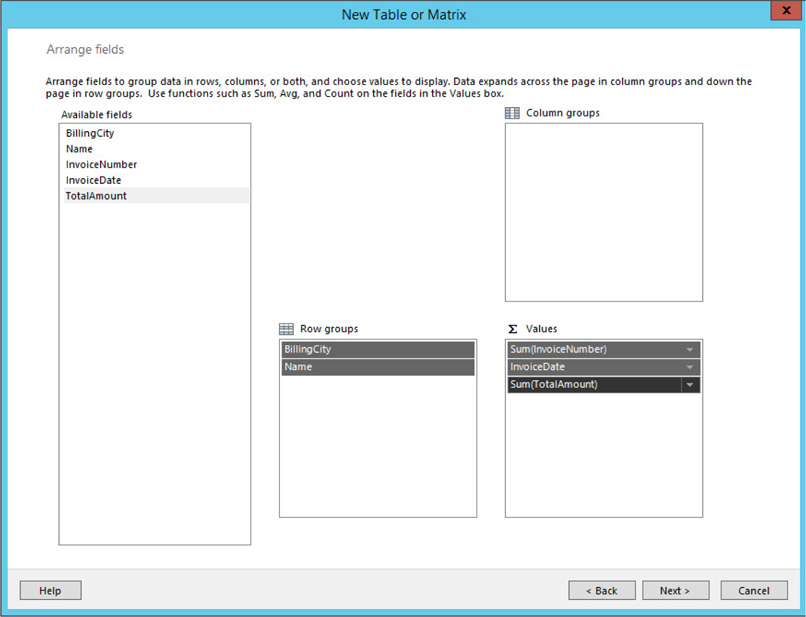
4. Click Next. The Choose the layout page of the New Table or Matrix Wizard appears.
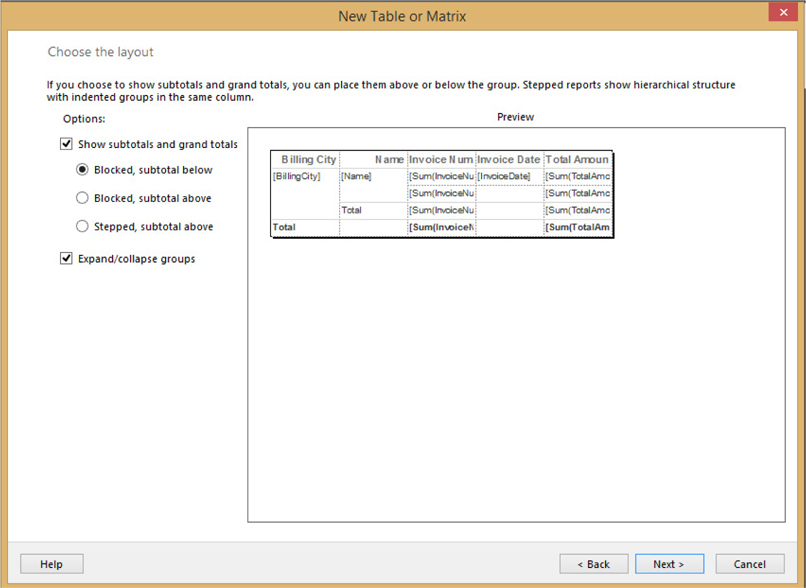
5. By default, the Show subtotals and grand totals check box is checked and the Blocked, subtotal below radio button is selected. In addition, the Expand/collapse groups check box is checked by default as shown here. These are all the selections we want for our report. Click Next. The Preview page of the New Table or Matrix Wizard appears.
6. Click Finish.
7. Widen the Name column, as you did with the previous report.
8. Click the second table cell below the Invoice Number heading (only “Invoice Nu” is visible in the heading) as shown here.
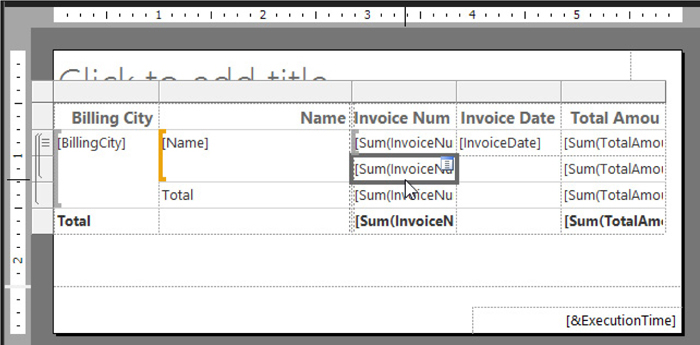
9. Hold down SHIFT and click the bottom table cell below the Invoice Number heading.
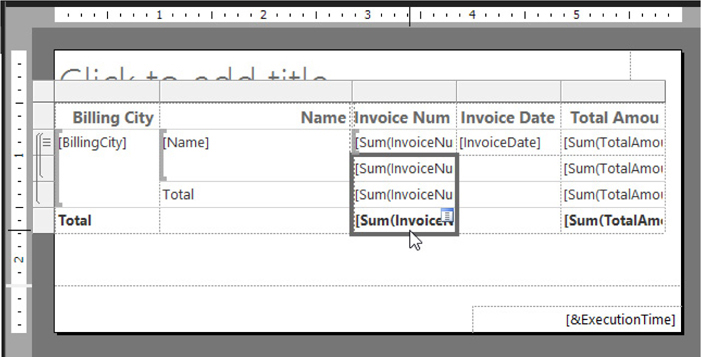
10. Press DELETE on your keyboard to remove the nonsensical totaling of the invoice numbers.
11. In the Row Groups area, click the drop-down arrow next to the BillingCity entry, and select Group Properties from the list. The Group Properties dialog box appears.
12. Click the entry for the Page Breaks page of the dialog box.
13. Check the Between each instance of a group check box. The Group Properties dialog box appears as shown here.
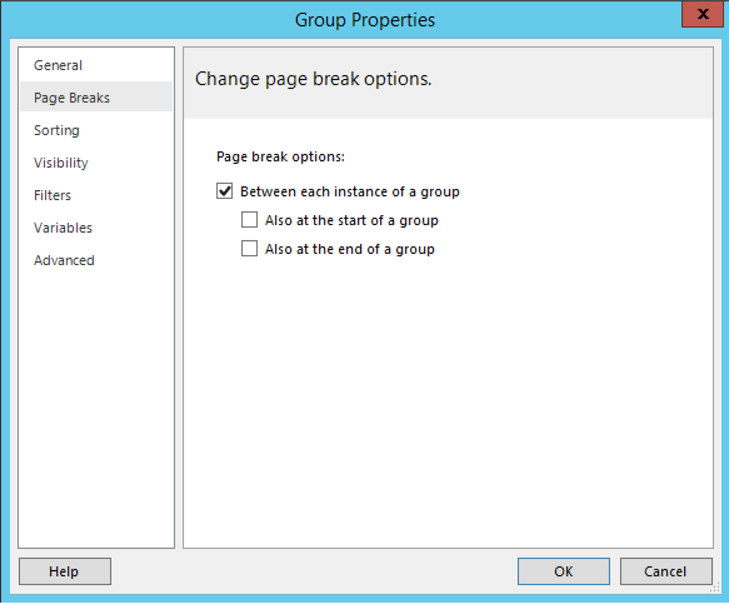
14. Click OK to exit the Group Properties dialog box.
15. In the Row Groups area, click the drop-down arrow next to the Name entry, and select Group Properties from the list. The Group Properties dialog box appears.
16. Click the entry for the Visibility page of the dialog box.
17. Select the Show radio button.
18. Uncheck the Display can be toggled by this report item check box. The dialog box should appear as shown.
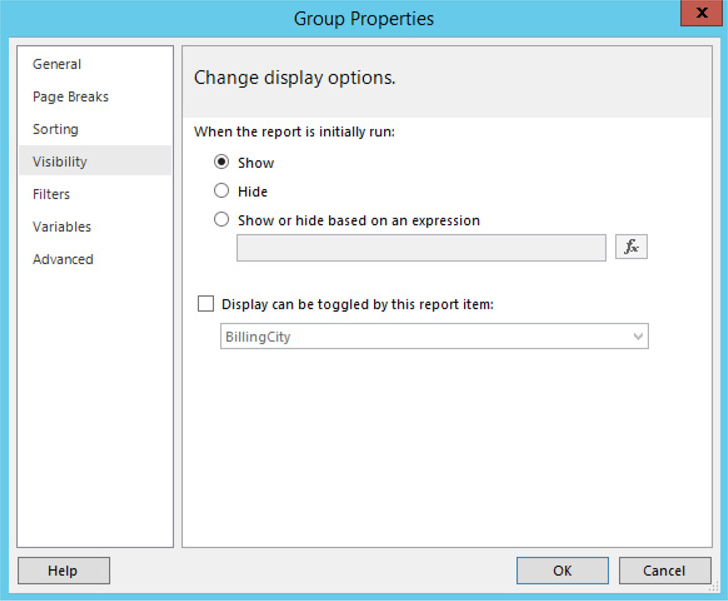
19. Click OK to exit the Group Properties dialog box.
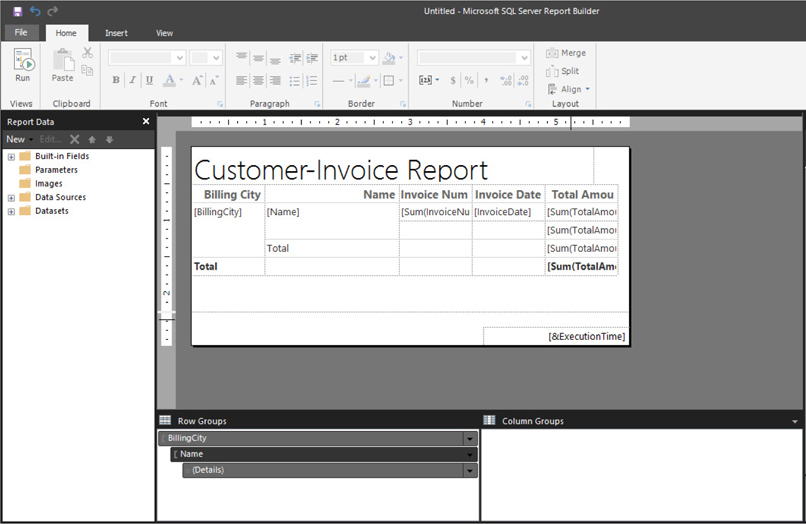
20. Click the “Click to add title” area, and enter Customer-Invoice Report. The completed report layout should appear similar to the following illustration.
21. Click the Run button. A preview of your report appears.
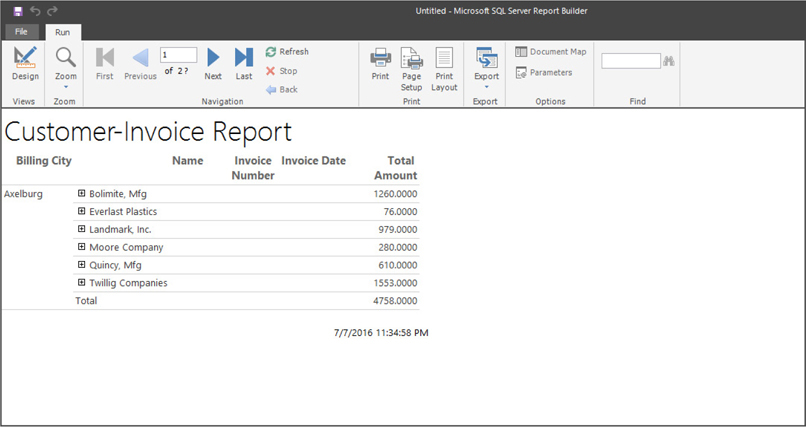
22. Click the plus sign in front of Bolimite, Mfg to view the invoices for this company, as shown here.
23. Click the Next Page button (the blue triangle in the Navigation section of the ribbon) to advance to the next page of the report.
24. You can continue to work with the report preview to get a feel for the way report navigation and drilldown work. (For instance, you may want to try clicking the minus [−] sign.)
25. Click the Save button on the toolbar. The Save As Report dialog box appears.
26. Navigate to the Chapter04 folder, if the dialog box is not already there.
27. Replace Untitled.rdl with Customer-Invoice Report for the Name.
28. Click Save.
Task Notes for Report Builder When you created the Customer List report, you put all the columns from the dataset into the Values area of the report. This time, you put the BillingCity in the Row groups area. This created a row grouping for each billing city. You later modified the properties for this group to have the report create a page break between each group.
Figure 4-3 (in the previous Task Notes for SSDT and Visual Studio) shows the dataset used in the Customer-Invoice report. The first 13 rows have a value of Axelburg for the BillingCity column. Therefore, Axelburg appears on Page 1 of the report. All the rows with Axelburg in the BillingCity column will be on Page 1 of the report.
You put the Name column in the Row groups area as well. This means the report will create a new group each time the value of the Name column changes. Again, looking at Figure 4-3, you can see the first three rows have a value of Bolimite, Mfg in the Name column. Therefore, these three rows will be combined in the first group on Page 1 of the report.
By leaving the Expand/collapse groups check box checked, you told the Report Wizard to create a report in which the detail lines for each grouping are initially hidden. The detail lines for a group become visible when the plus sign for that group is clicked. However, we only want the lowest-level group (the Details group) to be initially hidden. We do not want the Name group to be initially hidden. This is why we used the Group Properties dialog box to change the initial value of this group from Hide to Show.
By leaving the Show subtotals and grand totals check box checked, you told the Report Wizard to total any numeric columns in the detail and to show those totals in the group footer for each group.
Let’s look again at the first few rows of the dataset shown in Figure 4-3. The first three rows have a value of Bolimite, Mfg in the Name column. Because of this, these three rows are grouped together for the report shown after Step 21 in Task 3. In this report, the number 1260.0000 appears across from Bolimite, Mfg. This is the total of all the invoices in the detail rows for Bolimite, Mfg.
Because the Report Wizard tried to add up any and all numeric columns, it also created an entry in the grouping for a total of the invoice numbers. Adding up the invoice numbers does not result in a meaningful value, so we deleted this grouping entry in Steps 8 through 10 of this task.
Finally, if you have been paying close attention, you will have noticed we did not specify any sort order for the groups and yet they appear properly sorted. When the wizard created the BillingCity and Name row groups, it automatically added sorting to the groups as well. (The Detail group is not sorted. You can add sorting to the Detail group on your own, if you would like extra credit.)
You have now seen much of what the Report Wizard can do for you when it comes to tabular reports. Now, let’s look at another report type the Report Wizard can produce for you. Prepare yourself. You are going to enter the matrix.
What Reporting Services calls a matrix report is referred to as a crosstab or a pivot table report elsewhere. In a tabular report, you have columns from a result set across the top and rows from a result set going down the page. In a matrix report, you have row values going across the top and down the page. Matrix reports are much easier to grasp once you have seen one in action, so let’s give it a try.
Using the matrix report type
Business Need The accounting department processes invoices in batches. Once a week, the accounting department creates invoices to send to their customers for the deliveries made over the previous week. A batch number is assigned to each invoice as it is created. All the invoices created on the same day are given the same batch number.
The new report requested by the accounting department shows the total amount of the invoices created in each batch. The report also allows batches to be broken down by billing city and by customer. To allow this type of analysis, you need to use a matrix report.
1. Create a New Report, Select the Shared Data Source, and Create a Dataset
2. Choose the Report Layout
SSDT and Visual Studio Steps1. If you closed the Chapter04 project, reopen it. (If you need assistance with this, see Task 1 of the previous report.) If you have not yet done so, close the Customer-Invoice report.
2. In the Solution Explorer on the right side of the screen, right-click the Reports folder.
3. Select the Add New Report command from the context menu. This starts the Report Wizard, enabling you to create an additional report in the current project.
4. Click Next. The Select the Data Source page appears.
5. Make sure the Shared Data Source radio button is selected and the Galactic data source is selected in the drop-down list. Click Next.
6. Click Query Builder. The Graphical Query Designer appears.
7. Right-click in the diagram pane (the upper area) of the Query Designer screen. You see the diagram pane context menu.
8. Select Add Table from the context menu.
9. Add the following tables to the query:
Customer
InvoiceHeader
10. Click Close to exit the Add Table dialog box.
11. Check the following columns in the Customer table in the order shown here:
BillingCity
Name
12. Check the following columns in the InvoiceHeader table in the order shown here:
BatchNumber
InvoiceNumber
TotalAmount
13. Right-click in the SQL pane, and select Execute SQL from the context menu. The query executes, and the result set is displayed in the results pane. The Query Designer should appear similar to the illustration.
14. Click OK. This returns you to the Design the Query page. Be sure to read the Task Notes for this task found after the Report Builder steps.
Report Builder Steps1. If you closed the Report Builder, reopen it. If you have not closed the Report Builder, click the File tab of the ribbon, and select New. You will see the New Report or Dataset dialog box.
2. With New Report selected, click Table or Matrix Wizard. The Choose a dataset page of the New Table or Matrix Wizard appears.
3. Ensure the Create a dataset radio button is selected. Click Next. The Choose a connection to a data source page of the New Table or Matrix Wizard appears.
4. The Galactic shared data source should be selected by default. Click Next. The Design a query page of the New Table or Matrix Wizard appears.
5. Expand the Tables folder in the Database view pane.
6. Expand the entry for the Customer table.
7. Check the boxes next to the following fields in the Customer table in this order:
BillingCity
Name
8. Scroll down and expand the entry for the InvoiceHeader table.
9. Check the boxes next to the following fields in the InvoiceHeader table in this order:
BatchNumber
InvoiceNumber
TotalAmount
10. Click Run Query. The Design a query page should appear similar to the following illustration.
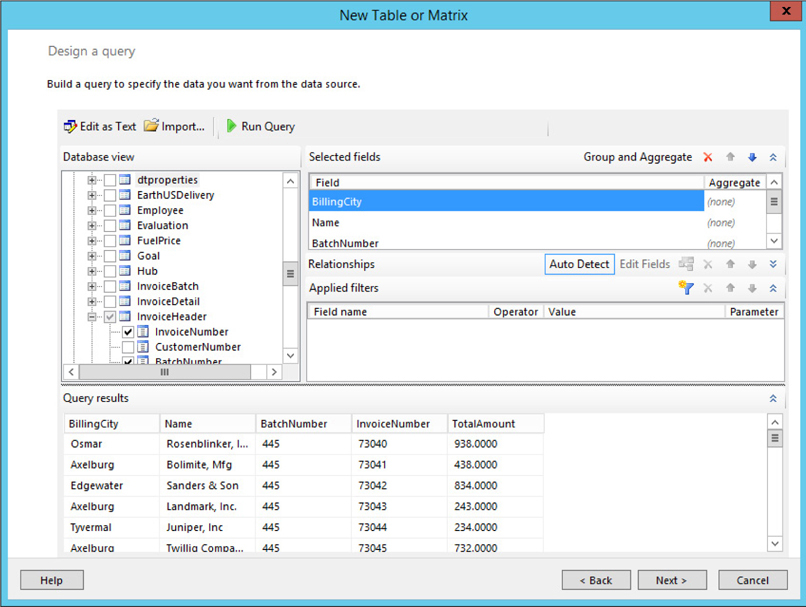
Task Notes Your dataset contains the columns we need to create the matrix report. Note we did not specify any sort order for the dataset. The matrix itself takes care of sorting the dataset and displaying things in the correct order. It presents the data in the rows and in the columns in ascending order.
SSDT and Visual Studio Steps1. Click Next. The Select the Report Type page of the Report Wizard appears.
2. Select the Matrix radio button.
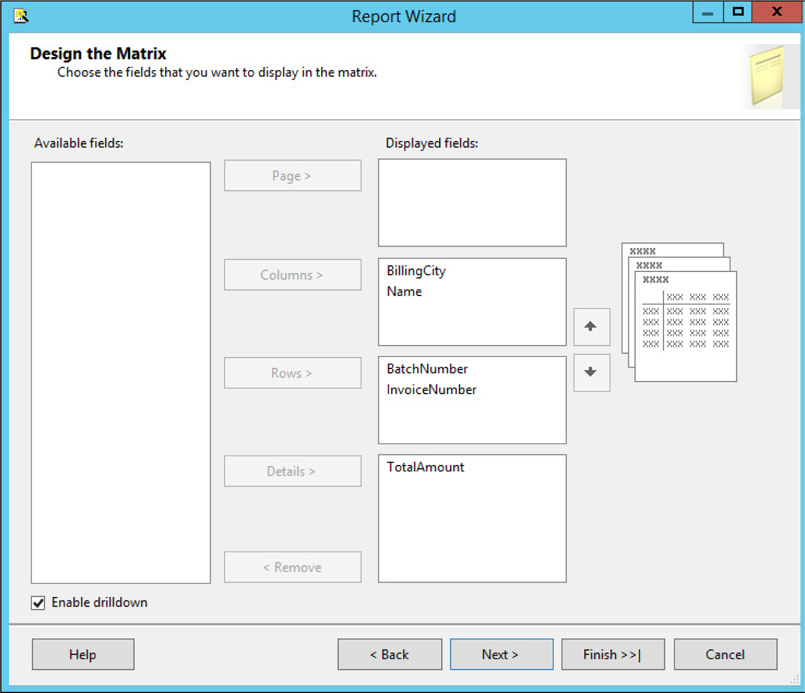
3. Click Next. The Design the Matrix page of the Report Wizard appears.
4. Use the Columns button to place the following fields in the Displayed fields list:
BillingCity
Name
5. Use the Rows button to place the following fields in the Displayed fields list:
BatchNumber
InvoiceNumber
6. Use the Details button to place the following field in the Displayed fields list:
Total Amount
7. Check the Enable drilldown check box at the bottom of the page. The Design the Matrix page should appear as shown.
8. Click Next. The Completing the Wizard page appears.
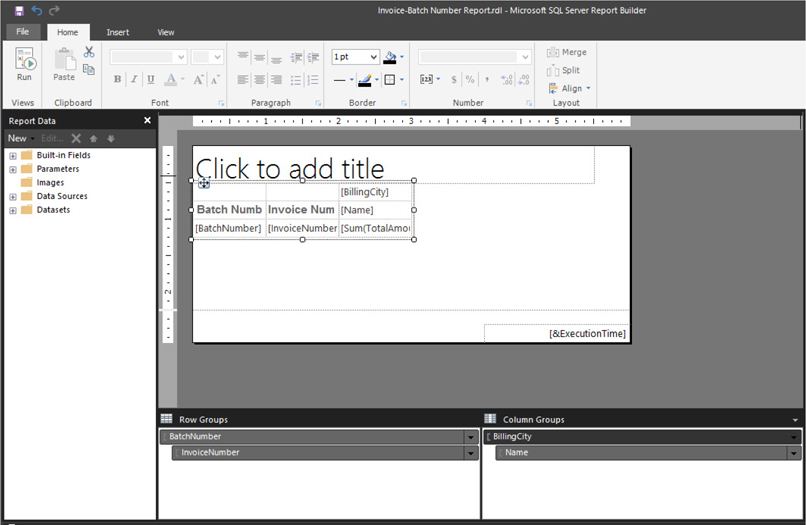
9. Type Invoice-Batch Number Report for the report name.
10. Click Finish. The Report Designer window opens.
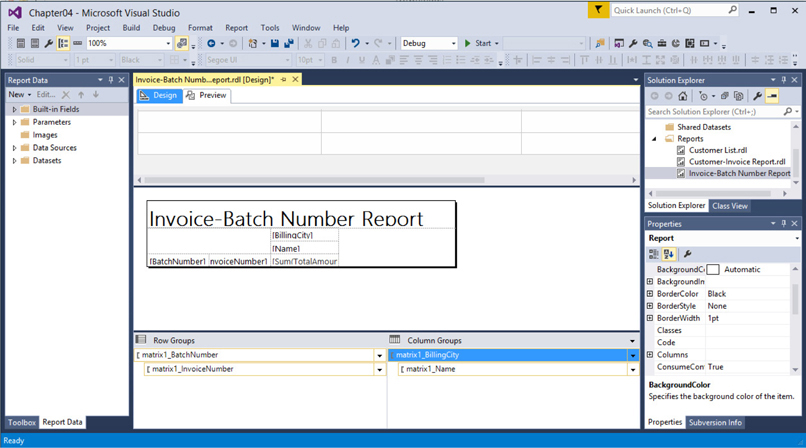
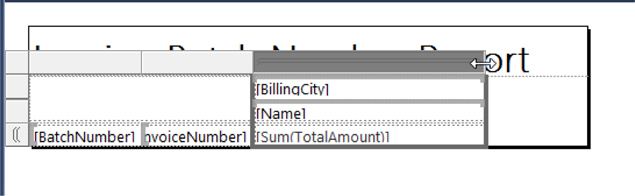
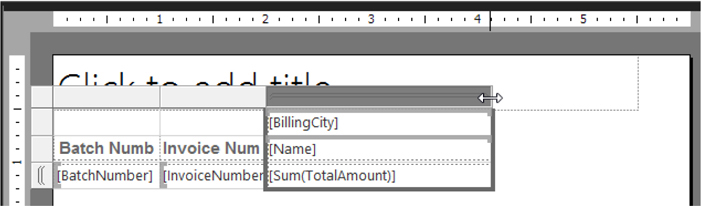
11. Widen the column on the far-right side of the matrix, as shown in the illustration.
12. Click the Preview tab. A preview of your report appears. Try expanding both rows and columns.
13. Click the Save All button in the toolbar. Be sure to read the Task Notes for this task found after the Report Builder steps.
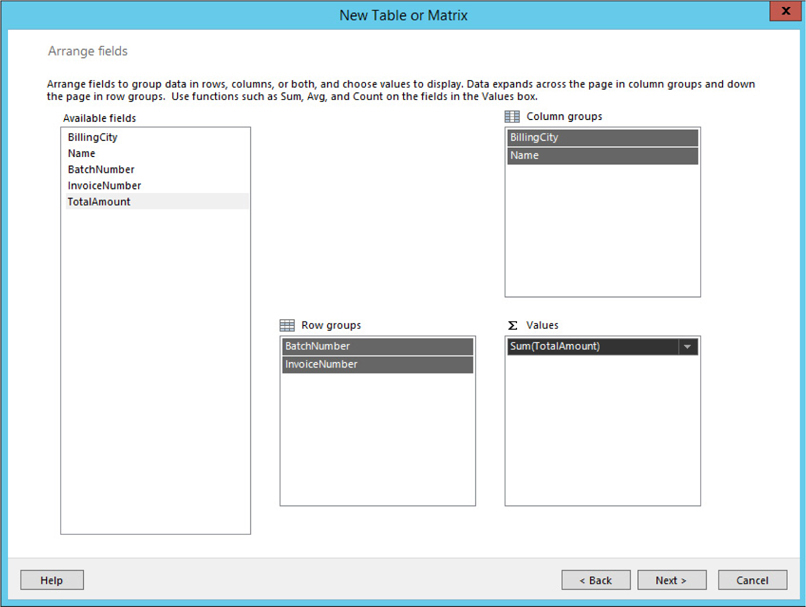
Report Builder Steps1. Click Next. The Arrange fields page of the New Table or Matrix Wizard appears.
2. Drag the BillingCity and Name fields to the Column groups area.
3. Drag the BatchNumber and InvoiceNumber fields to the Row groups area.
4. Drag the Total Amount field to the Values area. The Arrange fields page of the New Table or Matrix Wizard appears as shown.
5. Click Next. The Choose the layout page of the New Table or Matrix Wizard appears.
6. Uncheck the Show subtotals and grand totals check box.
7. Click Next. The Preview page of the New Table or Matrix Wizard appears.
8. Click Finish. The report design opens in Report Builder.
9. Widen the column on the far-right side of the matrix, as shown in the illustration.
10. Click the Run button. A preview of your report appears. Try expanding both rows and columns.
11. Click the Design button.
12. Click the “Click to add title” area, and enter Invoice-Batch Number Report.
13. Click the Save button on the toolbar. The Save As Report dialog box appears.
14. Navigate to the Chapter04 folder, if the dialog box is not already there.
15. Replace Untitled.rdl with Invoice-Batch Number Report for the Name.
16. Click Save.
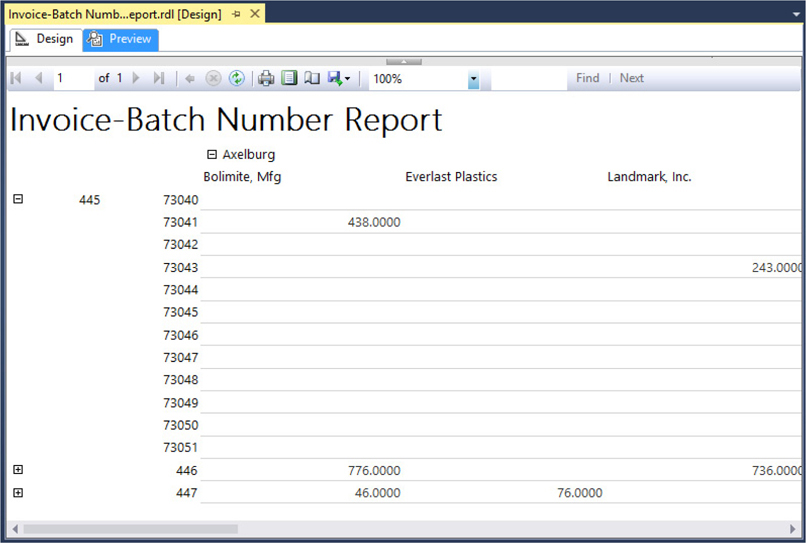
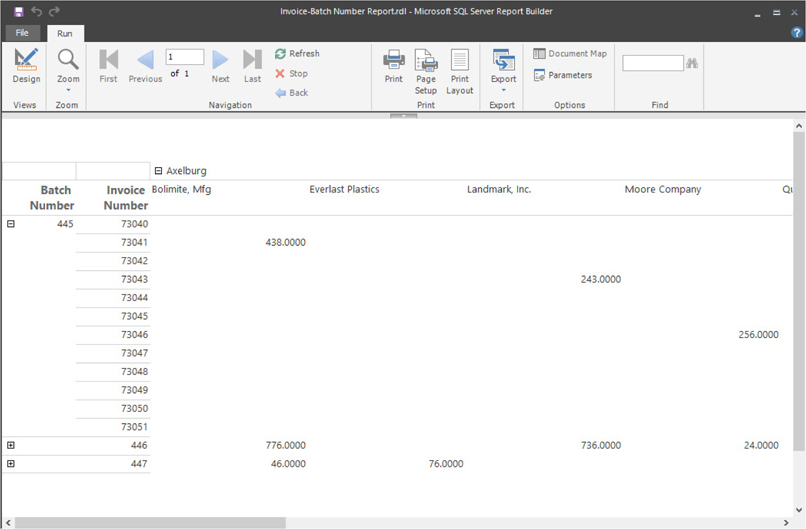
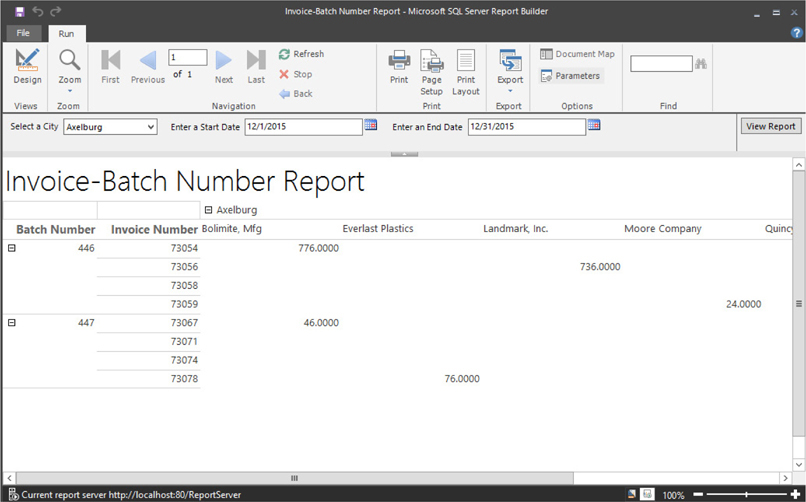
Task Notes The Invoice-Batch Number Report contains a column for each billing city and a row for each batch number. You need to scroll to the right to see all the columns in the report. The numbers in the matrix are the totals for each batch number in each billing city. For example, $1,903 was invoiced to companies in Axelburg in batch number 445.
The column headings are left-justified, whereas the numeric values are right-justified. This makes the report a bit hard to read. We discuss how to correct these types of formatting issues in Chapter 5.
Clicking the plus sign next to a batch number shows you all the invoices in that batch. If you expand batch number 445, you can see that invoice number 73040 included $938 for companies in Osmar, and invoice number 73041 included $438 for companies in Axelburg.
Clicking the plus sign next to a billing city shows you all the customers in that city. If you expand Axelburg, you can see that invoice number 73041 included $438 for Bolimite, Mfg. If you click the minus sign next to batch number 445, you can see that batch number 446 included $776 for Bolimite, Mfg.
From the users’ standpoint, all our sample reports up to this point have been “what you see is what you get.” These reports each ran a predetermined query to create the dataset. No user input was requested.
In the real world, this is not the way things work. Most reports require the user to specify some criteria that can help determine what information is ultimately in the report. The user may need to enter a start and an end date, or they may need to select the department or sales region to be included in the report. Users like to have control over their reports so they receive exactly the information they are looking for. Our next report demonstrates how Reporting Services enables you to get user input by using report parameters.
Using report parameters
Business Need The accounting department is pleased with the Invoice-Batch Number Report. Like most users, when they are happy with something, they want to change it. No software or report is ever really completed. It only reaches a resting point until users think of another enhancement.
The accounting department would like to be able to view the Invoice-Batch Number Report for one city at a time. And they would like to pick the city from a list of all the cities where they have customers. They would also like to specify a start date and an end date and only view batches that were run between those dates.
We can modify the Invoice-Batch Number Report to include these features. We can add a filter to the dataset. (This will create a WHERE clause in the SELECT statement generated for us.) Then we can send the user’s selections for city, start date, and end date to the filter using report parameters.
1. Reopen the Invoice-Batch Number Report, and Add Parameters to the Query in the Original Dataset
2. Create a Second Dataset Containing a List of Cities
3. Customize the Report Parameters
SSDT and Visual Studio Steps1. If you closed the Chapter04 project, reopen it. (If you need assistance with this, see Task 1 of the Customer-Invoice Report.)
2. If the Invoice-Batch Number Report is open, make sure the Design tab, not the Preview tab, is selected. If the Invoice-Batch Number Report is not open, double-click the entry for the Invoice-Batch Number Report in the Solution Explorer on the right side of the screen.
3. Expand the Datasets folder in the Report Data window.
4. Right-click the DataSet1 entry in the Report Data window. You will see the context menu, as shown here.
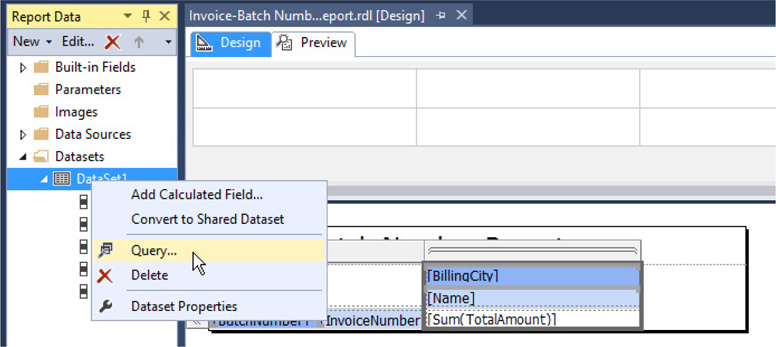
5. Select Query from the context menu. You see the Query Designer screen with the query built for this report while running the Report Wizard.
6. Right-click in the diagram pane, and select Add Table from the context menu.
7. The accounting department wants to specify a date range based on the date each batch was run. This date is stored in the InvoiceBatch table. We need to join this table with the InvoiceHeader table. Double-click InvoiceBatch in the list of tables. The Graphical Query Designer automatically creates the JOIN for us.
8. Click Close to exit the Add Table dialog box.
9. In the InvoiceBatch table, check the check box next to the RunDate field. This adds RunDate to the criteria pane.
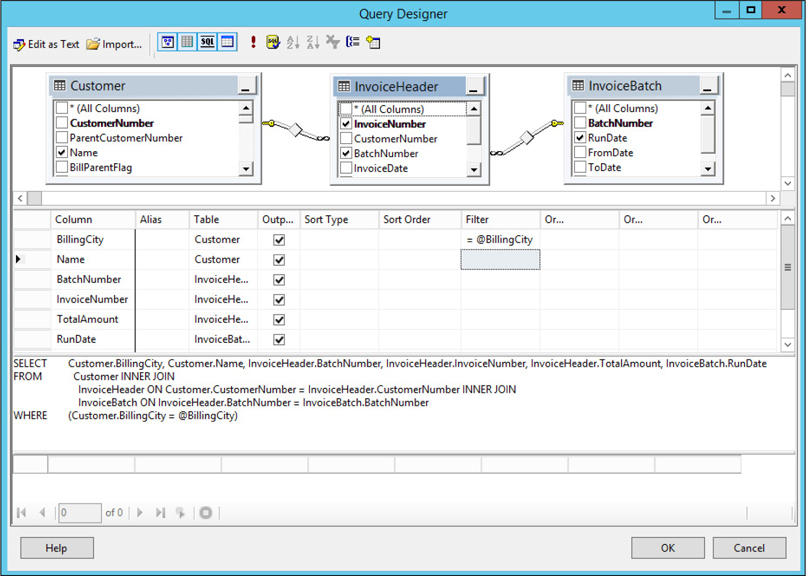
10. Now we can create the portion of the WHERE clause involving the billing city. In the criteria pane, click the cell across from BillingCity and under Filter. The cursor moves to that cell. Type =@BillingCity and press ENTER. With a little rearranging, the Graphical Query Designer appears as shown in the following illustration. Notice the SQL statement in the SQL pane now includes a WHERE clause.
11. Next, we create the portion of the WHERE clause involving the RunDate. Scroll down in the criteria pane until RunDate is visible, if necessary. Click the cell across from RunDate and under Filter. Type >= @StartDate AND < DATEADD(dd, 1, @EndDate) and press ENTER. The Query Designer portion of the screen appears as shown in the following illustration. Notice the addition to the WHERE clause in the SQL pane. We discuss why we are using the DATEADD() function in the Task Notes.
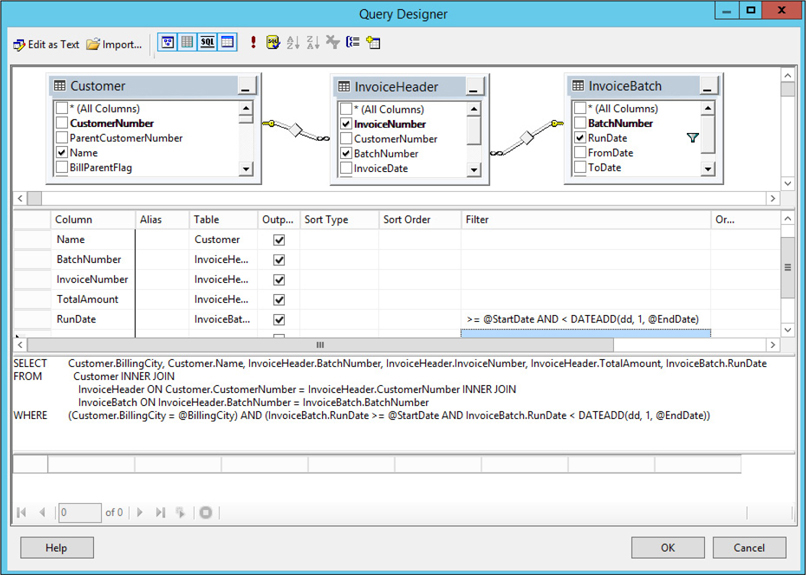
12. We needed to include RunDate in the WHERE clause, but we do not need to include it in the FIELD LIST of the SELECT statement. Click in the cell across from RunDate and under Output to remove the check mark. The RunDate field is no longer in the FIELD LIST for the SELECT statement in the SQL pane.
13. Right-click in the SQL pane, and select Execute SQL from the context menu.
14. The Query Designer requires values for the three parameters you just created to run the query. You see the Query Parameters dialog box. Enter Axelburg for @BillingCity, 12/01/2015 for @StartDate, and 12/31/2015 for @EndDate. Click OK.
15. After viewing the result set, click OK to exit the Query Designer window. Be sure to read the Task Notes for this task found after the Report Builder steps.
Report Builder Steps1. If you closed the Report Builder, locate the Invoice-Batch Number Report in the Chapter04 folder in the web portal. Click the ellipsis (...) button in the entry for this report. Select MANAGE from the pop-up. Click Edit in Report Builder. If you have not closed the Report Builder, make sure you are in design mode. (The Run button should be visible in the upper-left corner.)
2. Expand the Datasets folder in the Report Data window.
3. Right-click the DataSet1 entry in the Report Data window. You will see the context menu, as shown here.
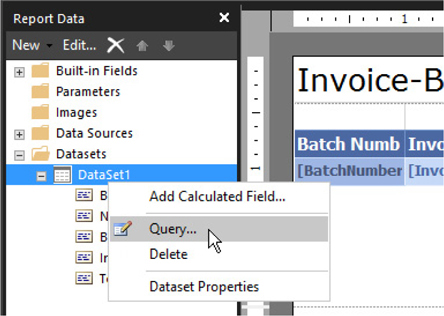
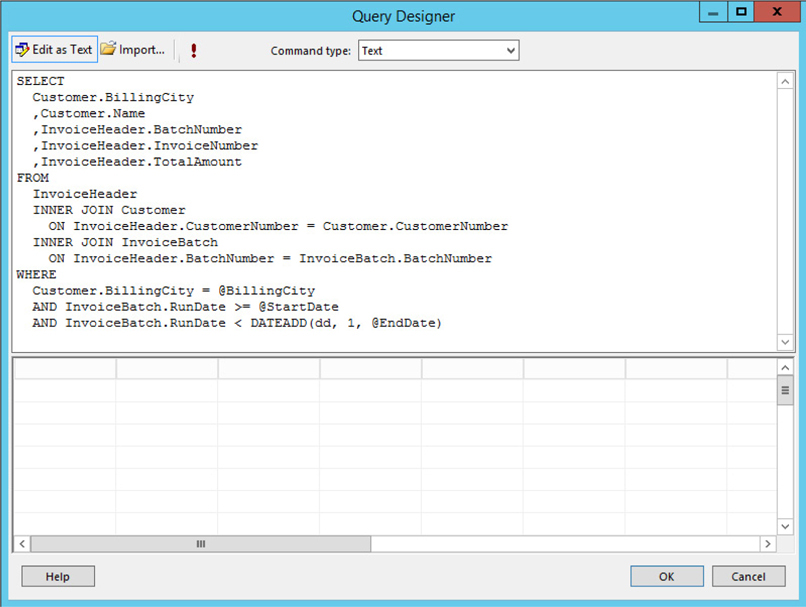
4. Select Query from the context menu. You see the Query Designer screen with the query built for this report by the Report Wizard. The Query Designer will display the query in the Edit as Text mode. (Windows 10 users, click Edit as Text.)
5. Click the bar that separates the Query entry area at the top of the screen from the grid at the bottom of the screen. Drag this bar down so you can see the entire query, as shown here.
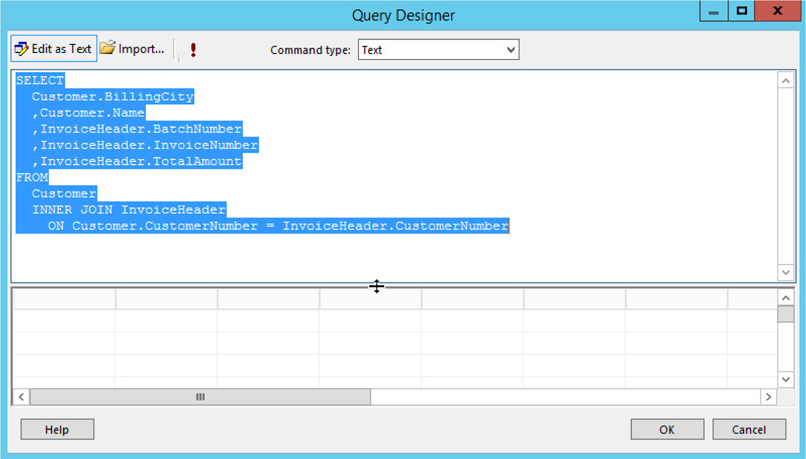
6. Modify the query to match the query shown here by deleting the text after the FROM and adding the text in bold:
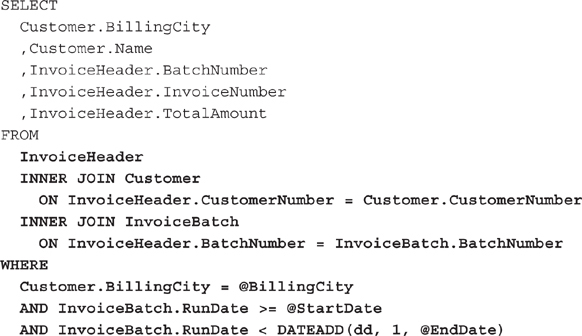
The completed query should appear as shown:
7. Click the red exclamation point to execute the query.
8. The Query Designer requires values for the three parameters you just created to run the query. You see the Define Query Parameters dialog box. In the Parameter Value column, enter Axelburg for @BillingCity, 12/01/2015 for @StartDate, and 12/31/2015 for @EndDate. Click OK.
9. After viewing the result set, click OK to exit the Query Designer window.
Task Notes You have now added three parameters to the WHERE clause of the SELECT statement. Only rows where the City column has a value equal to the value of @BillingCity will be displayed in the result set. When you ran the query in the Query Designer just now, you gave the @BillingCity parameter a value of Axelburg. Therefore, only rows with Axelburg in the City column were included in the result set. Notice the parameters are now displayed in the Parameter pane above the layout area. (If you are using Report Builder, you may have to go to the View tab of the ribbon and check Parameters to see the Parameter pane.)
One of the trickiest things about working with datetime data types in SQL Server is remembering that they consist of both a date and a time. The RunDate field we are working with here is a datetime. When the invoice batches are run at GDS, the invoicing program assigns both the date and the time the batch was run. For instance, batch 447 was run on 12/31/2015 at 7:54:49 P.M. It has a value of 12/31/2015 7:54:49 P.M. stored in its RunDate column by the invoicing program.
When a user is asked to enter a date, most of the time, they enter the date without a time. When you were asked for a value for @EndDate, you entered 12/31/2015, without any time specified. Because SQL Server is dealing with a date and a time together, it adds on a time value for you. The default value it uses is 00:00:00 A.M., which is midnight. Remember, midnight is the start of the new day. This means when you’re comparing datetime values, midnight is less than any other time occurring on the same day.
Let’s think about the comparison created in the WHERE clause involving @EndDate. Assume, for a moment, that instead of using RunDate < DATEADD(dd, 1, @EndDate), we used the more obvious RunDate <= @EndDate. When the user enters 12/31/2015 for the end date, they expect the result set to include batches run on 12/31/2015. However, when SQL Server compares the value of RunDate (12/31/2015 7:54:49 P.M.) with the value of @EndDate (12/31/2015 00:00:00 A.M.), it finds that RunDate is not less than or equal to @EndDate. This is because 7:54:49 P.M., the time portion of RunDate, is greater than 00:00:00 A.M., the time portion of @EndDate. Batch 447 would not be included in this result set.
To include batches that occur on the day specified by @EndDate, you need to use RunDate < DATEADD(dd, 1, @EndDate). What this expression does is add one day to the value of @EndDate and check to see if RunDate is less than this calculated value. Let’s look at our example with Batch 447. This time, SQL Server compares the value of RunDate (12/31/2015 7:54:49 P.M.) with the calculated value (12/31/2015 00:00:00 A.M. + 1 day = 1/1/2016 00:00:00 A.M.). Now it is true that RunDate is less than our calculated value, so Batch 447 is included in the result set.
Steps for SSDT, Visual Studio, and Report Builder
1. The accounting department wants to be able to select a value for the @BillingCity parameter from a list of billing cities. You need to create a second dataset in the report that provides that list for the users. Right-click the Datasets folder in the Report Data window, and select Add Dataset from the context menu.
2. Type BillingCities for the Name.
NOTE
Make sure you type BillingCities without a space between the two words. Spaces are not allowed in dataset names.
3. Select the Use a dataset embedded in my report radio button.
4. Select Galactic from the Data source drop-down list.
5. Based on what you learned in Chapter 3, we’ll compose the query for this dataset without the Query Designer. We want a list of all the billing cities for GDS customers. It also makes sense that each city name should only show up once in the list. In the Query text box, enter the following SQL statement:

6. The Dataset Properties dialog box appears as shown.
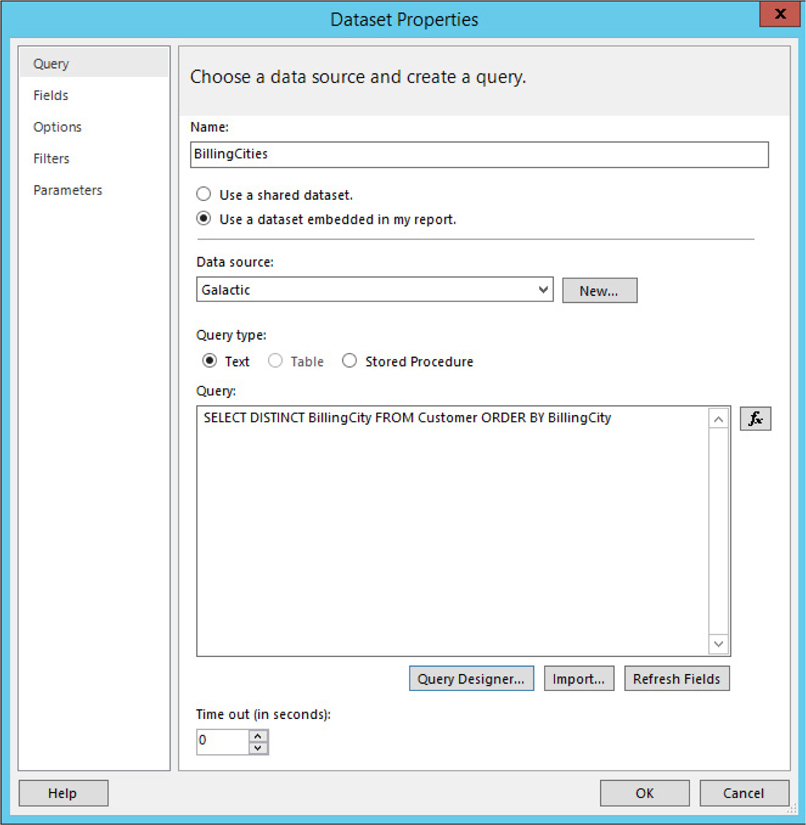
7. Click OK to exit the Dataset Properties dialog box.
Task Notes Remember, the word DISTINCT means we want SQL Server to remove duplicates for us. The result is a list with one row for each Billing City.
Steps for SSDT, Visual Studio, and Report Builder
1. Expand the Parameters folder in the Report Data window.
2. Double-click the BillingCity parameter entry in the Report Data window.
3. Type Select a City in the Prompt field. This is the prompt the user sees when running the report.
4. On the Available Values page, select the Get values from a query radio button. This lets you use the BillingCities dataset to create a drop-down list.
5. From the Dataset drop-down list, select BillingCities.
6. From the Value field drop-down list, select BillingCity. From the Label field drop-down list, select BillingCity. The Value field determines what value is assigned to the parameter. The Label field determines what the user sees in the drop-down list when selecting a value. In this case, they are one and the same thing.
7. On the Default Values page, select the Specify values radio button.
8. Click Add. Type Axelburg in the text box for the Value. This serves as the default value for the Billing City parameter. The Report Parameter Properties dialog box should now look like the illustration.
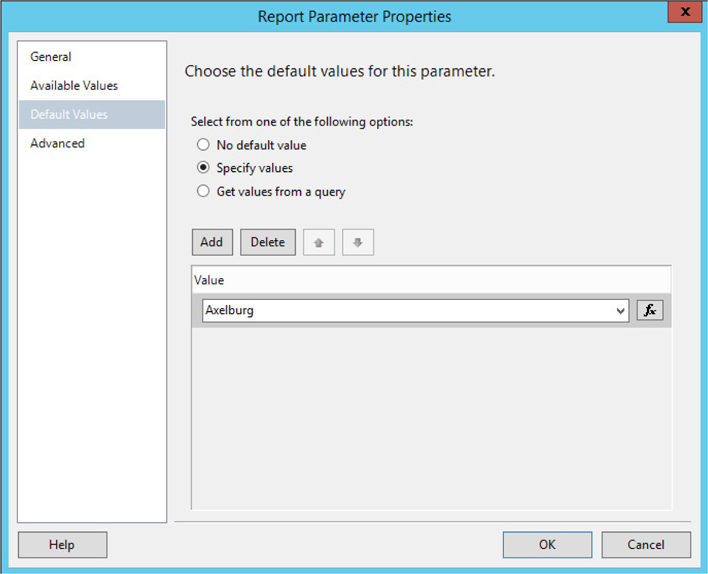
9. Click OK to exit the Report Parameter Properties dialog box.
10. Double-click the StartDate entry in the Report Data window. The Report Parameter Properties dialog box appears.
11. Type Enter a Start Date in the Prompt field.
12. Select Date/Time from the Data type drop-down list.
13. Click OK to exit the Report Parameter Properties dialog box.
14. Double-click the EndDate entry in the Report Data window. The Report Parameter Properties dialog box appears.
15. Type Enter an End Date in the Prompt field.
16. Select Date/Time from the Data type drop-down list.
17. Click OK to exit the Report Parameter Properties dialog box.
18. If you are using SSDT or Visual Studio, click the Preview tab. If you are using Report Builder, click the Run button.
19. The prompts for the three report parameters appear at the top of the preview area. No report is displayed until a value is entered for each parameter. Axelburg is selected from the Select a City drop-down list because you made this the default. Type or use the date picker to select 12/01/2015 for Enter a Start Date. Type or use the date picker to select 12/31/2015 for Enter an End Date.
20. Click View Report. The report, based on the parameter values you entered, now appears. The report, with all the rows and columns expanded, is shown here.
In SSDT and Visual Studio, you can change the size of the Solution Explorer window, the Report Data window, and the other windows around the outside of the Report Designer to make more room in the center for your report. Just click the separator between the window and drag in the desired direction.
21. Click the Save button in the toolbar.
Task Notes When you exited the Query Designer after adding parameters to your query, the Report Designer created a corresponding report parameter for each query parameter. When the report is viewed, the values entered for the report parameters are automatically passed on to the query parameters before the query is executed. In this way, the user can enter information and have it used in the WHERE clause of the SELECT statement to affect the contents of the report.
The Report Parameters dialog box enables you to control the user’s interaction with the report parameters. You can change the prompts the user sees. You can specify the data type of a parameter. You can even determine the default value for a parameter.
One of the most powerful features of the Report Parameters dialog box is the capability to create a drop-down list from which the user can select a value for a parameter. In many cases, the user will not know these values, such as department codes, part numbers, and so forth, without looking them up. This capability to enable the user to select valid values from a list makes the reports much more user friendly.
You have now seen what the Report Wizard can do for you. It can provide you with a great starting place for a number of reports. However, the Report Wizard does have its limitations and, in most cases, you need to make additions to the reports it generates before they are ready for the end user. In the next chapter, you begin learning how to make those enhancements. In addition, you learn how to create reports without the aid of the Report Wizard.