THE OBAMA WHITE HOUSE believes in the power of the presidential pulpit. More importantly, it believes that the president is an irresistible persuader. According to the president’s top counselor, David Axelrod, “I don’t think there’s been a President since Kennedy whose ability to move issues and people through a speech has been comparable.”1 This faith in presidential persuasion underlies the administration’s decision to try to move a large agenda simultaneously and explains its response to political problems.
It also underlies the president’s views of party leadership. He wants to transcend partisan distinctions, rather than make them permanent. As one of his pollsters put it, “It gets back to being a transformational leader. A party leader isn’t about transformation.” The president typically declines to speak at the traditional Jefferson-Jackson dinners where state Democratic parties gather to raise money from the faithful. He prefers venues where he can reach voters who are not party regulars.2 In other words, he has been more interested in persuasion than in mobilization of the already converted.
When times get tough, Obama goes public.3 In the campaign season, he confronted the issue of Jeremiah Wright’s incendiary comments with an extended address on race relations. When the White House encountered resistance to its stimulus program, the president held his first prime-time press conference. Rather than attempting to persuade individual members of Congress on his record-setting FY 2010 budget, he traveled outside Washington, appearing at town hall meetings, news conferences, and on late-night talk shows.4 When support for health care reform was falling, the president delivered a prime-time televised address before a joint session of Congress. And when the president made his decision to send 30,000 additional American troops to Afghanistan, he delivered a prime-time televised address from West Point.
The history of the presidency clearly shows that expectations of transforming politics and creating opportunities for change through rhetoric and other public relations efforts are likely to be disappointed. Nevertheless, every president operates in a unique context and analysts must account for it. In chapter 1, I analyzed the climate of public opinion in the early Obama presidency and predicted that he was unlikely to enjoy substantial long-term success in moving the public in his direction, despite his impressive public relations skills. Issues that have ideological overtones should prove a tough sell, especially during periods of highly polarized politics. Polarization, of course, leads us to expect considerably more support from Democrats than Republicans on most issues, and more responsiveness as well.
In this chapter, I focus on some of the major policy initiatives of the Obama administration to determine whether the president was able to move the public in his direction to create opportunities for change. These policies include the bank bailout, stimulus plan, automobile company bailout, and limiting executive pay, as well as more general aspects of spending and economic policy. I also examine opinions on health care reform, climate change, increasing troop levels in Afghanistan, and closing the prison at Guantánamo Bay. Finally, because of the critical role of party support in the Obama presidency, I look at the changes in party identification and evaluations.
The new president had little choice but to give priority to the economy. With both banks and mortgages failing at an alarming rate, unemployment rising rapidly, and automobile companies teetering on the verge of bankruptcy, Obama had to act and act fast. Programs designed to deal with unemployment are not inherently unpopular. Moreover, it seemed reasonable to conclude that in a time of severe economic crisis, when Americans were seeking reassurance from the White House, the public would defer to the president.
On the other hand, many of the economic policies of the early Obama administration dealt with fundamental questions regarding government intervention in the economy. The policies were also extraordinarily expensive, resulting in massive deficit spending. In light of our findings in chapter 1, we should expect that these policies would be polarizing, with many in the public finding them deeply troubling. Some of the proposals also seemed to reward those who had caused the financial crisis in the first place, irritating almost everyone.
The White House was under no illusion that “bailouts” would be popular. As Joel Benenson, Obama’s lead pollster, put it,
These were not matters of choice. . . . None of these reflect an agenda he campaigned on and, in fact, in doing a lot of them, he was very cognizant of the fact that they had big political downsides, that they weren’t popular with the American people.5
Senior presidential advisor David Axelrod went further:
Believe me, if we were charting this administration as a political exercise, the first thing we would have done would not have been a massive recovery act, stabilizing the banks and helping to keep the auto companies from collapsing. Those would not even be the first hundred things he [the president] would want to do.
But, he added, the president, confronted with “breathtaking challenges,” did not have the luxury of moving more slowly or methodically.6
The financial crisis had not abated by the time of the 2008–2009 presidential transition, and President Bush, accommodating a request from President-elect Obama, formally asked for the release of the remaining half of the Troubled Asset Relief Program (TARP) funds to help stabilize the financial sector. Congress had written the law so that it required releasing the funds fifteen days following a presidential request unless Congress passed a resolution blocking their release. A number of congressional leaders, including both Democrats and Republicans, threatened to do just that, citing concerns that the Obama administration needed to be much more explicit about what is going to be done with the second half of the appropriated TARP money. These concerns in part reflected criticism that spending of the first half of the TARP funds was badly mismanaged, and were also a response to a wave of populist anger that had been building since the Treasury Department first proposed Wall Street bailouts in September. Obama made a personal trip to Capitol Hill to lobby for release of the funds and to provide more details about how he intended to spend the money.
In general, the threat of blocking the release of the TARP funds appears to be one with which the average American was sympathetic. The president-elect met resistance, even in the midst of high approval for his performance during the transition. The public did not defer to Obama. Given three choices of what to do with the remaining funds, 62 percent, including majorities of Democrats as well as Republicans, said Congress should block the release unless Obama provided even more details about how he would spend the funds, and another 12 percent replied that Congress should block the funds entirely. Only 20 percent favored Congress’ simply allowing the release of the funds.7
In February, with Obama in the White House, opinion was decidedly negative regarding the bank bailout. Only 39 percent favored “giving aid to U.S. banks and financial companies in danger of failing.” Fifty-nine percent of the public were opposed.8 By March, 41 percent of the public adopted the extreme option and were willing to allow the nation’s largest banks to go out of business rather than give them any funds.9
By January 2010, the public overwhelmingly believed that the benefits of the unprecedented federal spending were accruing mostly to large banks, major corporations, and wealthy individuals, but not to average people (see table 3.1). In April, a plurality of the public felt the loans to troubled banks did not prevent a more severe crisis.10 (The president knew it would be difficult to prove the counterfactual of what the economy would have been like with no bailouts.)11 Throughout 2009 and 2010, the public thought the bank bailout was a bad idea.12
TABLE 3.1.
Beneficiaries of Economic Policies
Beneficiary |
% Agreeing |
|
|
Banks and investment companies |
40 |
Major corporations |
20 |
Wealthy individuals |
16 |
Middle-class individuals |
9 |
Low-income individuals |
8 |
No one |
2 |
Don’t know/refused |
5 |
|
|
Source: Allstate/National Journal Heartland Monitor poll, January 3–7, 2010.
Question: “Who do you think has benefitted most from the federal government’s response to the financial crisis over the last 12 months?”
Subsidizing banks was one thing. Regulating them was something else. The same anger at financial institutions that underlay opposition to bailing them out supported restricting their activities. Throughout 2009 and 2010, the public supported the principle of stricter government regulations on major financial companies and institutions.13 No White House efforts to influence public opinion were necessary to convince the public it did not want a repeat of the financial meltdown of 2008.
Perhaps because of its complexity, there was limited polling on the legislation regulating financial institutions that finally passed Congress in July 2010. Polls taken in the late spring and early summer found that majorities favored the bill.14
Nevertheless, a plurality thought the legislation did more to protect the financial industry than consumers.15 Moreover, at the time the financial regulation reform bill passed Congress, only 44 percent of the public approved the way the president was handling regulation of the financial industry, while 50 percent disapproved. Majorities of Republicans (81 percent) and Independents (53 percent) gave Obama negative reviews.16
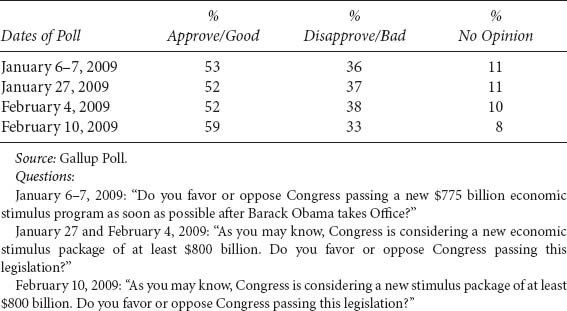
The president’s first major initiative once in office was a $787 billion economic stimulus package. Obama addressed the stimulus issue before a nationwide audience at his first prime-time news conference and conducted town hall meetings in Elkhart, Indiana, and Fort Myers, Florida, as part of his efforts to help sell the public on the urgency of passing a stimulus package. Unsurprisingly, conservative media personalities offered up blistering critiques.
TABLE 3.2.
Support for Stimulus Plan
On January 27, 2009, the day before the House voted on his stimulus plan, in the midst of an historic economic crisis, after an extensive public relations effort by the White House, and in the glow of the presidential honeymoon, the Gallup Poll found that only 52 percent of the public favored Congress passing the bill. Although 73 percent of Democrats favored passage, less than half of the rest of the country agreed—only 46 percent of Independents and 29 percent of Republicans.17 Moreover, public opinion on the stimulus bill was virtually identical to where it stood three weeks earlier18 (see table 3.2). The public had not moved in the president’s direction. A week later, the public still had not moved.19
At the end of January, Gallup asked whether people supported the president’s stimulus plan as Obama proposed it, wanted “major changes,” or wanted Congress to reject it altogether. Only 38 percent of the public supported passing Obama’s stimulus plan as he proposed it, while 54 percent wanted it passed with “major changes” or rejected altogether. Support was tepid even among Democrats, of whom only 59 percent supported passage of the plan as Obama proposed it. Only 37 percent of Independents and 13 percent of Republicans joined them. Forty percent of Independents wanted major changes. Even worse, 62 percent of those following the issue “very closely” (31 percent of the public) favored major changes or rejection of the plan, while 50 percent of those “following somewhat closely” (26 percent of the public) held that view. The president’s support was greatest among those who were not paying much attention.20
Near the end of Congress’s consideration of the bill (it cleared Congress on February 13), Pew asked the public about “the economic stimulus plan being proposed by the President.” It found that 51 percent of those who had heard about the plan said it was a good idea, while 34 percent said it was a bad idea. This support was down from 57 percent of those who had heard about the proposal viewing it positively, compared with just 22 percent who viewed it negatively, three weeks earlier. In February, support for the fiscal stimulus proposal was much lower than it was in January among those who have heard “a lot” about the economic stimulus (representing 46 percent of the public in February). Support among this group dropped from 63 to 49 percent, while opposition increased from 25 to 41 percent. Among those who had heard only a little about the plan (45 percent of the public in February), support decreased only 1 percentage point, from 53 to 52 percent, while opposition increased from 21 to 28 percent.21 The CBS News/New York Times Poll also found that support for the stimulus bill dropped between mid-January and early February, where it stood at just 51 percent.22
There is one bit of evidence of presidential success in moving the public. In a poll on February 10, Gallup found that 59 percent of the public supported the stimulus bill (table 3.2). Whether this uptick in support was the result of the president’s prime-time press conference the previous evening or was the product of the volatile nature of one-day polls is unclear. Gallup reported that most of the newfound support for the bill came from Democrats, who increased their support from 70 percent a week earlier to 82 percent.23 Perhaps preaching to the choir paid off.24
Whatever the nature of the opinion in February, Americans soon had reservations about the economic stimulus plan. In August, 51 percent of the public, including most Republicans and Independents, said it would have been better for the government to have spent less money to stimulate the economy. In addition, a substantial proportion of the public (46 percent) said they were “very worried” that money from the economic stimulus plan was being wasted. Only 20 percent said they were not worried about wasteful stimulus spending. The public also harbored doubts about the effectiveness of the stimulus plan. Fifty-seven percent of the public thought the plan was having no effect or was making the economy worse. Whether or not the White House wanted to consider a second stimulus bill, the public served as a serious constraint, with 65 percent opposed, including 67 percent of Independents.25
The administration felt it was acting responsibly, but the country was not listening. The stimulus bill preserved jobs in state and local governments, but the preservation of jobs is inherently not particularly visible. The tax cuts did not arrive in notable single checks (which tend to be saved) but rather in small amounts in paychecks. The White House established a board to guard against waste and corruption, but this action had the consequence of slowing down the awarding of contracts, slowing the impact of the stimulus in the process.
Thus, the public was even less supportive as time went on. In January 2010, 56 percent of the public opposed the stimulus bill while only 42 percent favored it.26 The following April, only 33 percent of the public felt the stimulus bill had helped the job situation.27 By September 2010, 66 percent of the public thought the bill had made the recovery worse or had had no impact.28 “There is real power there,” White House senior advisor David Axelrod said of the president’s public relations efforts. “But it’s not a magic wand. The bully pulpit does not put people to work.”29
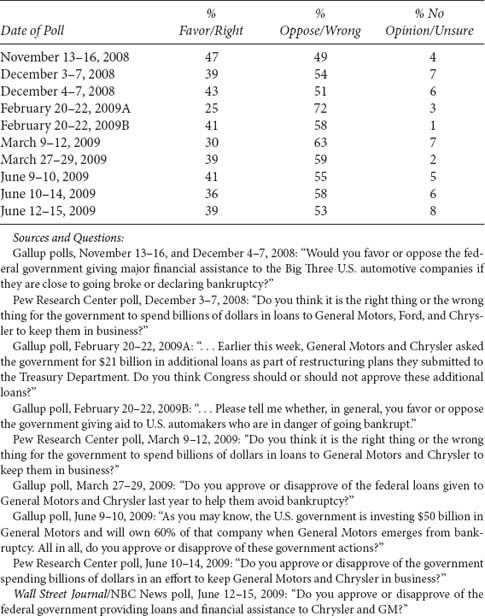
In December 2008, the federal government gave General Motors and Chrysler $17 billion in loans to keep them from going bankrupt. In February 2009, the automakers asked for more than $21 billion in additional loans as part of restructuring plans they submitted to the Treasury Department. In April, the Obama administration lent each automaker additional funds, and on June 1, the federal government announced that it was loaning General Motors $50 billion and would become the majority owner of the company.
The New York Times reported that Obama and his aides had “enormous faith in his capacity for communicating with the American people.” When his advisors warned of a popular backlash against the auto bailout, he expressed confidence that he could explain it to the public.30 It appears that the president was overly optimistic. Gallup reported that Americans were “remarkably well-informed” about the financial status of the Big Three U.S. automakers. And they did not like what they saw. At no point did a majority of Americans support loans for the automakers (see table 3.3). Moreover, support declined somewhat after Obama became president. At every point, majorities opposed the president. By June 2009, only 41 percent of the public approved of the way Obama was handling “the problems facing the auto industry.”31 In May 2010, 61 percent of the public persisted in the view that the government should not have helped the automakers.32
Polling organizations did not regularly ask questions about support for the president’s stimulus plan once it passed, and they stopped questioning about the automobile company bailout in June 2009. They did continue to inquire about the public’s views of the consequences of these policies, however. The extraordinary costs of the stimulus plan and the banking and auto-industry rescue packages dramatically increased the federal deficit, which was already mounting during the Bush administration. It is hardly surprising that Americans appeared to be suffering from sticker shock. Alarmed at the amount of government expenditures to boost the economy, by early summer a clear majority of the public felt the government should focus more on reducing the deficit than on stimulating the economy.33
TABLE 3.3.
Support for Loans to Automakers
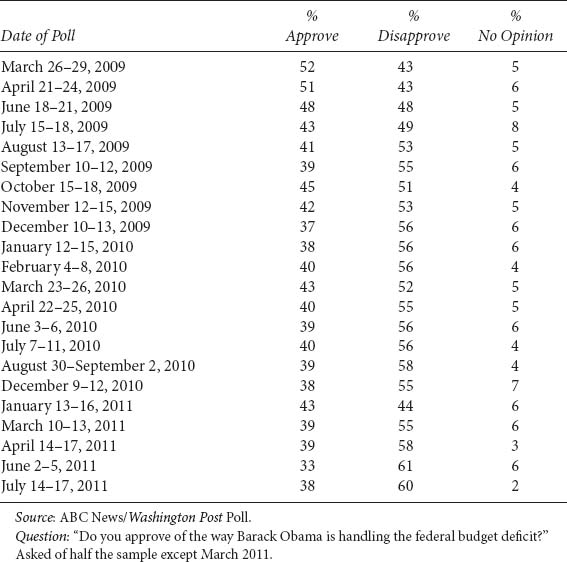
It is logical to expect that the public would not only be wary of the president’s spending policies, but that they would disapprove of his handling of the deficit as well. By July 2009, a clear plurality, followed soon by a majority, of the public disapproved of Obama’s handling of the deficit issue (table 3.4). This lack of support was not a momentary blip in opinion. The president has suffered majority disapproval ever since.
TABLE 3.4.
Obama Handling of the Deficit
There was one Obama policy related to the economy that the public clearly supported. There had been considerable public anger over executives who received large paydays while their companies teetered on the brink of collapse and required government money to survive. The most prominent example of taxpayers subsidizing wealthy executives occurred when many top executives at the insurance company AIG, the recipient of the largest amount of government bailout money, received substantial bonuses. In conjunction with the economic stimulus legislation, the Treasury Department put limits on the pay of executives at companies receiving federal bailout money. A federal “pay czar” had to approve their pay plans, and their bonuses could be no greater than one-third of their total compensation. Most Americans (59 percent) endorsed government action to limit executive pay at major companies.34
Overall, the president maintained general support for his handling of the economy for seven months, despite a severe recession. He was helped, of course, by the fact that most people blamed George W. Bush and Wall Street for the economic downturn.35 By November 2009, however, he was below 50 percent approval (see table 3.5), sinking below 40 percent approval in October 2010 and the first half of 2011.
The biggest legislative battle of the early Obama administration was health care reform. Substantially changing any policy that dealt with 17 percent of the nation’s GDP was going to be difficult. Doing so in a context of highly polarized partisan politics, enormous budget deficits, and broad skepticism about government activism only made matters worse for the White House. Nevertheless, the president forged ahead. He faced stiff opposition from the beginning. Republicans had found their voice in opposing his stimulus bill and budget and did not hesitate to mobilize against the Democrats’ health care proposals.
Despite the president’s efforts to address the public’s misgivings in speeches, news conferences, town hall-style meetings, and interviews, the public did not respond. Instead, it displayed a lack of support for Obama and what the public perceived as his health care plan. It is true that he did not endorse a specific health care plan from among the many bills working their way through House and Senate committees during the spring and summer of 2009. It is possible that some well-informed Americans might have trouble answering a question about “Obama’s plan.” Nevertheless, we have seen that he was actively advocating health care reform in this period. Table 3.6 gives us a general sense of Americans’ impressions of whatever they believed his plan to be.
The NBC/Wall Street Journal poll question is especially appropriate for our use because it offered “no opinion” as an option. Opinions were likely to be soft early in the summer because few Americans were closely following the debate on health care until July. June’s CBS/New York Times Poll, for example, found only 22 percent of Americans saying they have heard or read “a lot” about the health care reform proposals.36 By late July, the public had become more attentive to the issue. Pew found that health care reform had become the story named most often (31 percent) as the news story Americans said they were following most closely, with 44 percent of the respondents saying they were following it “very closely.”37 In a separate survey, it found that stories about health care filled 25 percent of the news hole.38
TABLE 3.5.
Obama Handling of the Economy
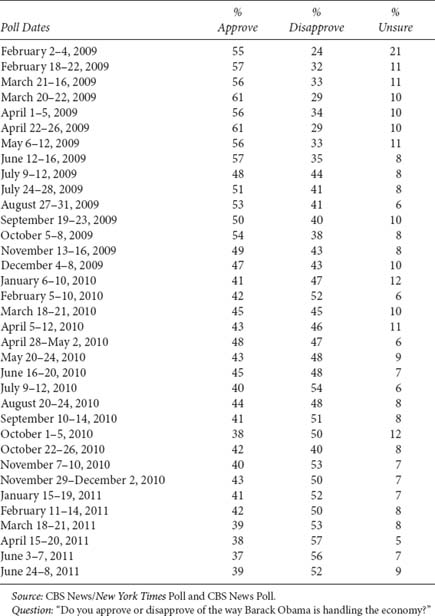
TABLE 3.6.
Support for Health Care Plan
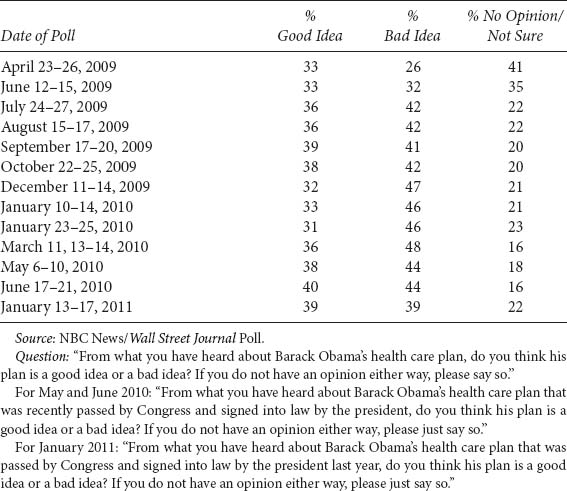
Two significant trends emerge from the data in table 3.6. First, there was a substantial decrease (19 percentage points) in the percentage of the public with no opinion on the issue between April and July. Second, although support held steady over the period, there was a substantial increase (16 percentage points) in opposition to what people perceived to be Obama’s plan. Although we do not have a panel study, it appears that those who formed opinions over the three months from April to July, when debate heated up on health care reform, moved overwhelmingly to opposition.
TABLE 3.7.
Support for Health Care Plan
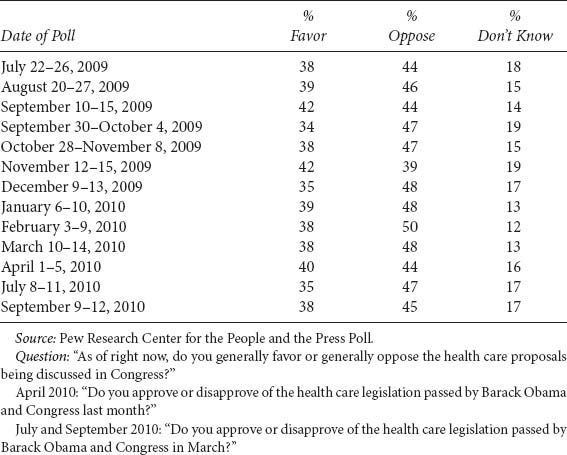
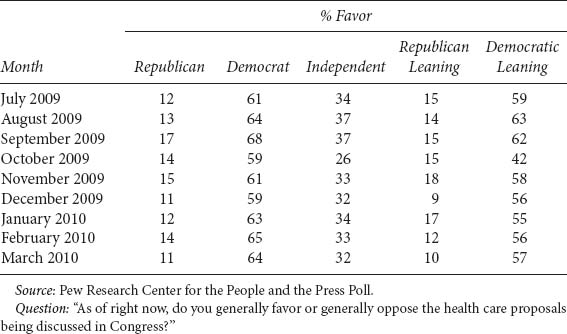
Table 3.7 displays the results of the Pew Research Center for the People & the Press Poll regarding support for the health care proposals in Congress. The results are similar to those in table 3.6. Disaggregating the results (table 3.8) shows that support for the health care reform bills under consideration in Congress was highly polarized, with few Republicans and Republican leaners in support. Other major polls had similar findings of plurality opposition to the bills and majority support only among Democrats.39 Worse for the president, a third of Democrats and more than 40 percent of Democratic-leaning Independents did not support the bills. Only a third of Independents supported the bills, although a solid majority had supported the principle of health care reform in late 2008.40
Despite the lack of support for reform in general, the public did favor a number of the provisions advocated by the administration. The option of a public plan (run by the government) that would compete with private plans, expanding government plans to cover low-income Americans, and requiring insurance companies to cover everyone regardless of preexisting conditions, found majority support. The public also agreed with a number of different ways of paying for health care reform, including raising taxes on those making over $280,000 a year, requiring employers to pay a fee if they did not provide health insurance, and offering tax credits to help some people pay for health insurance. The public did not support taxing costly private insurance plans or reducing payments to Medicare providers such as doctors and hospitals.41
TABLE 3.8.
Partisan Support for Health Care Plan
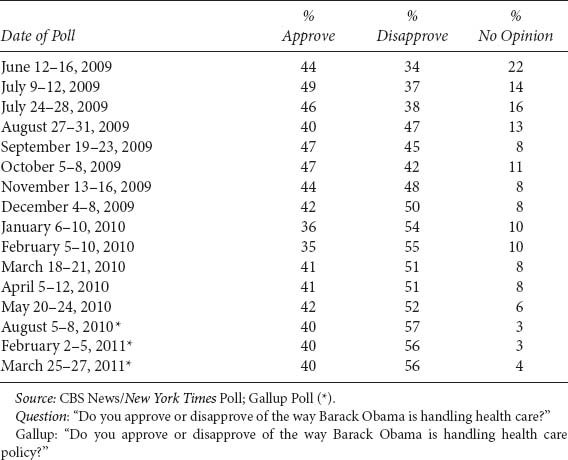
The public’s evaluations of the president’s handling of health care mirrored the erosion of support for his proposals. As table 3.9 shows, at least by June 2009 Obama received less than majority approval—and he never recovered. The decrease in his rating on health care was particularly notable among Independents. By August, a plurality of the public disapproved of the president’s handling of health care, and majorities have continued to disapprove. Using an almost identical question, Gallup found similar ratings to the CBS News/New York Times Poll.42
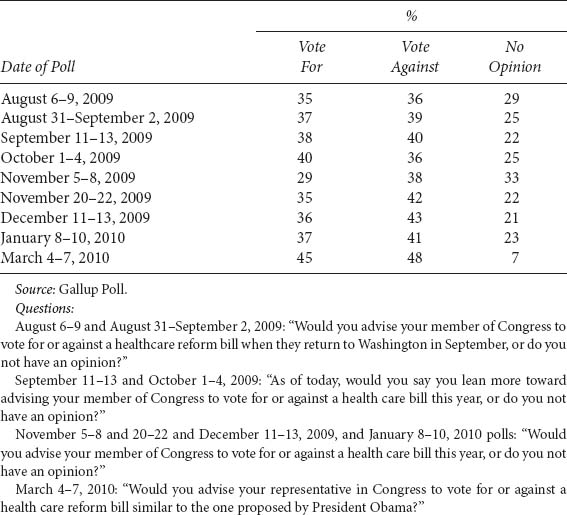
The ultimate goal of the White House’s effort to obtain public support was to use it to move Congress. Table 3.10 shows that the president was not successful. With the exception of the early October poll, there was always a slight plurality of the public who wanted their member of Congress to vote against health care reform.43 The table also shows that there was no change in the advice the public would offer their member of Congress regarding voting for a reform bill following the president’s national address on the subject. Thirty-eight percent said they would advise their member of Congress to vote for a bill, 40 percent would advise a “no” vote, and 22 percent did not have an opinion. For seniors, the figures were worse for the president, with 32 percent advising support and 42 percent opposition.44 The inability to reassure seniors was perhaps the greatest setback in the entire health care debate for the White House.
TABLE 3.9.
Approval of Obama’s Handling Health Care
The role of the context in which consideration of health care reform occurred is clear. The results in tables 3.6–3.10 reflect considerable stability in opinion, especially after the debate on health care reform heated up in the summer. Partisanship is part of the answer. It appears that Republicans and Democrats reached decisions early in the process and stuck to them. In ad-dition, Americans seemed to focus more on the ideological underpinnings of health care reform than on the details of proposals. Gallup found that supporters generally favored a new law because they wanted to expand coverage to the uninsured. Opponents were most likely to say they were against a new law because of worries about increased government involvement in health care.45
We saw in chapter 2 that to try to stem the tide of opposition to health care reform, the president gave a nationally televised evening address before a joint session of Congress on September 9, 2009.46 Because it was so central to the White House’s efforts to obtain public support for its initiative, the impact of the speech bears closer scrutiny.
TABLE 3.10.
Advice to Member of Congress on Health Care Bill
A small poll with a large margin of error on the evening of the speech found that about one in seven people who watched the speech changed their minds about Obama’s health care plan. Going into the speech, a bare majority of his audience—53 percent—favored his proposals. Immediately after the speech, the percentage in favor rose to 67 percent, with only 29 percent opposed. (Bill Clinton got similar numbers after his 1993 address to Congress, but five months later a majority of the country no longer supported his plan.) It is important to note that 45 percent of the viewers of the speech were Democrats and only 18 percent were Republicans, substantially over-representing the former and under-representing the latter.47 The day after the president’s speech, the CBS News Poll re-sampled 678 persons first questioned in a poll conducted August 27–31, 2009, and found a 12-point increase in approval for Obama’s handling of health care after his speech, moving from 40 percent to 52 percent approval. These findings were the good news.
Gallup found no change in the approval of the president’s handling of health care but an increase to majority disapproval (52 percent).48 The Washington Post-ABC News Poll found only a 2 percentage point change in views of the president’s handling of health care (see table 3.5) and just a one-point improvement in support for the president’s plan over that found in a poll conducted in mid-August (although those “strongly opposed” decreased by 4 percentage points, and those with “strongly support” increased by 3 percentage points). Opposition still exceeded support by 48 to 46 percent.49 Similarly, Pew found support for the health care proposals being discussed in Congress rose 3 percentage points to 42 percent, but 44 percent still opposed them (table 3.6). This support fell 8 percentage points within the next three weeks.
The increase in Obama’s health care numbers was principally the result of more Democrats rallying around his reform plan. Preaching to the choir is of some benefit. In August, 62 percent of Democrats thought Obama’s plan was a good idea; in September, 69 percent believed that.50 However, even choir members have lapses. Pew found that Democratic support dropped sharply by early October, as did the support of Democratic-leaning Independents (table 3.7).
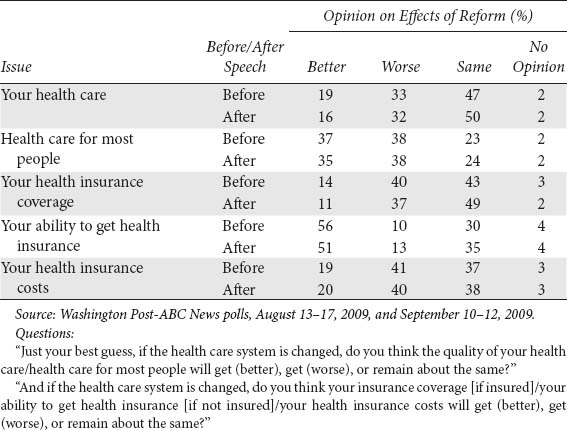
Americans’ views of how reform would alter their health care, the health care of others, their health insurance coverage and costs, and their ability to obtain health insurance were little changed after the president spoke (see table 3.11). Indeed, in most instances their views were slightly more negative after the speech, and pluralities were in the direction of “worse off” for all questions except ability to obtain health insurance.
Moreover, a majority of all adults still were not sure the president had clarified what reform would mean. Before the speech, just 33 percent said Obama had clearly explained his plans for reform. That number rose to 42 percent afterward, but 43 percent still said he had not clearly explained his plans. All of the improvement on this question came from those who watched the speech. Fifty-eight percent of those who watched the speech said the president had explained his plans, up from 40 percent before the speech. But among those who did not watch, only one in four said he had explained his plans—the same percentage as before the speech.51 A poll ending two weeks later found that 55 percent of the respondents felt the president had not clearly explained his plans for reform.52
A 45 percent plurality said the reform plan would create too much government involvement in the system. Worse, 40 percent thought reform would weaken Medicare, a figure that rose to 56 percent among seniors, who remained solidly opposed to health care reform. Even worse yet, 54 percent of the respondents said the more they heard about Obama’s health care plan, the less they liked it.53
Americans remained skeptical that the president’s health care plan would be able to accomplish all he intended—to expand coverage to nearly all Americans without raising taxes on middle-class Americans or diminishing the quality of care. Only 38 percent of the public, including 66 percent of Democrats, believed his plan would achieve all of these goals, while 60 percent, including 64 percent of Independents and 90 percent of Republicans, disagreed. The speech apparently failed to reassure a third of Democrats. Similarly, 56 percent of the public were not confident that Obama’s plan could be paid for mostly through cost savings in Medicare and other parts of the health care system.54
TABLE 3.11.
Opinion of Health Care Proposal Before and After Obama’s Health Care Address
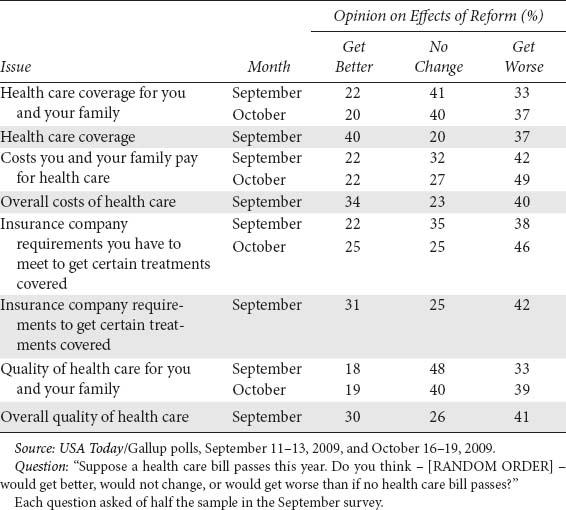
On a more basic level, following Obama’s speech Americans did not expect health care legislation to improve their personal health care or the overall U.S. health care system in a number of areas—including quality, coverage, cost, and insurance company requirements for procedures to be covered (see table 3.12). For seven of the eight questions in the table, more people predicted health care legislation would make the situation worse rather than better. Overall health care coverage was the only exception.55 Moreover, opinion about the effects of health reform became more negative in October.
On January 19, 2010, the president’s 365th day in office, the White House received what appeared to be a severe setback in its efforts to pass health care reform. The president had traveled to Massachusetts the previous weekend to campaign for Martha Coakley, the Democratic candidate in the special election to fill Edward Kennedy’s Senate seat. On Election Day, however, Republican Scott Brown won a decisive victory, leaving the Democrats one vote short of a filibuster proof majority in the Senate. The irony of Kennedy’s replacement killing the chances of the Senate compromising with the House on major health care reform was coupled with the fact that the public in one of the most liberal and reliably Democratic states in the union had rejected the president’s plea for support.
TABLE 3.12.
Expectations of Health Care Bill, September and October 2009
In a poll taken the next day, Gallup found that 55 percent of Americans, including 56 percent of Independents, favored Congress suspending work on the current bills and considering alternative bills that could receive more Republican support. Sixty-five percent felt health care reform should not be the top priority on the policy agenda.56 The White House seemed to agree and began to reframe the administration by focusing on the economy and reform of the financial services industry.
The administration would not give up on health care reform, however, and kept looking for openings. The president held a televised summit that included congressional Republicans on February 25, 2010. The public did not expect the summit to lead to an agreement, and if one was not reached, by a 49 percent to 42 percent margin it opposed Congress passing a health care bill similar to the one proposed by President Obama and Democrats in the House and Senate. By a larger 52 percent to 39 percent margin, the public also opposed the Democrats in the Senate using a reconciliation procedure to avoid a possible Republican filibuster and pass a bill by a simple majority vote.57
Despite all his and his administration’s efforts, the president never obtained majority—or even plurality—support for health care reform. He could not create an opportunity for change, especially in the context of a severe recession and his policies for dealing with it. Public opposition to those policies, an inherent skepticism of government programs, and a complex policy that was difficult to explain and easy to caricature all worked against the president. Despite these context-specific obstacles to leading the public, we should not forget the general principle that the president cannot depend on winning public support for his initiatives.
In the end, the president did achieve an historic victory on health care reform (which I discuss in chapter 5). One of the most notable aspects of the bill was that it was perhaps the least popular major domestic policy passed in the last century. A CBS News/New York Times poll taken right before the House voted to pass the Senate bill in the late evening of March 21, 2010, showed only 37 percent of the public (including 13 percent of Republicans and 30 percent of Independents) approved the bill while 48 percent of the public opposed it. A Gallup Poll taken on March 26–28, 2010, found that by a margin of 40 percent to 22 percent, Americans expected their own health care situation to be worse rather than better because of the bill, and by 45 to 42 percent, they expected the U.S. health care system to be worse off as well.
In the following months, opinion on the bill was stable—and lacking majority support.58 In June, 50 percent of the public favored repealing all or much of the bill.59 In July, only 36 percent of the public approved of the new health care law while 49 percent disapproved.60 An August poll found 56 percent of the public opposing the president’s signature legislative accomplishment.61 In September, only 37 percent approved of the bill, while 49 percent disapproved.62 Days before the new Republican House majority voted to repeal the entire bill in January 2011, Gallup found that 46 percent of the public wanted their representatives to vote for repeal while only 40 percent wished to preserve the law.63 On the first anniversary of its passage, only 46 percent of the public thought the bill was a “good thing,” and a plurality of 44 percent of the public thought it would worsen medical care in the United States.64
In July 2010, Obama engaged in a battle with Republicans over extending unemployment benefits. The GOP opposed the extension if paying for it would require increasing the deficit. Yet the public supported the president’s position, even if it increased the deficit. One poll found 62 percent of the public, including 59 percent of Independents, favored extending benefits, versus only 36 percent who opposed it.65 Another poll found the public in support by a smaller, but nevertheless clear, 52 to 39 percent margin, including half of Independents.66
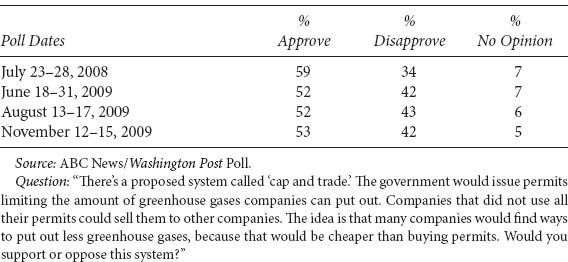
Dealing with climate change has been a signature issue for Barack Obama. To combat global warming, the president and the Democratic congressional leadership proposed a “cap-and-trade” system. Such a system sets a limit on the nation’s emissions of greenhouse gases, then issues or auctions emission allowances that can be bought or sold by individuals, funds, and companies. Over time, the government lowers the cap to reduce the nation’s emissions. Making emitters pay for carbon dioxide, a by-product of burning fossil fuels, provides incentives for developing renewable energy sources and new technologies to limit emissions from coal plants.
Although legislation in support of environmental protection is generally popular with the public, and although there has been broad support for the principle of regulating greenhouse gases,67 debate over the cap-and-trade approach has focused on the cost to the average American of limiting greenhouse emissions. Republicans sharply criticized the proposal as a job killer. Moreover, many of them argued such a policy was unnecessary or at least premature because it was not clear that human activity was the cause of global warming.
The cap-and-trade bill passed the House on a 219–212 vote on June 26, 2009. To succeed in the Senate, the president was going to have to convince the public that there was indeed global warming, that it was a serious problem, and that it was the result of human activity.
In 2009, at least, the president did not make his case (see table 3.13). Although a majority of the public agreed that the earth was warming, there was less support for viewing the problem as very serious or as due to human activity. Moreover, the trends were moving against the president. Indeed, by the autumn, a plurality of 49 percent felt either that there was not global warming or that it was mostly the result of natural patterns in the earth’s environment.68 Gallup found in March 2010 that only 52 percent of the public understood that most scientists believed in global warming.69
TABLE 3.13.
Views on Global Warming
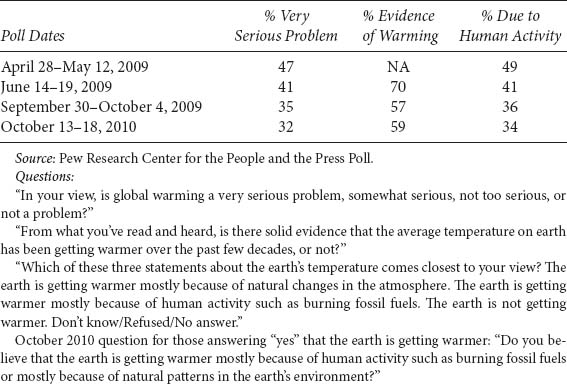
Not unexpectedly, the public’s thinking about global warming had a heavily partisan tinge. For example, in the autumn of 2009, only 35 percent of Republicans, in contrast to 75 percent of Democrats, agreed that the earth was warming. Only 18 percent of Republicans, in contrast to 50 percent of Democrats, felt the warming was the result of human activity. Interestingly, there were big changes in the views of Independents over the summer. In June, 71 percent of them thought the earth was warming, and 47 percent thought this was the result of human activity. By autumn, these figures had decreased to 53 and 33 percent, respectively.70
The cap-and-trade policy itself is quite complicated, and it is not clear how many people understood it.71 The data we do have show that support had declined from the end of the Bush administration yet remained a bare but stable majority through 2009 (see table 3.14). We do know that support for the president’s handling of the global warming issue declined substantially during the year (see table 3.15).
It is also significant that for the first time in the twenty-six years Gallup had been polling on the question, the public preferred economic growth to environmental protection in both 2009 and early 2010. Moreover, the preferences for economic growth strengthened during that period.72 The oil spill in the Gulf of Mexico had the immediate impact of reversing that trend in May, with 50 percent of the public supporting environmental protection over economic growth and 55 percent putting environmental protection ahead of obtaining energy supplies.73 By March 2011, however, the public favored economic development again, and by the largest margin in the nearly three decades of Gallup’s time series.74
TABLE 3.14.
Support for “Cap-and-Trade” Greenhouse Emissions Regulation
Even in the midst of economic crisis, the issue of Afghanistan loomed over the White House. Barack Obama had campaigned on reducing the U.S. presence in Iraq and increasing it in Afghanistan. True to his word, he decided to send an additional 17,000 troops to Afghanistan in February 2009. Sixty-five percent of the American public supported the new president’s decision, including not only 65 percent of Democrats, but also 75 percent of Republicans and 57 percent of Independents. Fifty percent of the public said they would also approve if the president later decided to dispatch an additional 13,000 troops.75 The next month, support for president’s decision fell to 53 percent, while 38 percent disapproved of the troop buildup. Obama obtained the support of 63 percent of Republicans and 55 percent of Independents, but only a 49 percent plurality among Democrats.76
TABLE 3.15.
Obama’s Handling of Global Warming
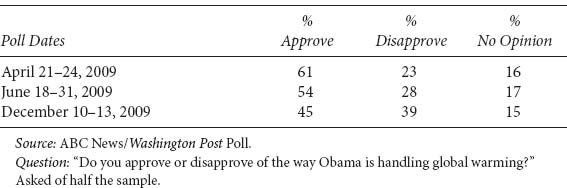
TABLE 3.16.
Support for Troop Increase in Afghanistan
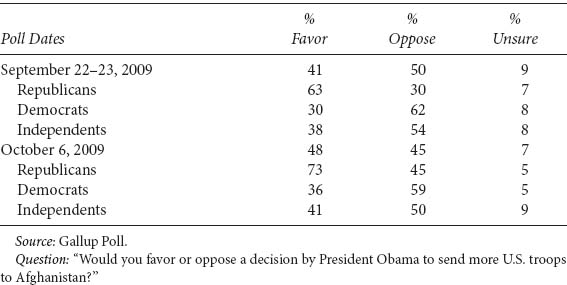
In mid-September, the public learned that General Stanley McChrystal, the commanding general in Afghanistan, had requested 40,000 additional U.S. troops, a recommendation that precipitated a lengthy evaluation by the White House. In the meantime, evidently in response to General McChrystal’s request—the president had not made a decision and thus was not attempting to lead the public—opinion was moving toward sending more troops (see table 3.16). Republicans were particularly responsive, increasing their support for a troop increase 10 percentage points to 73 percent. Democrats lagged, with only 36 percent support in October.
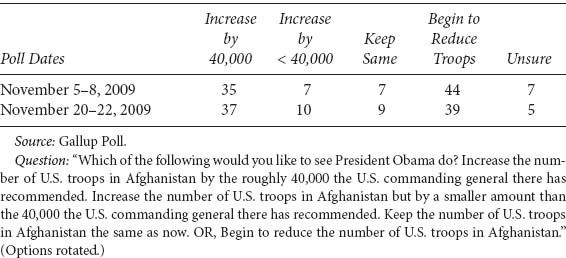
As the country debated the general’s request, less than 40 percent of the public supported complying with it fully, but near the end of November, 47 percent supported at least some increase in U.S. troops. At the same time, substantial segments of the public wanted to begin to reduce the number of American troops in Afghanistan (see table 3.17). Once again, Republicans were much more supportive of increasing the number of troops than were Democrats. In late November, 65 percent of Republicans favored increasing U.S. troop strength by 40,000 troops, but only 17 percent of Democrats shared this view. Support among Independents was only 36 percent.77
On December 1, 2009, President Obama announced in a nationally televised address that he was ordering an additional 30,000 U.S. troops to Afghanistan to bolster the 68,000 already there. A Gallup Poll taken the following day found that 51 percent of the public favored the president’s decisions, a slightly higher figure than the 47 percent who in November supported the basic concept of increasing troops in Afghanistan.78 A CBS News/New York Times poll taken in the aftermath of the speech also found 51 percent in favor of the president’s decision, but 55 percent opposed his decision to set a date for beginning troop withdrawals.79
TABLE 3.17.
Support for Troop Increase in Afghanistan
This modest change in overall support for a troop increase masked significant changes in partisan sentiments, however. In response to a question asking specifically about Obama’s strategy, including references to increasing troops and to the timetable, Democrats (58 percent) and Republicans (55 percent) showed similar levels of support. Independents were at 45 percent. In other words, Democrats rallied around the president while some Republicans moved away. Independent support changed only marginally.80
The wording of the poll probably distorted the responses, however. Both Democrats and Republicans had conflicting views about the troop increase and the timetable for withdrawing them. When Pew asked only about sending more troops to Afghanistan in a poll taken December 9–13, it found something quite different from Gallup. Although 51 percent of the public approved, this total was composed of 65 percent of Republicans but only 45 percent of Democrats and 49 percent of Independents.81
In the wake of the president’s address explaining his decision to escalate U.S. troop levels, public approval of Obama’s handling of the war in Afghanistan increased (table 3.18). The shift reflected a twist on the political polarization that had marked Obama’s first year in office: on the question of overall handling of the situation in Afghanistan, Republicans and Independents rallied behind Obama, while Democrats remained cool to his stewardship of the war. In the CBS News/New York Times Poll, for example, Republicans’ approval increased from 23 to 42 percent while Independents increased from 30 to 45 percent. Democrats changed little, at only 42 percent.82 The president maintained plurality approval throughout 2010 and rose to majority approval in June 2011 following the death of Osama bin Laden.
TABLE 3.18.
Obama’s Handling of Afghanistan
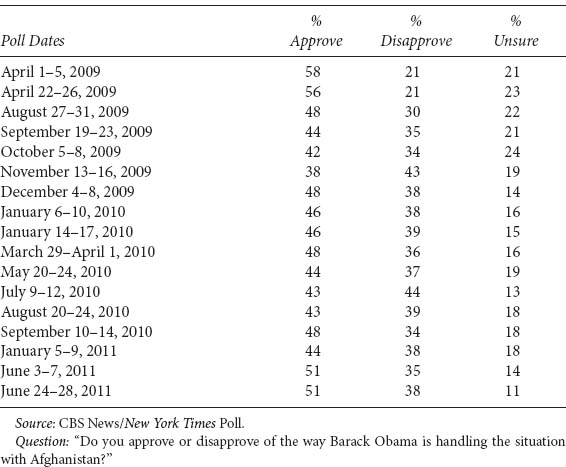
At the end of June 2010, Rolling Stone magazine published an article in which General McChrystal and some of his aides were critical of the president and other civilian foreign policy officials. The president immediately recalled the general to Washington and relieved him of command. A Gallup poll taken in the immediate aftermath of the event found that 53 percent of the public approved of the president’s action.83
Nevertheless, the president was operating on thin ice. By September 2010, 54 percent of the public thought the United States should not be involved in Afghanistan. Similar percentages held that view throughout the first half of 2011.84 By June 2011, 56 percent of the public, including a plurality of Republicans and majorities of Democrats and Independents, wanted to bring American troops home “as soon as possible.”85 It is not surprising, then, that a large majority of the public favored the president’s plan to withdraw U.S. troops announced in a nationally televised address on June 22, 2011.86
On his first full day in office, President Obama signed an executive order that called for the closing of the prison holding terrorist suspects at the U.S. military installation at Guantánamo Bay, Cuba within a year. Days before, only 35 percent of the public supported such an action (see table 3.19). One-fifth of the public was undecided at that point.
Following the president’s action, the public remained in opposition to the president’s policy, although support increased shortly after his decision. In the following months, however, the public was even less supportive of closing the prison than it was before he took office. Indeed, it appears that those who were undecided in the first half of January eventually moved into opposition to the president’s policy.87
Pew asked a question about closing the prison that did not include a reference to terrorists being held there. The results (see table 3.20) are a bit more supportive of the president than those found by Gallup in the previous table, but the trend is the same. By November 2009, a clear plurality of the public opposed the president’s policy. Most of the loss of support came from Democrats and Independents.
TABLE 3.19.
Support for Closing Prison at Guantánamo Bay
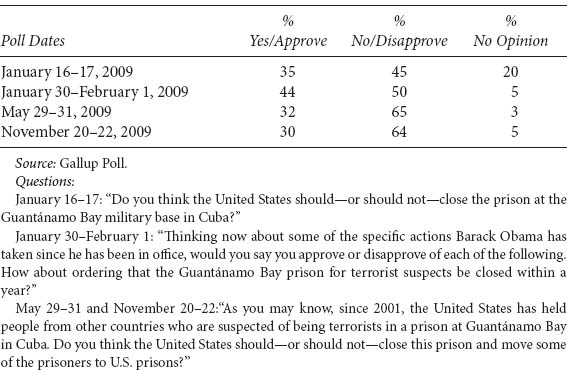
TABLE 3.20.
Support for Closing Prison at Guantánamo Bay
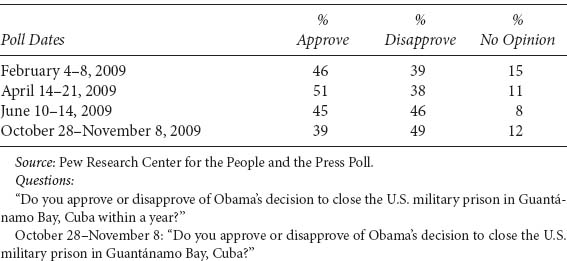
The issue of closing the Guantánamo Bay prison was highly polarizing. In February, Pew found that 64 percent of Democrats supported the president’s decision to close the prison, while 69 percent of Republicans opposed the decision. In November 2009, when overall support had diminished, 50 percent of Democrats but only 8 percent of Republicans supported the move (28 percent of Independents approved). We can also see that the president found it a challenge to attract support even among rank-and-file Democrats.88
Americans expressed even more widespread opposition to the idea of moving the prisoners to prisons in their own states if Guantánamo was closed. For example, at the end of May, only 23 percent of the public favored moving some of the prisoners to a prison in their state.89 Thus, it is not surprising that on May 20, 2009, the Senate voted 90-6 to keep the prison at Guantánamo Bay open and forbid the transfer of any detainees to facilities in the United States. Similarly, both the House and Senate refused to finance the purchase or modification of prison facilities in the United States to house the Guantánamo prisoners. In the lame-duck session at the end of 2010, Congress voted to impose strict new limits on transferring detainees out of the Guantánamo Bay prison, dealing a major blow to president Obama’s vows to shut down the center and give many of the prisoners federal court trials. One of the law’s provisions banned the transfer into the United States of any Guantánamo detainee for the 2011 fiscal year—even for the purpose of prosecution. A second provision banned the purchase or construction of any facility inside the United States for housing detainees being held at Guantánamo. A third provision forbade the transfer of any detainee to another country unless Defense Secretary Robert M. Gates signed off on the safety of doing so.
In the spring of 2011, civil war broke out in Libya. The United States and NATO began military operations, mostly from the air, on behalf of those revolting against the government of Muammar Gaddafi. Although Americans did not play a central role in the fighting, there was substantial controversy regarding the appropriate level of U.S. effort. By late June, only 39 percent of the public approved of U.S. military action in Libya, while 46 percent disapproved.90 Only 37 percent of the public approved of the president’s handling of Libya, while 59 percent felt the United States should not be involved in the fighting there.91
A controversy also arose around the White House’s claim that the War Powers Resolution did not apply to U.S. actions in Libya. Many liberal Democrats and conservative Republicans disagreed, and the public sided with them. Sixty-one percent felt Obama should have obtained congressional authorization for military action in Libya.92
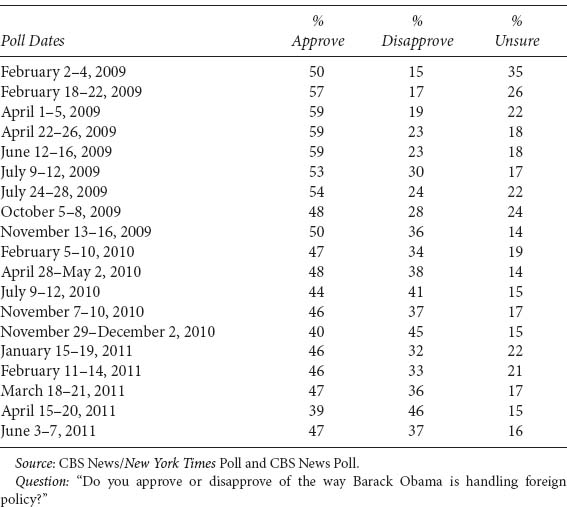
Evaluations of the president’s handling of foreign policy followed the same downward trend as his overall job approval. Disapproval climbed steadily throughout 2009, and the president never achieved majority approval in 2010 or the first half of 2011 (see table 3.21).
Presidents are party leaders who have strong impacts on the public’s attitudes toward their parties,93 and the success of the president’s party is key to his success in Congress. Unfortunately for the Obama White House, in 2009 and 2010, Americans were moving away from the Democratic Party, not toward it. Disapproval of the president was central to the explanation.94 In September 2010, Gallup found the lowest level of public favorability of the Democratic Party in the eighteen-year history of the measure.95 For the year 2010, Gallup found that 31 percent of Americans identified as Democrats, down five percentage points from 2008 and tied for the lowest annual average Gallup had measured in the previous twenty-two years.96 Gallup found that the number of solidly Democratic states declined from thirty in 2008 to fourteen in 2010.97
TABLE 3.21.
Obama Handling Foreign Policy
The Democratic Party was losing the public’s confidence. In May 2010, 49 percent of the public said the party’s views were “too liberal,” while only 38 percent felt its views were “about right.” In 2008, only 39 percent said the Democrats were too liberal. Most of the change came from Independents (Republicans always thought the Democrats were too liberal). The 49 percent figure was only one percentage point below the all-time high (since 1992) of the 50 percent Gallup found right after the 1994 elections. Equally disturbing for Democrats was the fact that only 40 percent of the public thought the Republican Party was “too conservative.”98
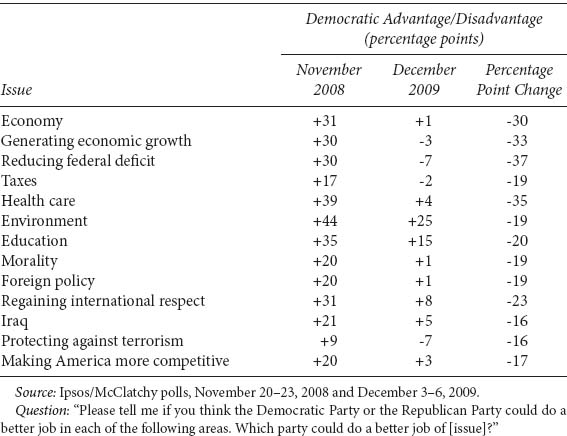
The Ipsos/McClatchy Poll asked voters which party could do the best job of handling thirteen different issues. During the first year of the Obama administration, the Republicans gained substantial ground on all thirteen (see table 3.22). Indeed, Republicans moved into the lead on crucial policies such as taxes, deficit reduction, generating economic growth, and protecting against terrorism, and were in a virtual tie on the economy, encouraging morality, and foreign policy.
TABLE 3.22.
Which Party Will Do Better at Handling Issues
By August 2010, Republicans had large advantages on terrorism, immigration, federal spending, and the economy, and advantages on Afghanistan, jobs, and corruption in government. Democrats had a substantial advantage only on the environment. Only 44 percent of the public felt the Democrats represented their attitudes about government (compared to 52 percent for Republicans), and only 49 percent felt the Democrats represented their values (as opposed to 56 percent for Republicans).99
Republicans also enjoyed a substantial engagement advantage. Pew found that on many measures, the Republican engagement in 2010 surpassed historical records. Fully 70 percent of Republican likely voters had given a lot of thought to the election, the highest figure recorded among either Republicans or Democrats over the past five midterm election cycles, and the differential between Republicans and Democrats was larger than ever previously recorded.100 Obama’s opponents were much more eager than Democrats to participate in the election: on average, 63 percent of Republicans said they were more enthusiastic about voting than usual (the highest proportion of such voters recorded in midterm data going back to 1994), compared with 44 percent of Democrats.101 The exit polls found that conservatives increased their percentage of the electorate for the House from 34 percent in 2008 to 42 percent in 2010, and 87 percent of them voted Republican, compared to 23 percent in 2008.102
Historically high percentages of Americans knew which party controlled Congress, and many voters wanted to punish the Democrats.103 Although only 26 percent of Democratic likely voters said national issues were the primary factor in their votes at election time, 50 percent of Republicans and 45 percent of Independents reported that such issues were the primary factor in their votes. Nearly a third (32 percent) of likely voters supporting Republican candidates for Congress said their vote was mainly a vote against the Democratic candidate rather than for the Republican, and 38 percent viewed their vote as sending a message that they opposed Obama. Only 24 percent saw their vote as support for the president.104
Republicans owed much of their success to strong backing from Independents, who composed 28 percent of voters on Election Day. Fifty-six percent supported Republican House candidates, while only 37 percent voted for Democrats, a massive change from 2008. A comparable shift occurred in Senate elections.105 Disapproval of the president’s job performance, anger at the federal government, and opposition to the health care legislation were closely associated with support for Republican candidates. Moreover, Independents who expressed these views were also highly likely to vote.106
There was an unusually active lame-duck session at the end of 2010, because Congress had failed to address a number of important issues during the regular session. As a result of the legislature’s agenda, the president did not focus sustained commentary on these policies until after the midterm elections. Table 3.23 provides a convenient summary of public opinion on the policies at about the time one or both houses took up the legislation.
There was little controversy about food safety regulation, a policy that had lingered in Congress for years. Similarly, the public overwhelmingly supported the repeal of “don’t ask, don’t tell” and allowing gays and lesbians to serve openly in the military. Nearly half of Republicans, 47 percent, along with 70 percent of Independents and 81 percent of Democrats, supported repeal.107 The public had favored allowing openly gay men and lesbians to serve in the U.S. military since 2005,108 so there is little reason to think that the opinion held at the end of 2010 was a response to Obama’s leadership.
Perhaps the biggest issue of the lame-duck Congress was extending Bush-era tax cuts. Obtaining the public’s support for not raising their taxes is not a difficult task. The president, however, did not want to extend the lower tax rates for the wealthy and wanted to reinstate the estate tax at a level that would help reduce the deficit. He could not gain Republicans’ agreement for these positions, but he did extract some concessions, including an extension of unemployment benefits and a reduction in Social Security taxes for 2011. The Republicans won a high exemption on inheritance taxes. Like tax cuts, winning public support for extending unemployment benefits during a period of economic sluggishness was not a challenge. In the end, the public clearly supported the compromise, although at least pluralities would have preferred not extending the tax cuts fully for the wealthy and the temporary reductions in Social Security taxes.109
TABLE 3.23.
Public Support for Policies in the 111th Congress’s Lame-Duck Session issue
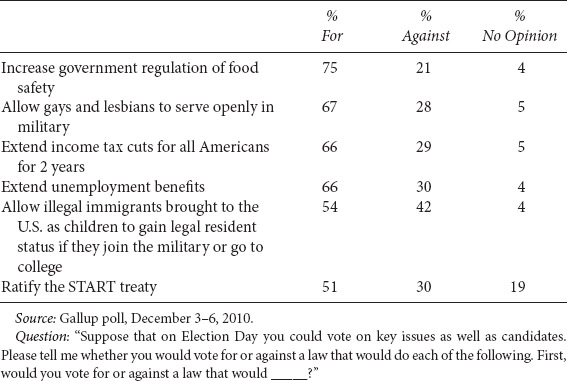
Another major pending issue before the Senate was the New START treaty. Most Americans favored ratification, although a sizeable number had not heard much about it.110 A final major issue was known as the DREAM act, which would provide a path for illegal immigrants brought to the United States as children to gain legal resident status if they joined the military or went to college. The public approved of this policy, although by narrower margins than the other policies listed in table 3.23. As we will see in chapter 6, the DREAM act fell to a Senate filibuster.
We saw in chapter 1 that the climate of public opinion in the early Obama presidency was not conducive to the president’s obtaining public support for major liberal policies. That climate, along with the long-term obstacles to leading the public, provided the basis for predicting that the president was unlikely to enjoy substantial success in moving the public in his direction. The data presented in this chapter support this prediction.
With the exceptions of limits on executive pay, which was popular when George W. Bush occupied the White House, regulating the highly unpopular large financial institutions, food safety regulatory reform, which had always received public support, and repealing “don’t ask, don’t tell,” which the public had backed for several years before Obama took office, there was no major Obama initiative that enjoyed widespread public support. Indeed, the president could not muster majority backing for his policies regarding the TARP program and bank bailouts, the automaker bailouts, his overall handling of the economy and of the deficit, and health care reform and his handling of it. The public supported the 2010 tax bill, but it is a stretch to call it an Obama initiative. From the White House’s perspective, the bill was clearly a compromise position that contained a number of important elements that the president opposed. The public did back the compromise, however, largely because it adopted its standard pose of opposing an increase in taxes. A bare majority of the public supported ratification of the START treaty. Although a modest majority supported the cap-and-trade proposal, opinion on the underlying premises of climate change legislation moved clearly and rapidly against the White House, as did views of the president’s handling of the global warming issue. The public also clearly opposed closing the prison at Guantánamo Bay and transferring prisoners from there to the United States, and it lost confidence in his handling of Afghanistan in particular and foreign policy in general. In addition, identification with the Democratic Party declined substantially, as did evaluations of the party’s ability to handle issues relative to that of the Republicans. These party assessments provided the foundation for the Democratic losses in the 2010 midterm elections.
There is not much evidence that Barack Obama could depend on creating opportunities for change by obtaining public support and leveraging it to gain support for his proposals in Congress. There were glimmers of successful opinion leadership, such as the very end of the congressional debate on the economic stimulus program. The public remained deeply skeptical, however, even of a program designed to revive the stagnating economy, and opinion soon moved decisively to opposing it. The president also received a mixed public response on Afghanistan, where he adopted a relatively conservative policy. He could not maintain majority approval of his handling of the issue or of foreign policy over all.
In general, public opinion moved against the president over time. Andrew Kohut, president of the Pew Research Center, summarized these trends well when he declared at the end of 2009,
What’s really exceptional at this stage of Obama’s presidency is the extent to which the public has moved in a conservative direction on a range of issues. These trends have emanated as much from the middle of the electorate as from the highly energized conservative right.111
TABLE 3.24.
Approval of Major Legislation
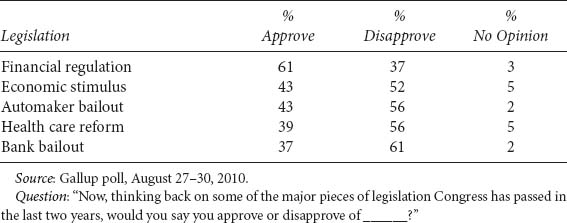
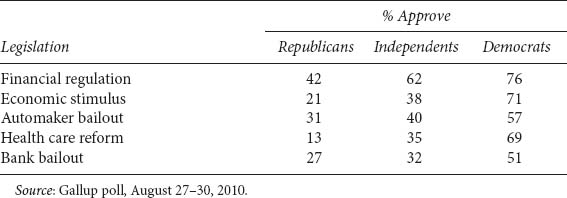
Shortly before the 2010 midterm elections, Gallup asked the public about its approval of some of the major legislation passed in the 111th Congress. As the results in table 3.24 show, the public approved only of financial regulation. Majorities disapproved of the other legislation about which Gallup inquired. Perhaps most troubling for the president, financial regulation was the only legislation that was receiving majority approval of Independents (table 3.25). No more than 40 percent of Independents approved of any of the other legislation.
Bill Clinton concluded that his health care reform failed because “I totally neglected how to get the public informed . . . I have to get more involved in crafting my message—in getting across my core concerns.”112 In other words, his strategy was not inappropriate, only his implementation of it. “I got caught up in the parliamentary aspect of the presidency and missed the leadership, bully pulpit function which is so critical.”113
In a televised interview on the first anniversary of his inauguration and the day following the Democrats’ stunning loss of Ted Kennedy’s Senate seat in Massachusetts, Barack Obama also lamented that he had failed to communicate effectively with the public because he focused too heavily on policymaking.114 Months later, he echoed these remarks: “I think anybody who’s occupied this office has to remember that success is determined by an intersection in policy and politics and that you can’t be neglecting of marketing and P.R. and public opinion.”115
The president did not have a policy problem, he thought. Instead, he had a communications problem. Apparently the premise of the power of the presidential pulpit is so strong that each downturn in the president’s efforts prompted new strategies for going public rather than a reconsideration of his policies. Obama’s Democratic critics agreed. Former Clinton aide Paul Begala echoed the sarcastic reaction of many of Obama’s fellow Democrats who wanted him to fight against the Republican’s insistence on extending tax cuts to the rich. “Imagine what he could have done to sell a position he wholeheartedly believed in,” Begala proclaimed, adding that it “confirms my own belief that if President Obama had chosen to fight, he would have won.”116
TABLE 3.25.
Partisan Approval of Major Legislation
The premise of the potential of presidential public leadership seems to be nonfalsifiable. It should not be. Presidents would be much better off listening to the creator of the bully pulpit. Writing to Edward Thayer Mahan on March 12, 1901, Theodore Roosevelt explained why the United States could not at that time pursue a more militant foreign policy in China. “While something can be done by public men in leading the people, they cannot lead them further than public opinion has prepared the way.”117