Chapter 13
Magnetic resonance spectroscopy
Although MRI is the most common application of the MR phenomenon used in the medical community, it is a relatively recent development. The original application of magnetic resonance is MR spectroscopy (MRS), a technique that allows examination of individual molecules or portions of molecules within a sample. The development of whole-body scanners has allowed MRS to be used to study the biochemistry of disease processes within a patient without the need for invasive procedures such as biopsies. Many of the principles of MRS are the same as those of MRI, although their emphasis is somewhat different. While theoretically possible on any MRI system, most MRS studies are performed using magnets of 1.5 T or higher, due to the low intrinsic sensitivity of the technique. Hydrogen spectroscopic studies can be performed on standard imaging systems with no additional hardware required. Spectral studies of other nuclei require additional transmitter and receiver hardware (see Chapter 14). This chapter summarizes some of the basic concepts of hydrogen MRS. For more complete discussions of the field, see Salibi and Brown, 1998, Mukherji, 1998, and deGraaf, 2007.
13.1 Additional concepts
13.1.1 Chemical shift
A description of the basic principles of MRS begins at the same place as that of a description of the principles of MRI. The basic concepts of net magnetization produced by a collection of spins in a magnetic field, signal production following absorption of RF energy, and T1 and T2 relaxation as described in Chapters 1 through 3 are identical for MRS and MRI. However, there are two important differences between MRS and MRI. First, MRS signals are normally detected in the absence of a gradient. All molecules are detected in the presence of the same base magnetic field. The chemical shift described in Chapter 2 is the only source of magnetic field variation present during signal detection. Rather than be the source of an artifactual signal as it is in MRI, the chemical shift is the means by which molecular species are identified in MRS studies. Second, unlike MRI, relaxation effects are avoided as much as possible in MRS studies. The molecules under observation are relatively small in size and have relatively long T1 and T2 values. Long TR (typically  ) are used in order to minimize T1 saturation effects as well as allowing for high-frequency resolution. T2 dephasing effects are dominated by main field inhomogeneities and are more properly described by T2*.
As mentioned in Chapter 2, chemical shift values are measured to a reference frequency. The traditional reference frequency used for  is that of tetramethylsilane (TMS). This is impractical to use in biological systems due to its toxicity and the difficulty in achieving uniform tissue distribution. In its place, an endogenous secondary reference is normally used. This is the methyl
  signal of
  -acetyl aspartate, which has a chemical shift of 2.0 ppm relative to TMS. This allows standard tables of chemical shifts to be used and for in vivo spectral displays to correlate with traditional ex vivo displays (Figure 13.1).
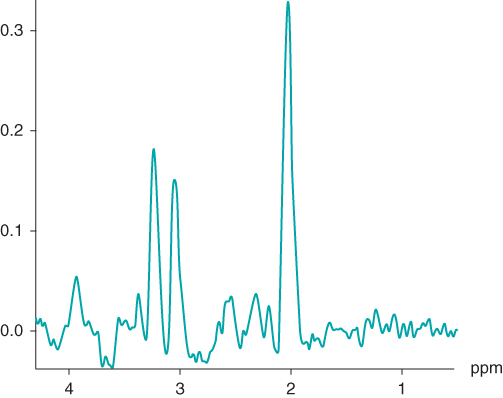
Figure 13.1 Typical  spectrum from normal brain. Measurement parameters: pulse sequence, two-dimensional CSI PRESS; TR, 1500 ms; TE, 144 ms;
  , 4; voxel size,
 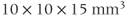 .
.
MRS is one application where the use of increased field strengths will cause the spectral appearance to change. As mentioned previously in Chapter 2, the chemical shift is a relative scale and the chemical shift values are independent of frequency. However, the individual signals and their absolute frequencies increase with increased field strength. This concept was presented in the context of fat and water  frequency differences and the chemical shift artifact, though this principle is true for all signals. The typical in vivo spectral display ranges from 0.0 to 4.5 ppm, which is characteristic of
  atoms that are part of
  , or
, or  functional groups. This 4.5 ppm range of frequencies corresponds to approximately 285 Hz at 1.5 T, while it spans 570 Hz at 3.0 T. The resonance linewidths (see below) are normally dominated by magnetic field inhomogeneities, which can be reduced through shimming. If the linewidth is equal in Hz at the two field strengths, then the peaks of the higher field spectra will appear sharper and better resolved.
The chemical shift provides the means by which portions of molecules are identified. The difference in  is caused by differences in the local magnetic environment around the nucleus. This difference arises primarily from the electrons surrounding the nucleus (producing chemical shielding) and the atoms that are either bonded to or near the spins under observation. Because many molecules have similar chemical structures and the molecular differences may not be near the spins under observation, different molecules may have very similar spectra. For example, creatine and phosphocreatine differ chemically by the presence of a phosphate group in place of a hydrogen atom (Figure 13.2). However, the methyl portion of the molecule is the same and the MR signal from that functional group will be the same in both molecules. In a similar fashion, fatty acids with long hydrocarbon chains will have very similar spectra. Because of this, MRS studies are considered to be very sensitive techniques to detect the presence of a functional group but not specific enough to uniquely identify the molecule to which it is attached.
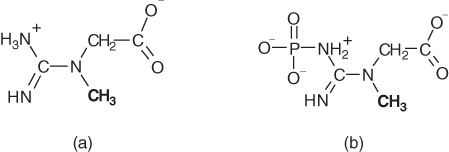
Figure 13.2 Chemical structures of creatine (a) and phosphocreatine (b). Because the phosphate group is located several bonds away, it has very little influence on the molecular environment of the methyl hydrogens (boldface type). As a result, the signals for the methyl hydrogens in both molecules have the same frequency.
13.1.2 Spin coupling
In addition to the chemical shift, there is another molecular interaction that modifies the environment of a spin. Spins located on the same or adjacent atoms in a molecule interact with each other and each has its local magnetic field affected. The most common instance of this in biological systems is facilitated by the bonding electrons in the molecule and is known as spin coupling or  coupling. Spin coupling differs from the chemical shift in two very important ways: it is independent of magnetic field strength (chemical shifts increase with
  when measured in Hz) and there is always another spin involved in the coupling. First-order coupling occurs when the chemical shift difference is large relative to
  :
:

where  is the coupling constant between spins A and X. Second-order coupling occurs when equation 13.1 is not met.
Spin coupling involves a pairing interaction between spins on the same molecule that causes the MR signal of each member to be divided. The number of resultant signals and their relative amplitudes depend on the number of spins of each type. For hydrogen MRS studies in biological systems, the molecule where spin coupling is most easily viewed is lactate,  . Attached to the middle carbon of the molecule (indicated by the underline) is a methyl group and a hydrogen atom. The hydrogen atom can be oriented parallel or antiparallel to
  . The methyl group will sense slightly different molecular magnetic fields in each case. On average, there will be an equal number of possibilities for the hydrogen atom in each orientation, so the signal detected for the methyl group is split into two peaks separated by approximately 7 Hz, centered around the chemical shift for the methyl group. The 7 Hz value is the coupling constant
  for this particular interaction between this set of spins. In a similar fashion, the methyl protons can be arranged in one of four configurations: all three parallel to
  , all three antiparallel to
  , two parallel and one antiparallel to
  , or one parallel and two antiparallel to
  . The last two configurations occur three times more frequently than the first two, so that the hydrogen atom will be divided into four peaks with relative amplitudes 1:3:3:1, each separated by 7 Hz. Because of its low amplitude and its nearness to the water resonant frequency, this resonance is normally not visualized in in vivo MRS studies.
An important feature of spin coupling is that it is not reversed by the application of a 180° refocusing RF pulse. As discussed below, one method of spatial localization uses 180° refocusing RF pulses to produce a spin echo. The lactate signal is modulated in amplitude, based on the elapsed time between the RF pulses, which means that the lactate protons may or may not be in phase with the other protons at the echo time TE. This condition is analogous to the phase modulation seen in gradient echo MRI studies for fat and water. The rate of this modulation is proportional to  . For the 7 Hz coupling, it corresponds to a phase modulation period of approximately
  . Use of a TE of 288 ms ensures that the lactate resonances are in phase with the other noncoupled resonances, while use of a TE of 144 ms has the lactate signals 180° out of phase compared to the other resonances (Figure 13.3).
Figure 13.3 PRESS  spectra of lactate (doublet) and acetate (singlet). Choice of TE affects the relative polarity of lactate peak compared to acetate, due to modulation of spin-coupled
  atoms. (a)
  ; (b)
; (b)  .
.
13.1.3 Spectral linewidth
The signals emitted by the spins will not be a single frequency line but will be a peak (or peaks if spin coupling is present) with a finite linewidth centered at the frequency corresponding to the chemical shift, as seen in Figures 13.1 and 13.3. The width of the peak, known as the full-width at half-maximum height (FWHM), is proportional to  :
:

As a result, the linewidth will change, depending on the particular molecule as well as the magnet homogeneity or shim. For signals with chemical shifts that are similar in value, such as creatine/phosphocreatine (Cr, 3.0 ppm) and choline (Cho, 3.2 ppm), the magnet homogeneity must be very high to adequately resolve the signals. This makes MRS examinations difficult in areas where significant magnetic susceptibility differences are present, such as the posterior fossa or near the skull.
In addition, the spectral or frequency resolution must be sufficiently high so that there are several data points defining the peak. For example, to resolve Cr and Cho, separated by 0.2 ppm  , a frequency resolution of approximately
  per point is typically used with a total frequency range of 1000 Hz acquired. To achieve this resolution, dwell times of 1 ms per point are required with the resulting total sampling time being 1 second or longer.
13.1.4 Water suppression
Clinical MRI techniques visualize the water and fat within the desired slice. The high concentration of water and fat within the tissue makes this feasible. In MRS, the metabolites under observation are as much as 10,000 times less concentrated than water, which makes their detection in the presence of tissue water difficult. In order to accomplish this, suppression of the water is necessary. The most common approach uses a frequency-selective RF pulse or pulses centered at the water resonant frequency to saturate the water protons. This technique is analogous to the fat saturation pulse described in Chapter 7. Water suppression factors of 100 or more are possible from a single pulse, making it an easy and effective way for reducing the signal contamination from water.
13.2 Localization techniques
Current techniques used for spatial localization of the MRS signals were derived from similar techniques used in MRI. Slice-selective excitation pulses in conjunction with gradient pulses are used to localize the RF energy to the desired volume of tissue, in the same manner as described in Chapter 4. However, unlike MRI, where the voxel size is typically  or less, MRS voxel sizes are usually
  or larger. Therefore, MRS studies are limited to the examination of relatively large regions of tissue. The two general categories of localization techniques are based on the number of separate voxels from which spectra are obtained in each measurement.
13.2.1 Single voxel techniques
Single voxel techniques (also called single voxel spectroscopy, or SVS) acquire spectra from a single small volume of tissue. The most common approaches excite only the desired tissue volume through the intersection of three RF excitation pulses. Two schemes of RF pulsing are used. The first approach, known as point resolved spectroscopy (PRESS), uses a 90° and two 180° RF pulses in a fashion similar to a standard multiecho sequence (Figure 13.4). Each RF pulse is applied using a different physical gradient as the slice selection gradient. Only protons located at the intersection of all three pulses produce the spin echo at the desired TE. The other approach, known as the stimulated echo acquisition method (STEAM), uses three 90° RF pulses, each with a different slice selection gradient (Figure 13.5). The resulting stimulated echo (see Section 9.2.5, Coherence artifacts) is produced by protons located at the intersection of the pulses.
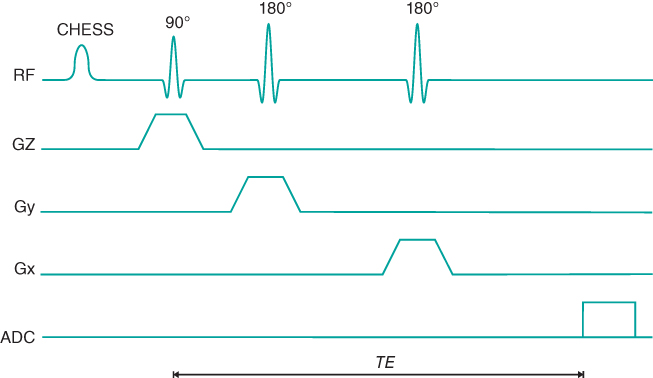
Figure 13.4 PRESS pulse sequence timing diagram. The CHESS RF pulse is used for suppression of water.
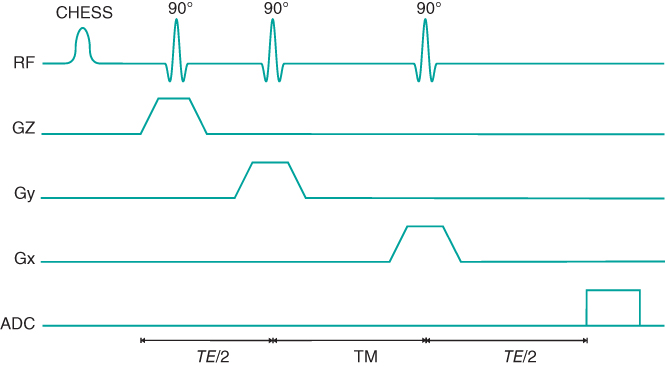
Figure 13.5 STEAM pulse sequence timing diagram. The CHESS RF pulse is used for suppression of water.
There are several differences between PRESS and STEAM. The major difference is in the nature of the echo signal. In PRESS, the entire net magnetization from the voxel is refocused to produce the echo signal; in STEAM, a maximum of one-half of the entire net magnetization generates the stimulated echo. As a result, PRESS has an SNR significantly larger than for STEAM for equivalent scan parameters. Another difference is that PRESS uses 180° RF pulses while STEAM uses only 90° RF pulses. The voxel dimensions with PRESS may be limited by the high transmitter power required for the 180° RF pulses. STEAM spectra are also unaffected by J coupling of spins, while PRESS spectra show a modulation of the signal from any coupled spins, such as lactate methyl protons. Finally, STEAM allows for shorter TE values, reducing signal losses from T2 relaxation and allowing observation of metabolites with short T2*.
13.2.2 Multiple voxel techniques
Multiple voxel techniques are those from which multiple spectra are obtained during a single measurement. The most common of these methods is known as chemical shift imaging (CSI). CSI techniques are analogous to standard imaging techniques in that phase encoding gradient tables are used for spatial localization. They are subdivided into 1D, 2D, and 3D versions, depending on the number of gradient tables used for spatial localization. The most common of these approaches is two-dimensional CSI, in which two gradient tables are used. Volume-selective RF excitation pulses are used, either with a PRESS or STEAM RF pulse train. The most common scheme has the three excitation pulses in mutually perpendicular directions and is termed volume-selective CSI (Figure 13.6). This scheme enables the volume of excitation to be tailored so that areas producing a contaminating signal can be avoided. For example, brain studies using volume-selective CSI can minimize the signal from the skull and subcutaneous fat.
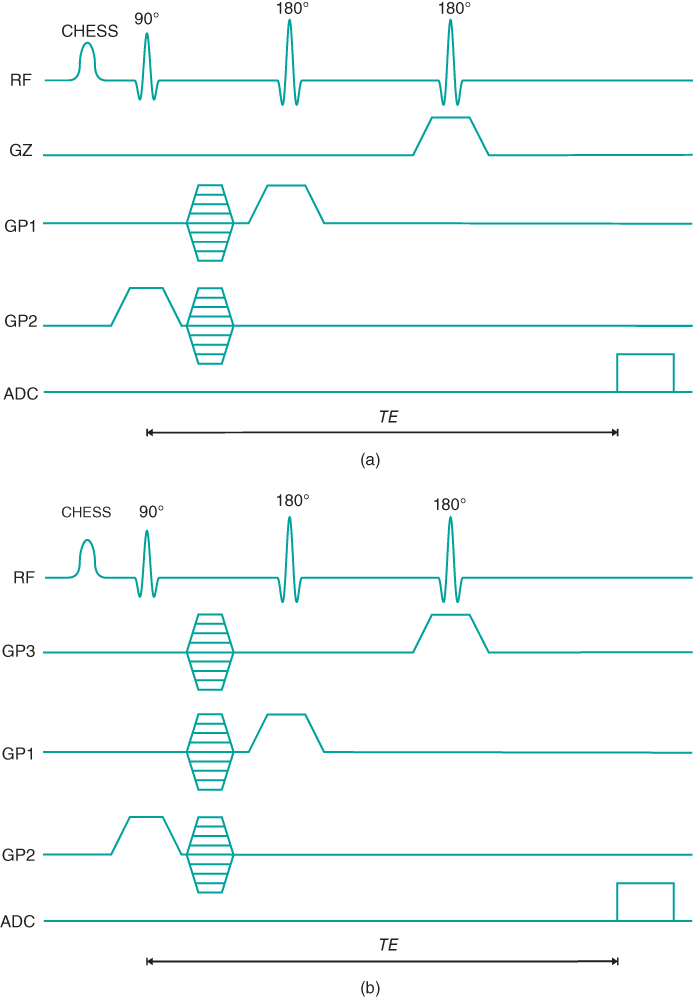
Figure 13.6 Volume-selective pulse sequence timing diagrams: (a) two-dimensional; (b) three-dimensional. The CHESS RF pulse is used for suppression of water.
Volume-selective CSI techniques have the advantage over SVS techniques in that spectra from several volumes of tissue can be measured simultaneously, which is advantageous if the disease under observation is diffuse or covers a large area of anatomy. However, the measurement times for CSI techniques are generally relatively long and the entire data collection must be completed in order to obtain all the localization phase encoding steps. With SVS techniques, the measurement times are long due to multiple acquisitions necessary to produce adequate SNR, but the number of acquisitions can be adjusted depending on the voxel size. In addition, the multiple voxels must be individually postprocessed, making analysis of CSI data more operator intensive.
13.3 Spectral analysis and postprocessing
The MRS signal from a voxel contains information regarding the identity, molecular environment, and concentration of the metabolite producing the signal. This information is provided by the resonant frequency, the linewidth, and the integrated peak area, respectively. Although this information can be extracted from the time domain form of the signal, it is more convenient to analyze the frequency domain form, obtained following a Fourier transformation. This analysis is aided by various data processing techniques applied both prior to and following the Fourier transformation (Figure 13.7). Many of these techniques are often used in MRI. Filtering of the echo signal is performed to reduce noise that can be induced during the very long sampling times for the signal. This is the same type of filter used in MRI to reduce truncation artifacts. Zero filling consists of adding data points of zero amplitude to the end of the detected time domain signal. In most cases, the extra points are appended to the end of the sampled data. These data are typically background noise in the measurement. Following Fourier transformation, the frequency resolution of the resulting spectrum is increased through interpolation of the measured data points. This approach, termed sinc interpolation in MRI, provides a smoother appearance to the final spectrum. The final processing that is applied to the time domain signal is a correction for distortion by residual eddy currents. Eddy currents are produced as a result of the time-varying nature of the gradient pulses and result in fluctuating magnetic fields that distort the MR signal. Manufacturers incorporate some type of eddy current compensation in the scanner hardware to correct for this, as described in Chapter 14. While sufficient for MRI studies, this compensation is seldom adequate to produce distortion-free MR spectra. Acquisition of a second signal, usually a water-unsuppressed signal from the same voxel, is used to provide a reference for residual field variations due to eddy currents. Alternately, if the eddy currents are not too severe, a small amount of water signal may be retained and can be used as the reference signal.
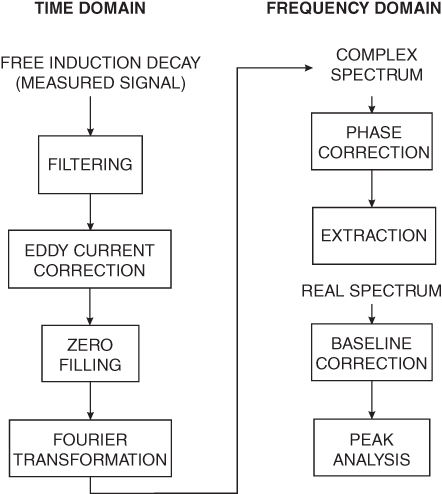
Figure 13.7 Typical spectroscopy postprocessing steps.
Following Fourier transformation, the resulting complex frequency domain signal is not a single mode signal, but is usually a mixture of both the in-phase (dispersion) and out-of-phase (absorption) signals relative to the transmitter (Figure 13.8). In MRI studies, rather than separating these two signals, they are combined to form the magnitude image. For MRS studies, the pure absorption mode is preferred, due to its simpler spectra and narrower linewidths, and to enable semiquantitative spectral analysis. A process known as phase correction is used to separate the two modes and extract the absorption portion. A mathematical manipulation combines the two components of the complex signal together in such a way as to isolate the absorption mode to the real portion and the dispersion mode to the imaginary portion. For the real spectrum, it may also be necessary to perform a baseline correction if it is not flat due to hardware imperfections or incomplete water suppression. Finally, the resonant frequency, linewidth, and integrated area for each peak in the spectrum can be measured. Although a visual examination of the spectrum can provide an approximation of these parameters, the most accurate method for analysis involved fitting of the peaks to theoretical curves of the appropriate lineshape. Whereas the frequencies and linewidths can be compared directly from one spectrum to another, peak areas are influenced by various hardware-related variables that are difficult to quantify. Instead, ratios of peak areas are used in evaluating the relative concentrations of the metabolites. Absolute concentrations for metabolites can be determined if a simultaneous measurement of a reference compound is performed in which the concentration of the reference is known by other means.

Figure 13.8 Phase-corrected complex spectrum resulting from Fourier transformation of FID signal. (a) Real portion of spectrum, also known as the absorption spectrum; (b) imaginary portion of spectrum, also known as the dispersion spectrum.
It is important to establish standardized scan protocols and to become familiar with the spectra from given anatomical regions as well as age-related variations. Peak patterns can vary so that an abnormal spectrum in one region is actually normal for another one (Figure 13.9a to c).
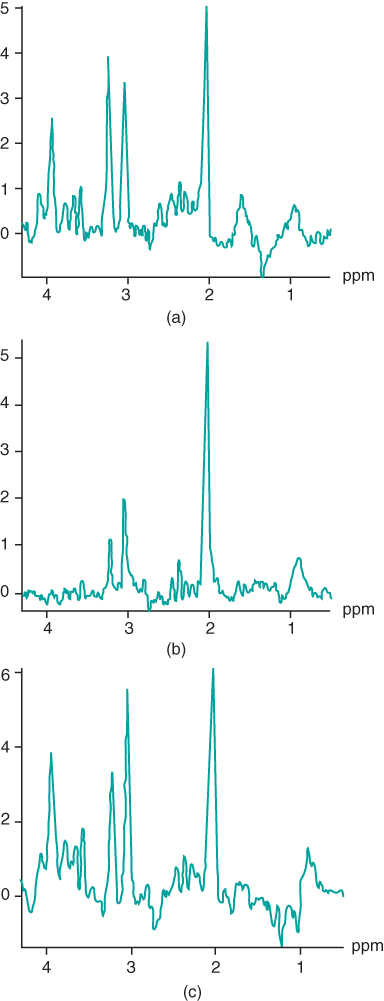
Figure 13.9 1H two-dimensional CSI PRESS spectra from different voxel locations. Note the difference in spectral patterns.
One example of a clinical application of MRS is in the evaluation of temporal lobe epilepsy. Normal brain spectra obtained with long TE (135 and 270 ms) show three major peaks: N-acetyl aspartate (NAA) at 2.0 ppm, Cr at 3.0 ppm, and Cho at 3.2 ppm relative to water at 4.7 ppm. The relative area ratios in adults are typically 1.4–1.5 for NAA/Cr and 0.8 for Cho/Cr. Patients with temporal lobe epilepsy have been found to have reduced levels of NAA and increased levels of Cho and Cr in the diseased lobe (Achten et al., 1997). Acquisition of spectra from both temporal lobes enables a clear identification of the affected region.
Another example is in the grading of gliomas through the presence of myo-Inositol (mIno), which has a resonance at 3.6 ppm corresponding to a methine group and can be observed using short TE acquisitions. High-grade versus low-grade gliomas have been distinguished by examining the Cho/Cr ratios as well as mIno/Cr ratios (Pinker et al., 2012).
A final example is in the assessment of prostate cancer. Normal prostate spectra show signals from the  of citrate at 2.6 ppm (Figure 13.10) as well as from Cho. Malignant tissue shows a significantly reduced citrate signal relative to Cho (Pinker et al., 2012). Prostate studies are challenging for several reasons. Frequently an endorectal surface coil is used. The small size and limited observation field of the coil make accurate placement a necessity. Use of torso array coils reduce the SNR, but provide for better patient cooperation.
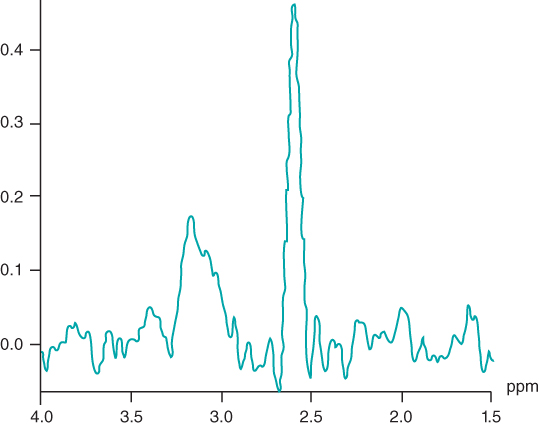
Figure 13.10 Normal prostate spectra.
13.4 Ultra-high field spectroscopy
MRS examinations also benefit from use of ultra-high  . As mentioned in Chapter 1, the net magnetization
  is directly proportional to
  , so that the potential exists to obtain an increased signal. This is particularly beneficial for MRS examinations of
  and
and  , where the sensitivity is significantly less than that of
  (see Table 1.1). The increased chemical shift difference enables better spectral resolution between metabolites with similar resonant frequencies. The spectral linewidths generally appear narrower, due to the increased absolute frequency range that is displayed. On a practical basis, the increased SNR can be exploited in two ways. Smaller voxels can be scanned, allowing improved spatial resolution. For example, MR spectra can be acquired with an equivalent SNR with fewer signal averages. This can result in shorter scan times, allowing better time resolution in kinetic examinations. Alternately, resolution of gray and white matter into separate voxels can be performed using two-dimensional CSI (Figure 13.11).
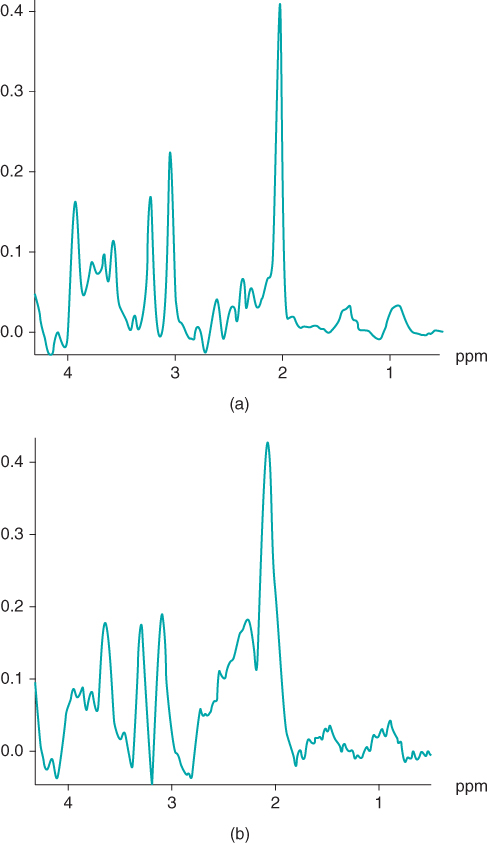
Figure 13.11  two-dimensional CSI PRESS spectra acquired at 1.5 T (a) and 3.0 T (b). The scan parameters are identical except that spectrum (a) had four averages, whereas spectrum (b) had one average.
There are two areas where ultra-high  can cause problems. The signal from fat will significantly increase compared to that measured at conventional
  . Suborbital fat or fat from bone marrow in the skull can potentially cause contamination in brain examinations. Outer volume saturation or narrow-band inversion of the lipid signal may be necessary to obtain good quality spectra. The second area of concern is due to the increased chemical shift differences between metabolite signals. When using volume-selective excitation, there will be a misregistration of the metabolites being excited by the frequency-selective RF pulse. Specifically, RF pulses broadcast at a given frequency will excite water protons at one location but metabolites at different locations. This is analogous to the chemical shift artifact observed in MRI. In particular, this is problematic with two-dimensional CSI, where the excitation volume is localized in all three directions by frequency-selective RF pulses. Voxels near the edges of the excitation volume will exhibit intensity variations due to nonuniform metabolite excitation. While this problem is observed at conventional
  , it is worsened at ultra-high
  due to the increased chemical shift between the metabolite resonances. Care must be taken in positioning the excitation volume as a result.