11
Long-Term Trends in Natural Selection
Unlike physics, every generalization about biology is a slice in time.
(Bronowski 1973, p. 309)
Thus, the nature, causes, and effects of variability in ecological systems can be understood only through extended study over far longer time periods than those typical of … most other biological sciences.
(Cody 1996, p. 4)
Introduction
LONG-TERM FIELD STUDIES help to bridge the gap between two very different temporal scales of evolution, the micro and the macro. Fossils reveal temporal patterns in size, shape, and complexity of organisms as diverse as trilobites, oysters, and dinosaurs over millions of years. The patterns include long-term linear trends with or without reversal (Darwin 1859, Simpson 1953), long-term stasis punctuated by rare, abrupt, and substantial change (Eldredge and Gould 1972, Eldredge et al. 2005) and bursts of diversification following major tectonic activity (Williams and Duda 2008), concentrated periods of extinction (Bapst et al. 2012), or entry into new environments (Hou et al. 2011). How are these macroevolutionary patterns produced? Microevolutionary studies of biological mechanisms and natural processes in contemporary time provide answers (e.g., Bell and Foster 1994), and are especially helpful when they are coupled with studies of fossils of the same organisms (Bell et al. 2006).
The purpose of this chapter is to take a longer view of morphological evolution in contemporary time than is usual, drawing upon information on what happened year by year for 40 years. In doing so we revisit the evolutionary trajectories in figures 1.6 and 1.7 and the questions they raise, but expand the scope to consider not just beak depth but all measured morphological traits. We ask whether there were net trends in evolutionary change as a result of selection, introgression, and drift, whether species changed in tandem or out of step, and whether by the end of the study they were morphologically the same as at the beginning. We interpret changes brought about by selection in terms of feeding ecology. In the next chapter we make the link between changes over 40 years and the early stages of adaptive radiation over a million years or more.
Annual changes in morphological means are caused by selective losses, as a result of mortality and emigration, and selective gains, as a result of natality and immigration. All other things being equal, the means of these traits are expected to remain constant over the long term except for minor deviations caused by our sampling (Grant and Grant 2002a). All other things are decidedly not equal in this fluctuating and unpredictable environment. In chapter 5 we discussed morphological changes occurring as a result of differential breeding success, found little evidence for an association between the two, and concluded that reproductive success was only weakly affected by morphology. In contrast we showed in chapter 4 that morphology makes a strong contribution to differential survival of fortis in the short term when the environment changes, and in chapter 7 we described the combined effects of food shortage and interspecific competition on survival causing evolutionary change in fortis morphology.
Here we provide the long-term perspective by showing how fortis and scandens are affected by natural selection repeatedly and differently on a scale of decades. G. magnirostris is treated separately later in the chapter because recurring immigration complicates the interpretation of morphological trends. We conclude by describing allometric changes. All three species underwent changes in proportions, each taking a different route.
Selection
G. FORTIS
Climatic fluctuations and the changes they cause to both the vegetation and finch foods imply episodic selection that fluctuates in strength and direction (chapter 4). Viewed over a period of four decades, this expectation is observed strongly in fortis, and in all three traits; body size, beak size, and beak shape (fig. 11.1). The main pattern is this: in most years there is little or no directional selection, and interspersed are a few years of very strong selection.
The strongest selection events, in 1976–77 and 2003–5, were associated with droughts and high mortality due to starvation (chapters 4 and 7), but these were not the only ones (fig. 11.1). Body size was a selected trait in six years. In four of those years beak size was also a selected trait, and in the same direction, resulting from the strong and positive correlation between the two traits. Beak shape is independent of both and shows a contrasting pattern of selection. At the two times of strongest selection on body size and beak size (1976–77 and 2003–5) there was no selection on beak shape. In only one year, 1985, were all three traits selected; survivors were small and had pointed beaks. At the next time when birds with pointed beaks had a selective advantage, in 2009, there was no significant selection on the size traits. Thus different combinations of traits were selected in different years.
G. SCANDENS
Selection regimes on scandens were different from selection on fortis in two respects (compare figs. 11.1 and 11.2). The most important difference is the absence of fluctuating selection. Instead selection on both body size and beak size was unidirectional; small birds with small beaks were repeatedly at a selective disadvantage. Therefore in some years the two species experienced different selective mortality. For example, in 1985 the birds at a disadvantage were large fortis and small scandens. The second difference between species is the almost complete absence of selection on beak shape in scandens.
ECOLOGICAL CAUSES
Differences between the species in patterns of directional selection derive from their different diets and territorial systems. The causes of selective mortality in fortis were discussed in chapters 4 and 7. In drought years many finches die of starvation. Survivors have beak sizes and shapes appropriate for handling the particular foods that are available as the supply dwindles. Body size may play an additional role in affecting survival through social dominance at contested food sources. In contrast to times of scarcity, when seeds are abundant at the beginning of a drought, survival is higher and there is no selection. For example, fortis mortality was relatively low in both the first (32%) and second (27%) of two consecutive years of drought, 1988 and 1989 (fig. 4.12), when only 5 mm of rain fell. The droughts followed a highly productive year of El Niño (fig. 4.12), and there was no association with morphology (figs. 7.6 and A.9.1).
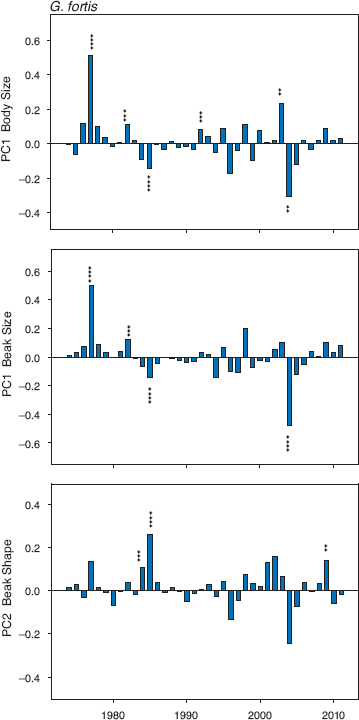
Fig. 11.1 Standardized selection differentials (coefficients) for fortis. They are calculated for each sample of adults surviving from one year to the next by dividing the difference in their means by the standard deviation of the first sample. Positive values indicate selection for large size or pointed beaks on the PC2-beak axis. Males and females were combined with adults of unknown sex because separate selection analyses of males and females give similar results (chapter 4). The magnitude of the coefficients is indicated by the size of the histogram bars, and their direction is shown by their placement above (positive) or below (negative) the baseline of zero. The difference between the means of survivors and nonsurvivors was tested with two-tailed ttests that do not require equal variances, and the significance of each coefficient is indicated with from two to four asterisks: ** (p < 0.01), *** (p < 0.005), **** (p < 0.0001). Six differences significant at p < 0.05 are not shown, because the observed six are expected by chance in the 111 tests performed. Sample sizes range from 21 to 735 (median = 200) for the years 1974 to 2011 (table 11.1 in appendix 11.1). For further details see Grant and Grant 2002.
Diets of scandens are not the same as fortis and nor are the causes of selective mortality. In this species social dominance is of overriding importance because it determines access to Opuntia fruits and flowers. These are fixed, spatially localized, on or below dispersed cactus bushes, and are defended year-round by males (Millington and Grant 1983). G. fortis are territorial only in the breeding season (Boag and Grant 1984b), and at other times they search for seeds on the ground that are widely distributed across the island. Thus their respective food supplies affect the two species differently.
When food is limiting, seed-handling ability is the major factor determining survival of fortis, whereas access to cactus foods governs survival of scandens. G. scandens are cactus specialists, able to perform two tasks with long and pointed beaks. They are proficient at opening buds and fruits by tip biting (figs. 2.18 and 2.19), and are able to probe deeply into flowers to reach the basal nectar. Opening a bud gives them first access to a rich supply of pollen, and opening a fruit gives them first access to more than a hundred seeds surrounded by fleshy arils (Grant 1996). G. fortis, with blunt beaks, do not have the skill of scandens in opening buds or fruits, for mechanical reasons (Bowman 1961), and can only probe flowers when they have begun to open widely or have been opened by scandens (Grant and Grant 1981). The two species compete for food at times (chapter 8), but here is an example of the opposite, that is, nonmutual facilitation. G. magnirostris likewise benefits from scandens opening Opuntia fruits.
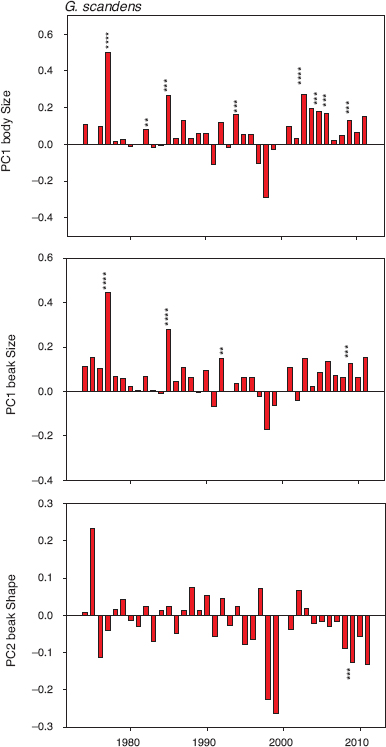
Fig. 11.2 Standardized selection differentials (coefficients) for scandens. Positive values indicate selection for large size or pointed beaks on the PC2 beak axis. Calculations and symbols as in figure 11.1. Significance of the coefficients is indicated by two to four asterisks: ** (p < 0.01), *** (p < 0.005), **** (p < 0.0001). Six differences significant at p < 0.05 are not shown, because the observed six are expected by chance in the 108 tests performed. Data were inadequate for analyses in 1973 and 2000. Sample sizes range from 31 to 300 (median = 93; table A.11.1).
STABILIZING SELECTION
Because it is a resource specialist, scandens might be subject to stabilizing selection on morphology more frequently than fortis. Assessed by variance tests, however, stabilizing selection is rare in both, and the species do not differ in the frequency of either stabilizing or diversifying (disruptive) selection (appendix 9.1). Polynomial regression analysis (Fairbairn and Preziosi 1996) gives a similar result. In those years of significant directional selection (figs. 11.1 and 11.2) there are no significant quadratic terms in the selection equations, with one marginal exception that is opposite to the expected: in 1977 scandens experienced disruptive selection on beak shape (PC2-beak) at p = 0.0317.
Morphological Trends
G. FORTIS
The expected consequence of selective mortality is morphological change. Specifically, fluctuating selection, together with high heritability of morphological traits, implies fluctuating morphological trajectories through time and not morphological constancy. Morphological trends of fortis over four decades meet this expectation (fig. 11.3). Trends are characterized by (1) long periods of stability, (2) short periods of abrupt change, and (3) a net change from beginning to end. If body size, beak size, and beak shape remained constant over periods as long as decades, we would see random fluctuations in our estimates of the means largely confined to the initial confidence limits on mean estimates. The initial confidence limits are highlighted in figure 11.3 by a pair of horizontal lines. In fact trajectories cross the boundaries, sometimes abruptly, and then remain outside.
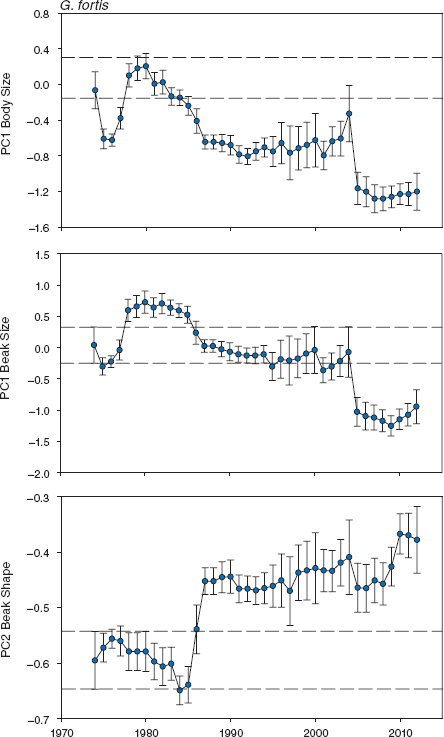
Fig. 11.3 General trends in fortis morphology based on principal components scores. Beak shape becomes increasingly pointed from bottom to top. Means and 95% confidence limits are shown for all birds alive in each year: in total 1,489 males, 968 females, and 1,593 birds of unknown sex. Parallel horizontal lines mark the upper and lower 95% confidence limits on the first estimate of a mean based on a large sample size (in 1973). Annual samples range from 30 to 932 (median = 270; table A.11.2). Statistical tests of annual heterogeneity use measurements of each bird only once, and they were grouped in years of known or inferred hatching: for body size F23, 3652 = 19.1497, p < 0.0001; for beak size F23, 3794 = 19.9620, p < 0.0001; and for beak shape F23, 3794 = 12.1604, p < 0.0001. Number of years = 24; in other years there was little or no breeding.
G. fortis changed in average body size and beak size in the mid-1970s and then again about 30 years later. We have no evidence that change occurred as a result of selection for or against hybrids (chapters 8–10). For example, when small birds were at a strong selective advantage in 2004–5, genetically identified hybrids (n = 20) survived no differently from nonhybrids (n = 52; χ12 = 0.02, p ≈ 1.0). The strongest change in beak shape occurred at a different time, in the mid-1980s (fig. 11.3). G. fortis became smaller over the whole period, and beaks became more pointed on average. Figure 11.4 shows how this was brought about. In the mid-1980s beak depth and width decreased without a concomitant change in beak length. Twenty years later the trend was reversed, abruptly, when all three dimensions changed at a time of selection against birds with large beaks. The pattern of changes reflected episodic directional selection much more strongly than the gradual changes caused by introgressive hybridization (chapters 9 and 10). Figure 7.6 shows the evolutionary responses to selection.
G. SCANDENS
Small-bodied birds were repeatedly at a selective disadvantage (fig. 11.2), yet average body size declined over the 40-year period (fig. 11.5)! How could this be? Where this kind of contradiction has been found elsewhere, it has been explained as the result of a deteriorating environment (Larsson et al. 1998, Merilä, Kruuk, and Sheldon 2001, Merilä, Sheldon, and Kruuk 2001, Pemberton 2010) or unmeasured selection opposing the known selection (Connor 2012). In the present case there is a simple alternative: introgressive hybridization, with genes transferred predominantly from fortis to scandens (chapter 9).
Selection and hybridization have opposite effects on some morphological features of scandens, and at different times, selection being measured as differential mortality in dry seasons and introgressive hybridization being production of offspring in wet seasons. Selection is episodic, introgression is continuous, and effects of introgression predominated, unlike in fortis, and determined the downward trend. Not only did mean body size decline, beak shape became increasingly robust (fig. 11.6), like that of fortis (fig. 11.3), but in this case there was no selection on beak shape, either opposing or congruent except in 2009 (fig. 11.2; fig. 7.5 shows the evolutionary response). Up to 1991 size and shape traits of scandens had remained approximately constant for 15 years after an initial decrease in size in the first four years. In 1991 the first breeding of fortis × scandens F1 hybrids occurred. They backcrossed to the scandens population (chapter 9), and after that all traits changed as introgression continued (fig. 8.13). Body size decreased, and stayed small, while beaks became progressively blunter (fig. 11.6). The temporal pattern of variation in individual beak traits (fig. 11.7) reveals that shape change was almost entirely due to a shortening of the beak. Beak length is the trait by which the species differ the most. It is the more important beak dimension of tip-biting scandens for opening cactus fruits and buds and probing flowers for nectar (Grant and Grant 1981).
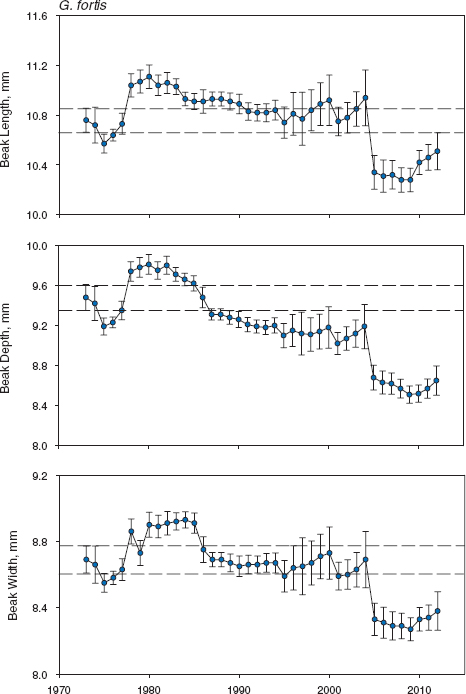
Fig. 11.4 Trends in fortis beak traits. Means and 95% confidence limits are shown for all birds alive in each year. Parallel horizontal lines mark the upper and lower 95% confidence limits on the first estimate of a mean based on a large sample size (in 1973). Sample sizes are in table A.11.2. Statistical tests of annual heterogeneity use measurements of each bird only once, and they were grouped in years of known or inferred hatching: for beak length F23, 3843 = 12.6158, p < 0.0001; for beak depth F23, 3796 = 30.0389, p < 0.0001; and for beak width F23, 3843 = 16.3765, p < 0.0001. Number of years = 24; in other years there was little or no breeding.
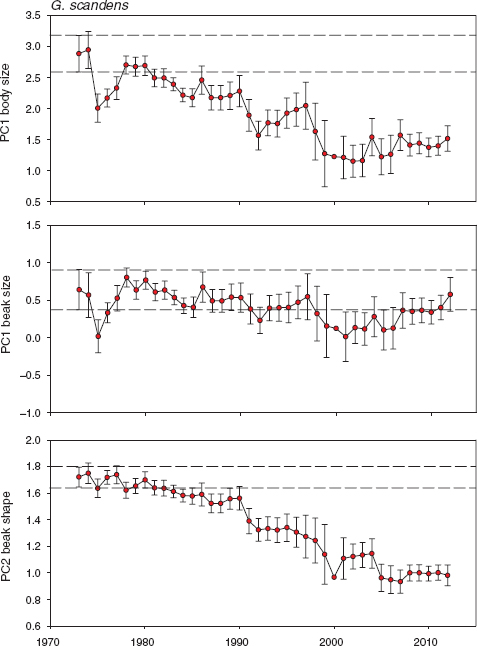
Fig. 11.5 General trends in scandens morphology based on principal components scores. Beak shape becomes increasingly pointed from bottom to top. Means and 95% confidence limits are shown for all birds alive in each year: in total 573 males, 390 females, and 458 birds of unknown sex. Parallel horizontal lines mark the upper and lower 95% confidence limits on the first estimate of a mean based on a large sample size (in 1973). Annual samples range from 15 to 346 (median = 104; table A.11.2). Statistical tests of annual heterogeneity use measurements of each bird only once, and they were grouped in years of known or inferred hatching: for body size F24, 1283 = 13.4603, p < 0.0001; for beak size F24, 1383 = 5.1526, p < 0.0001; and for beak shape F24, 1383 = 23.3570, p < 0.0001. Number of years = 25; in other years there was little or no breeding.
Backcrosses to scandens must have some advantage that offsets the social and feeding disadvantage at cactus flowers of being small and having a relatively short beak. At least part of the answer may be that females do not suffer the disadvantage as much as males do, and may have some cryptic advantage in avoiding conflict with males. Male scandens generally survive better than females, especially in the first year, and become recruits at a higher rate, but in hybrids (F1 and backcrosses combined) the relative success of males and females is reversed: 10 males and 16 females that were identified from pedigrees were recruited as F1 and B1–3 generations.
G. MAGNIROSTRIS
The population of magnirostris underwent morphological change, but the interpretation of the changes is not as straightforward as it is with fortis and scandens. G. fortis and scandens are residents, and there is negligible immigration of these species from other islands (chapter 9). Presumably there is little emigration too (chapter 4), and so selective losses to their populations on Daphne can be confidently attributed to local mortality. The situation with magnirostris is different because the population is open to immigration to an unknown extent (chapter 6), possibly subject to losses from emigration (return to natal island), and therefore interpretation of morphological trends is less clear-cut.
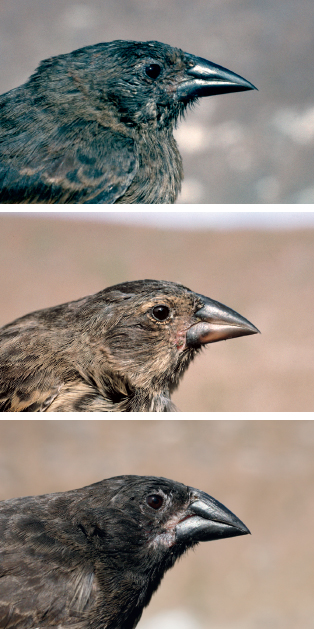
Fig. 11.6 Changes in beak size and shape of Cactus Finches. Upper: Representative of beak shape in the first part of the study. Middle: Representative of a later, more blunt, beak. Lower: Even blunter beak at the end of the study.
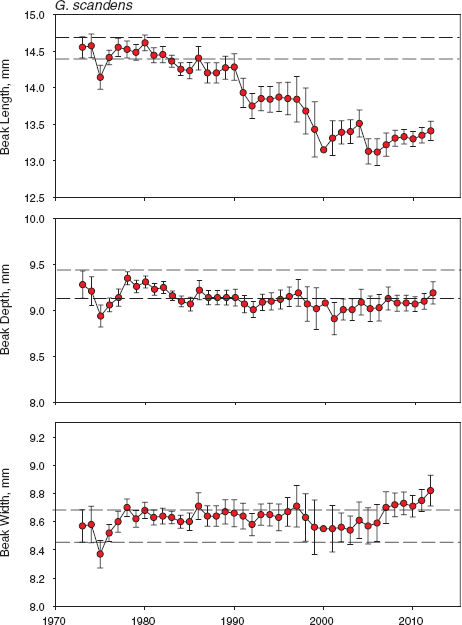
Fig. 11.7 Trends in scandens beak traits. Means and 95% confidence limits are shown for all birds alive in each year. Parallel horizontal lines mark the upper and lower 95% confidence limits on the first estimate of a mean based on a large sample size (in 1973). Sample sizes are in table A.11.2. Statistical tests of annual heterogeneity use measurements of each bird only once, and they were grouped in years of known or inferred hatching: for beak length F24, 1394 = 21.7832, p < 0.0001; for beak depth F24, 1383 = 5.1526, p < 0.0001; and for beak width F24, 1394 = 3.9776, p < 0.0001. Number of years = 25; in other years there was little or no breeding.
Three periods can be recognized in the history of magnirostris during the study: a prebreeding phase up to 1982 with recurrent immigration (I), a low-density breeding phase up to 1997 with occasional immigration (II), and a generally high-density phase (fig. 6.1) thereafter (III) with little immigration or addition of new alleles (fig. 9.3). Toward the end of the high-density breeding phase we became aware of an apparent change in beak size and found, when measurements were analyzed, that indeed the birds were not the same as they had been at the beginning of the study (fig. 6.5). Average beak size had increased despite fluctuations from year to year and continued to do so (fig. 11.8). Beak shape had become slightly more robust (fig. 11.8), as a result of greater increases in depth and width than in beak length (fig. 11.9). In contrast to these trends average body size had remained unchanged (fig. 11.8), which shows that the beak-size trend cannot simply be attributed to correlated effects of a change in overall body size as in fortis.
Potentially, the beak-size trend could be caused by variation in growth if adult beaks increase in size with age and if old birds dominated the later samples. This possibility can be ruled out (appendix 3.2). Another factor, introgressive hybridization, can be ignored because magnirostris never hybridized on Daphne during the study.
THE POSSIBLE ROLE OF SELECTION ON G. MAGNIROSTRIS
Trends in beak size and shape were more the result of gradual accumulated change over several years than the result of occasionally strong change from year to year, as happened in fortis. We draw this conclusion from analyses of year-to-year selection, recognizing that sample sizes of adults are generally not large, and so the absence of demonstrable selection may simply mean we have failed to demonstrate it. For example, the 7 individuals that survived the drought of 2004 and bred in 2005 were large in beak and body size, and had robust beaks, compared with the 71 that died, but the selection coefficients were not significant (fig. 11.10). In two years the evidence for selection on beak size is strong. Birds with large beaks survived better than those with small beaks in 1993 and again in 1994. In three other years, 2006–8, the evidence is statistically weaker but points in the same direction. In two different years, 1992 and 2011, the evidence for selection on beak shape is strong (fig. 11.10). Generally small fluctuations that are random in direction predominate in other years.
The samples in 1993 and 1994 were large because they comprised several new immigrants together with the products of local breeding (next section). Thus the selective disadvantage of individuals with relatively small beaks should be understood to mean disappearance through death or emigration. In contrast, we believe there were relatively few immigrants on the island in 2006–8, when weaker beak-size selection occurred, and therefore birds that disappeared probably died on Daphne.
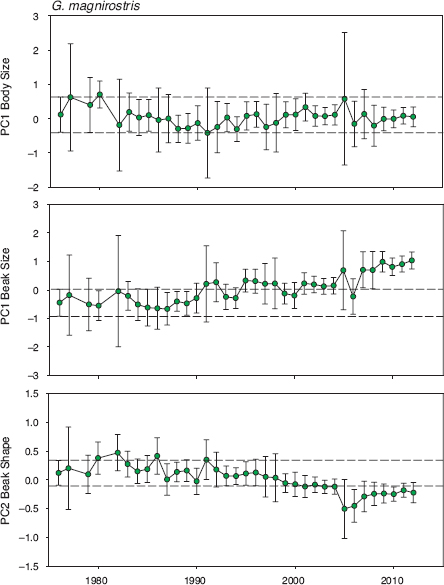
Fig. 11.8 General trends in magnirostris morphology based on principal components scores. Beak shape becomes increasingly pointed from bottom to top. Means and 95% confidence limits are shown for all birds alive in each year: in total 204 males, 141 females, and 291 birds of unknown sex. Annual sample sizes are in table A.11.2. Considering birds only in their first year of measurement, there is statistical heterogeneity in beak size (F29, 602 = 3.0369, p < 0.0001) and beak shape (F29, 602 = 2.3211, p < 0.0001) but not body size (F29, 602 = 1.2153, p = 0.2042). Linear regression analyses of annual means give the same results. There are no first-capture data for 1978, 1986, 1990, 1997, 2000, and 2005. Note that PC1 body scores are correlated with PC1 beak scores (n = 632, r = 0.6267, p < 0.0001) but not with PC2 beak scores (n = 632, r = 0.0671, p > 0.1).
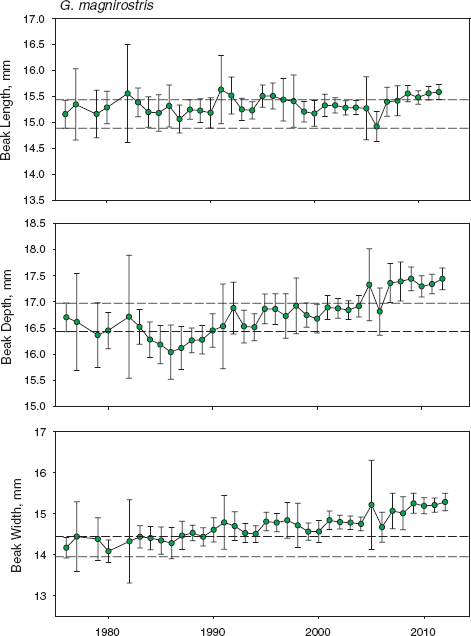
Fig. 11.9 Trends in magnirostris beak traits. Means and 95% confidence limits are shown for all birds alive in each year as in figure 11.8. Sample sizes are in table A.11.2. There is statistical heterogeneity in beak depth (F29, 602 = 3.7106, p < 0.0001) and beak width (F29, 602 = 3.9776, p < 0.0001) but not beak length (F29, 602 = 1.3359, p = 0.1141). Linear regression analyses of annual means give the same results. Slopes are almost identical for beak depth (0.0279 ± 0.0061 s.e.) and width (0.0281 ± 0.0053). Statistical significance is not altered in any analysis after excluding means from four years with sample sizes of fewer than five individuals.
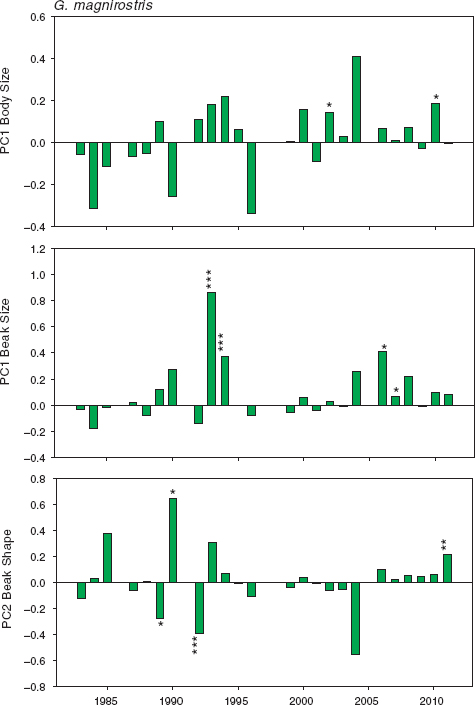
Fig. 11.10 Standardized selection differentials for magnirostris, calculated for each sample surviving from year x to year x + 1. Positive values indicate selection for large size or pointed beaks. Males and females were combined with adults of unknown sex because separate selection analyses of males and females give similar results. Sample sizes in 20 years range from 20 to 103 (median = 42; table A.11.1). There are no selection coefficients for 1986, 1991, 1997, 1998, and 2005, because sample sizes were smaller than 20. Significance levels are shown without correction for multiple testing or lack of independence: * p < 0.05, ** p < 0.01, *** p < 0.005. Sixty tests were performed, so 3 are expected to yield differences that are significant at p < 0.05. Since more than twice this number were observed (8), they are shown in the figure.
IMMIGRATION
Immigrants may have contributed to the gradual changes in mean beak morphology. Unambiguous identification of immigrants is possible only in the years up to 1982–83, when the birds first bred on the island. We can be almost certain of their identity at two times after this. The first was in 1988–89, when many birds appeared on Daphne, in numbers far in excess of the one or two individuals hatched in 1987 that we might have missed when banding offspring. The second time was in 1993–94, when again there was a large influx of birds too numerous to have hatched on the island in 1992. Immigration after 2000 was infrequent, as indicated by the small number of new alleles and low average heterozygosity (figs. 6.6 and 10.12).
At the first of these two times the presumed immigrants (n = 41) did not differ in mean body size, beak size, or beak shape from the known offspring produced on Daphne that year (n = 5). At the second time, however, the presumed immigrants (n = 80) were smaller in average beak size than the known resident offspring (n = 14; t = 4.116, p < 0.0001), and therefore were not responsible for the increase in mean beak size. They did not differ in body size or beak shape from the residents either (p > 0.1).
However, the immigrants were also more variable in beak size than the local offspring (Levene’s test, F1,92 = 11.424, p = 0.0011), which is consistent with a heterogeneous origin from different islands. Large variation in beak size of the immigrants provides ample scope for nonrandom settlement and establishment on the island. Settlement may depend in part on beak size if, for example, those with large beaks have a feeding advantage and are in better energetic condition than those with small beaks. Indeed, immigrants that persisted on Daphne for at least one year after being banded (n = 31) had larger beaks than those that did not (n = 49; t = 4.800, p < 0.0001). Local persistence was therefore not random (see also fig. 11.10). To investigate this further, we repeated the test of residents versus immigrants with just those that survived locally for a year. As expected, this eliminated the difference in beak size (t = 0.171, p = 0.8652), while the difference in variances remained (Levene’s test, F1,43 = 10.629, p = 0.0022). The relatively small birds that disappeared either died (selection) or dispersed (emigration).
THE CAUSE OF THE BEAK-SIZE TREND
G. magnirostris with large and robust beaks may gain an energetic and fitness (survival) advantage from their ability to rapidly crack open the large and hard fruits of Tribulus cistoides and seeds of Opuntia echios. The finches that came to Daphne, mainly from Santa Cruz Island, and remained to breed may have been adapted to a different and diverse set of foods on the source island, and less adapted to the foods on Daphne. They and their descendants were then subject to selection. G. magnirostris are relatively rare on Santa Cruz island, and the feeding data to test these ideas have not been obtained. Individuals of either sex with large beaks may also have gained an additional mating advantage over those with smaller beaks.
Allometry of Means
In single samples from a population all traits of all species increase in size as body size increases, whether body size is measured by mass, by a proxy dimension such as wing length or tarsus length, or by the synthetic variable PC1. Nevertheless traits do not scale with body size in an identical way (Boag 1984). The previous chapter provided examples of allometric relations between variables in samples at one time. Here we use averages of two beak traits to illustrate the changes in proportions that occur over many years.
Samples of adults in different years differ in their (static) allometries of means, and all three species are unique (fig. 11.11). Beak length and beak depth scale with body size similarly but not equally in fortis (fig. 11.11 legend). Beak length increases with body size in scandens much faster than beak depth, which scarcely increases at all, whereas the opposite is true for magnirostris. The contrast between species is interesting because length is the more important beak dimension of tip-biting scandens for opening cactus buds and probing flowers for nectar, whereas depth is the more important beak dimension of seed-cracking magnirostris. The figure brings out the additional point that depth is more pronounced in relation to length in magnirostris when compared with the other two species.
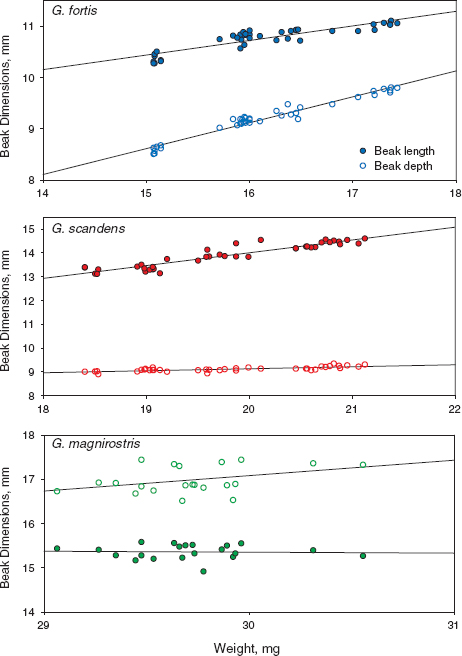
Fig. 11.11 Scaling relationships: mean beak length and depth (mm) in relation to mean mass (weight, g) in each year from 1973 to 2012. Lines are least-squares best fits from linear regressions. Allometric slopes are estimated with logarithmically transformed data. Beak depth (0.903 ± 0.031 s.e.) increases faster with weight than does beak length (0.432 ± 0.034) in fortis, whereas the opposite occurs in scandens: beak length (0.754 ± 0.046) increases faster than beak depth (0.183 ± 0.026) with weight. All four slopes differ from zero at p < 0.0001, and from each other. The slopes for magnirostris (1992–2012 only) are not significant (p > 0.1). Reduced major-axis regressions have different slope coefficients, but the contrasts are the same as in logarithmic analyses.
Annual changes in fortis took place along a single line of allometry of means as a simple consequence of scaling until 1985, when an abrupt shift took place (fig. 11.12). After 1985 annual changes occurred along an altered but parallel line of allometry, even when both beak dimensions underwent a major reduction in average size in 2004–5. Thus changes in beak shape occurred in three ways, along two different but parallel lines of allometry and across an abrupt transition between them. Annual changes in scandens and magnirostris show similar abrupt transitions, but later and at different times. These are examples on a microevolutionary scale of a macroevolutionary pattern referred to in the introduction to this chapter: long-term stasis punctuated by rare, abrupt, and substantial change.
Natural and Artificial Selection
Unlike some regimes of artificial selection, natural selection trims but does not truncate one end of a size-frequency distribution: some individuals of all sizes survive (fig. 7.6). The next generation has a frequency distribution around a larger or smaller mean. Recombination gives rise to some individuals beyond the previous range of morphologies and genotypes. With continued artificial selection in the same direction the mean continues to increase in that direction, generation after generation, until the variation runs out or is replenished by new mutations. This may be a good model for evolution when the environment changes substantially, and for sustained directional coevolution between a consumer and the consumed (Benkman et al. 2013) or predator and prey (Thompson 2013). However, episodic and fluctuating natural selection, as observed here with fortis, lasts for less than one generation and results in little net divergence. Continued directional introgression, on the other hand, produces continued directional change (fig. 10.11).
Conclusion
The most significant finding of our study has been the dynamic nature of morphological variation in all three species. Morphologically the finch species are not static, not fixed at some long-term average of body size or beak size that could be interpreted as an optimum, but dynamic and changing in response to a changing environment. All terrestrial environments undergo change (Bell 2010), some more strongly than others, some more erratically than others. Therefore similar microevolutionary change is to be expected in other organisms, although the magnitude of those changes may be much smaller than the changes we have documented in Darwin’s finches over several decades.
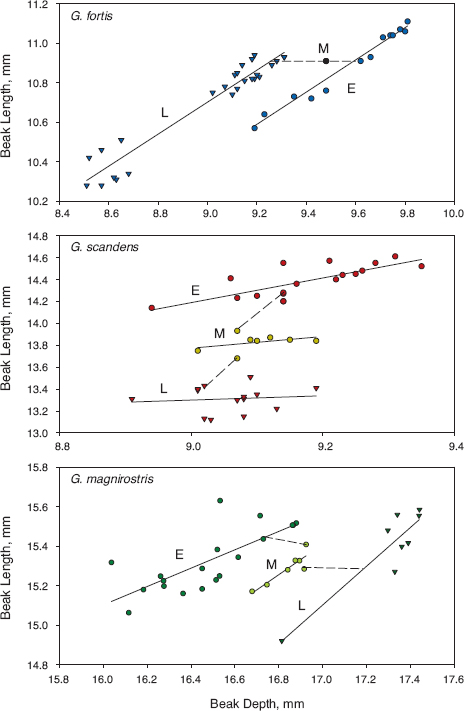
Fig. 11.12 Changes in the relationship between average beak length and average beak depth (mm) in the three species. E, M, and L refer to early, middle, and late years in the 40-year study. Solid lines are least-squares best fits from linear regressions, and broken lines connect early, middle, and late phase morphologies.
Summary
This chapter provides a long-term perspective to the evolutionary changes produced by natural selection described in previous chapters. G. fortis, scandens, and magnirostris each changed morphologically over four decades, but in different ways. Strong changes in body size, beak size, and beak shape occurred in fortis, rarely, and in opposite directions, primarily as a result of fluctuating directional selection associated with droughts and only to a minor extent from introgressive hybridization. Selection differentials were large. The relative importance of selection and hybridization was reversed in scandens. Despite large size being selectively favored repeatedly in this population, average body size declined, because effects of introgressive hybridization with fortis and high relative fitness of hybrids outweighed effects of selection. G. magnirostris changed gradually toward large beak size and robust beak shape, but not in body size, partly as a result of selection in small steps and possibly also by size-differential immigration. The three species display striking differences in beak shape when analyzed as a function of time. Both fortis and magnirostris underwent abrupt transitions in the allometric relationship between beak length and beak depth: average beak depth changed, but beak length did not. Change in scandens allometry was just as strong but occurred primarily as a result of change in beak length and not depth. Morphological differences between species were associated with different feeding modes and diets. G. fortis and magnirostris are primarily seedeaters. Key to the change in beak dimensions of fortis, and possibly magnirostris, was their abilities at handling seeds of different sizes and hardnesses. G. scandens is a specialist on cactus products, and in this species access to foods in addition to food-handling skills is likely to have determined survival. Large size is advantageous because it confers social dominance at these restricted food sources.