4
Natural Selection and Evolution
It may be said that natural selection is daily and hourly scrutinizing, throughout the world, every variation, even the slightest.
(Darwin 1859, p. 84)
We now know that species are always evolving. Natural selection constantly adjusts the traits of populations generation after generation.
(Thompson 2013, p. vii)
Introduction
G. FORTIS IS HIGHLY VARIABLE IN SIZE, and the variation is strongly heritable; therefore it has the potential to evolve when the environment changes. This chapter describes what we learned about selection and evolution by following the population through contrasting regimes of wet and dry conditions. Figure 4.1 provides a general framework for the specific observations we describe. It shows how fitness of individuals varies according to the interaction between genotypes, phenotypes, and both social and general aspects of the environment. The center point, indeed the central focus of our field study of evolution, is phenotypic variation. We work back to the genetic variation that generates it, and forward to the fitness variation that ensues. We will refer to this figure several times later in the book.
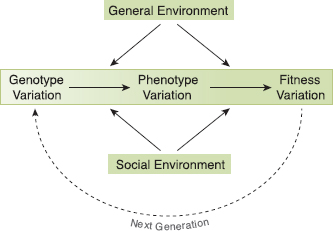
Fig. 4.1 The genotype-phenotype-environment interaction affects fitness. A distinction is made between the social environment of other finches and all other biological and abiotic aspects of the environment. Finches (phenotypes) also affect their environment, for example, when differentially depleting the food supply (this chapter) and destroying the stigmas of cactus flowers (Fig. 2.17; Grant and Grant 1981), and this has feedback effects on fitness.
Expectations
On our first two visits in 1973 the contrast between a wet productive season and a dry nonproductive season was striking (Grant et al. 1976). It led us to speculate that over a long period of time there might be pronounced annual as well as seasonal variation in rain and food production. We reasoned this would have a strong effect upon both the sizes and composition of the population. We then argued that natural selection would fluctuate, favoring different optima in different years, as others have suggested for other systems (Rothstein 1973; reviewed in Bell 2010). Large species would be the most affected, we believed, because fluctuations of the less abundant large seeds would have a potentially greater effect upon birds than fluctuations of the more abundant small seeds (Grant et al. 1976). Hints of natural selection came from two types of observation. First fortis individuals with large beaks were found to crack the moderately hard seeds of Opuntia echios (fig. 2.18) and the harder, cherry-like “stones” of Bursera malacophylla (fig. 2.8; see also fig. 6.10) that others with smaller beaks did not attempt to crack. Those with large beaks also cracked Opuntia seeds faster than did others with smaller beaks. Second, between December 1973 and March 1974 fortis individuals with long beak tips survived best. Their advantage might have come from an ability to procure seeds in small cracks and depressions in the rocky substrate (Grant et al. 1976).
These observations and extrapolations were a strong motivation to continue the study by returning in both breeding and nonbreeding season to follow the fates of measured and identified birds. Return visits enabled us to estimate heritabilities of morphological traits (chapter 3) and thereby establish a high potential for evolutionary change by natural selection. We did not have to wait long for that potential to be translated into realized evolution.
Natural Selection
Four years after the study began, the archipelago experienced a severe drought (fig. 4.2). Only 24 mm of rain fell on Daphne in the entire wet season of 1977, there was little growth of plants, almost no production of arthropods, and fortis did not breed (Boag and Grant 1984b). Almost a thousand birds had been banded and measured, so we were able to follow their fates at intervals up to the end of the drought when the rains returned in January 1978. We found that only 1 of 388 nestlings banded in 1976 survived to 1978 (fig. 4.3, Boag and Grant 1981), and only 15% of adults survived. Importantly, adult survival (or mortality) was not random with respect to size; large birds survived better than small ones (fig. 4.4). Natural selection had occurred. It was surely no coincidence that the single surviving nestling was in the top 1% of the sample of measured birds alive in 1976 (n = 932) in weight, beak depth, and beak width.

Fig. 4.2 Effects of drought on the vegetation. Upper: Chamaesyce amplexicaulis on the rim of sector 20 (fig. A.3.1), with Daphne Chica in the background. Lower: the same view in a drought.

Fig. 4.3 Drought survivors. Left: The only fortis (number 1929) of the 1976 cohort to survive the 1977 drought. His beak was exceptionally large. Right: One of the longest-lived fortis (number 2666), hatched in 1978 and lived to 1994. He was genotyped as an F1 hybrid (fortis × scandens) and was probably an extra-pair hybrid offspring, since the social parents were both fortis and a nest mate, unlike him, had typical fortis measurements (Grant and Price 1981).
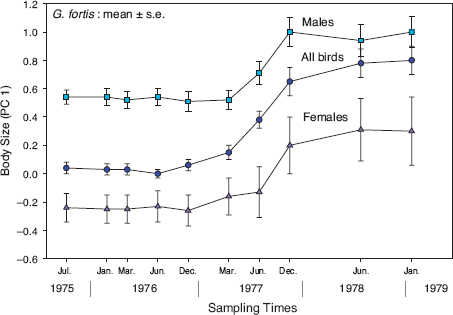
Fig. 4.4 Natural selection on fortis body size, indexed by PC1 scores that are explained in the table 3.2 legend. Solid symbols represent means; vertical bars indicate one standard error. Sample sizes of males (n = 198) and females (n = 66) combined with birds of unknown sex (all birds) varied from 642 in June 1976 to 61 in January 1979. There was no breeding in 1977, and the steady increase throughout the drought that year was the result of selective mortality of small birds. From Boag and Grant 1981.
Birds that disappeared might have flown to other islands; however, most appear to have died on the island, to judge from those we found dead. Measurements of 38 individuals banded before June 1976 and found dead on Daphne in 1977 and early 1978 were statistically indistinguishable from measurements of the other birds missing from the postselection population but not found. Furthermore, like those missing birds, the dead were significantly smaller than the survivors. The entire sample and males and females treated separately showed the same pattern. Thus the cause of disappearance was predominantly if not entirely death on the island.
CAUSES OF SELECTIVE MORTALITY
In the absence of any indication of emigration, disease, substantial predation, or abrupt temperature change being the cause of disappearance, the principal cause must have been death due to starvation. This interpretation is supported by the parallel declines in population size and seed abundance in 1977 (fig. 4.5), coupled with the fact that small seeds declined in abundance faster than large seeds, and as a result the average size and hardness of available seeds sharply increased. New seeds were not produced at this time; therefore the finches themselves brought about the change in composition by consuming seeds differentially.
Initially they depleted the supply of small and soft seeds, and as these seeds became increasingly difficult to find, the finches had to turn progressively more to the large and hard seeds such as those produced by Opuntia echios and Tribulus cistoides. For example in May 1976 only 17% of feeding was on medium and large seeds, while one year later the figure had risen to 49%. Only large fortis with large beaks are able to crack hard seeds, and only the largest can do so quickly and efficiently (Grant 1981b, Boag and Grant 1984a, Price 1987), so they survived best by exploiting these valuable foods. They may have gained two extra advantages, first in being able to dissipate heat loss without water from the base of their beaks better than smaller birds (Greenberg et al. 2012), and second in being socially dominant at contested food sources (Boag and Grant 1981).
This was the most intense selection recorded for continuously varying traits in a natural population at that time (Boag and Grant 1981). It was especially intense for females. They are smaller than males by about 4% on average, and proportionately more of them died. As a result of differential and size-selective mortality a roughly equal sex ratio in 1976 became skewed to as much as 6:1 before falling to 3:1 at the time of breeding in 1978 (Boag and Grant 1984b). Size-selective mortality and the dependence of finches on a declining supply of seeds ceased a little earlier, at the end of 1977, when Opuntia cactus began flowering. All birds fed heavily on its pollen and nectar (figs. 2.17 and 2.19), and their body condition, which had been gradually deteriorating, noticeably improved. Molting resumed then after a hiatus of more than a year for most birds.
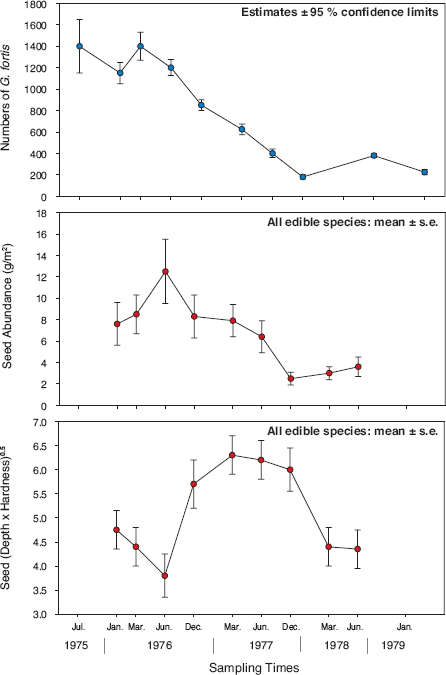
Fig. 4.5 Temporal changes in fortis numbers and their principal dry-season food in the drought of 1977. Upper: Finch population estimates and 95% confidence limits derived from a Lincoln index based on regular visual censuses of marked birds throughout the island. Middle: Estimates of mean seed abundance and one standard error. Lower: Estimates of the average size-hardness index (DH1/2) of edible seeds and one standard error. D is the depth of seed, its second-longest dimension, and H is its hardness, measured as the force in newtons needed to crack it open (box 2.1). From Boag and Grant 1981 and Grant 1986.
THE TARGETS OF SELECTION
What exactly were the targets of selection, the traits that made a difference between life and death? Two discriminant function analyses pinpointed beak depth as a key variable (Boag and Grant 1981). In the first analysis, birds that were observed to feed solely on small seeds were compared with those seen to feed on medium and large seeds. The standardized coefficients of the discriminant function that separated the two groups with different diets gave greater weight to beak depth than to the six other morphological variables (wing length, beak length, etc). In the second analysis, males that survived and died were compared. Beak depth was the strongest contributor (highest coefficient) to the discrimination of the two groups. This analysis was repeated with females, and beak depth was found to be the third-strongest variable in the discriminant function after beak length and an index of beak pointedness. Thus fortis with deep beaks fed on large seeds and survived best.
The importance of beak depth for survival was confirmed by selection analysis (Price et al. 1984b). For a cluster of intercorrelated variables the partial regression method developed by Lande and Arnold (1983) allows identification of the direct relationship between any one of them and fitness (survival) while holding constant the statistical effects of the other variables on fitness (box 4.1). Success of this method is in part dependent on large samples of measurements (Hersch and Phillips 2004), which we have. Survivors were larger than nonsurvivors in all dimensions, as shown by the selection differentials (s) in table 4.1. Nevertheless beak depth and body size were most strongly associated directly with fitness, as shown by the entries (β) in the selection gradient—the partial regression coefficients—and therefore these were the primary “targets” of selection.
Box 4.1 Selection Analysis
We have used the following procedure to estimate selection (Lande and Arnold 1983). Before each analysis we ln-transformed morphological data and then standardized them by dividing by the standard deviation so that they had zero mean and unit variance. Relative fitnesses were obtained by dividing absolute fitness (0 or 1) by the absolute mean fitness, that is, the proportion surviving. The net effect of selection on a trait, the selection differential (s), combines the direct effect with indirect effects arising from correlations with other measured traits. It is simply measured as the difference between the mean value of the trait before and after selection. Statistical significance of the selection coefficient was assessed with t-tests comparing survivors and nonsurvivors. Multiple regression analysis was used to separate the direct effects of selection from indirect effects. The direct effect of selection on each trait, or selection gradient (β), was estimated by the partial regression coefficient of relative fitness (survival) on each trait. Significance of the gradients was checked with t-tests of the coefficients from a logistic regression analysis.
Evolution in Response to Selection
Given the high heritability of beak and other dimensions of fortis (chapter 3), an evolutionary response to strong selection is to be expected in the next generation, and was in fact observed in 1978 (fig. 4.6). As a result of the 1977 selection episode the mean value of all six traits increased in the next generation (1978) to a varying extent (0.21–1.07 standard deviations [s.d.]; Grant and Grant 1995a).
Observed responses can be compared with responses that are predicted by taking into account the genetic correlations between characters (Lande 1979), as explained in box 4.2. Actual evolutionary responses to selection closely matched the predictions (fig. 4.6; Grant and Grant 1995a), so if any targets were omitted from our analysis, they must have been either highly correlated with the included ones or entirely independent of them. The offspring were large, though smaller on average than their parents as is to be expected from heritabilities that are less than 1.0. Large size of the offspring could be attributed in part to the highly favorable growth conditions that year (Boag 1983), since the breeding density was low in 1978 and food relatively plentiful. The effect, if present, seems to have been minor because parents that bred in the same pairs in 1978 and again in 1981 under more crowded conditions (n = 7 families) produced offspring of the same size in the two years (Grant and Grant 1995a).
TABLE 4.1
Standardized selection differentials (s) and entries in a standardized selection gradient (β) with standard errors (s.e.) for two periods of heavy mortality associated with dry conditions

Note: Coefficients in boldface are significantly different from zero at p < 0.05. Variances remained unchanged by selection. From Price et al. 1984a.
Selection Occurs Repeatedly
Selection occurs repeatedly and in the same direction when the same or similar environmental conditions are repeated. We observed this in two dry periods that followed in the half-dozen years after the drought of 1976–77. In the first, from the middle of 1979 to the end of 1980, 53 mm of rain fell, 22% of fortis adults died, and although there was no significant selection, the signs of the selection coefficients were the same as in an equivalent 18-month period in 1976–77 (Price et al. 1984b). In the second period, in 1981–82, 51 mm of rain fell, 35% of adults died, and beak depth and weight were once again selected traits and in the same direction as in 1976–77 (table 4.1).
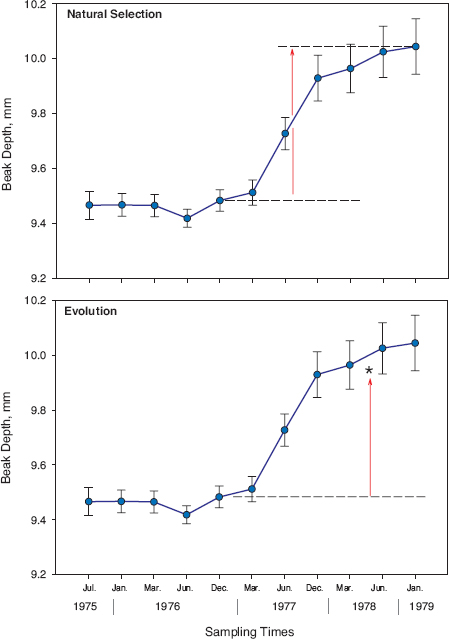
Fig. 4.6 Natural selection within one generation (above) followed by evolutionary change between generations (below). The asterisk (below) indicates the average beak depth of the next generation (9.94 mm), which is the observed evolutionary response to natural selection. It is well within sampling error of the predicted average (9.83 mm) (Grant and Grant 1995a). From Grant and Grant 2010a.
Box 4.2 Prediction of Evolution
Evolution occurs when the effects of selection on a heritable trait in one generation are transmitted to the next generation. An evolutionary response to selection is calculated as the difference between the mean of a trait before selection and the mean of the same trait in the offspring. The observed response may then be compared with the response predicted from the net selection (box 4.1) and the inheritance of the trait. In the simplest case a single heritable trait is subject to directional natural selection. The response (R) to selection is then estimated by the product of the heritability of the trait (h2) and the strength of selection, which is measured by the selection differential (s). Thus R = h2s. This is the breeders’ equation (Falconer and Mackay 1995). The breeders’ equation does not work well in several situations where either heritabilities or selection coefficients are small and imprecisely estimated, and when traits are phenotypically plastic (Kruuk et al. 2008). When two (or more) traits (i and j) are subject to selection, an evolutionary response is predicted on the basis of the strength of selection on each trait (βi, βj), the genetic variance of each trait (Gii, Gjj), and the genetic covariance between the traits (Gij) (Lande 1979); see box 4.1 for the β coefficients. This is usually represented in matrix form, Δ = GP-1S, where G and P are genetic and phenotypic variance-covariance matrices, S is a vector of selection differentials, and Δ
 is a vector of changes in morphological trait means. In the case of two traits, such as beak length and beak width (Grant and Grant 1993), the analysis is reduced to
Δ 1 = β1G11 + β2G12
Δ 2 = β2G22 + β1G21
The first term on the right-hand side of each equation represents the direct response to selection on the trait, and the second term represents the indirect response arising from the direct effect of selection on a genetically correlated trait. Note that when several correlated traits are in the analysis, their indirect effects may cancel if the β coefficients are of opposite sign, even when all genetic correlations are positive, as in the finches (Grant and Grant 1994). The cumulative indirect effects may be so large as to overwhelm the direct effects. For possible biases in analyses and interpretation see Grant and Grant (1995a).
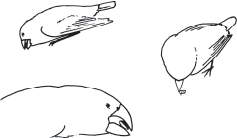
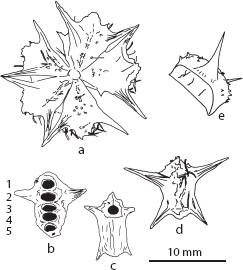
Fig. 4.7 G. fortis use different maneuvers to open Tribulus mericarps and extract the seeds: either by crushing or by twisting and biting at the corners. Exploited mericarps are shown below. Small individuals sometimes feed parasitically by waiting for a large finch to split a mericarp into two by crushing it, and then seizing an ejected seed. From Grant 1981b.
Surprisingly, fitness was negatively associated with beak width after other traits were controlled, as in 1976–77 (table 4.1). This may be biologically significant: some birds, especially the smaller ones, twist the end of a Tribulus fruit to extract a seed, and a relatively narrow beak may facilitate this maneuver (fig. 4.7; Grant 1981b, Price 1987). However, there is some doubt about this because the beak width result might be partly a statistical artifact arising from the strong correlation between beak depth and width. This is the problem of multicolinearity; there is so little independent variation in either one of two strongly correlated characters that variation in each of them cannot be reliably associated with a third variable such as fitness. The phenotypic correlation between beak depth and beak width is 0.89 (Grant and Grant 1994), and since R2 = 0.892 ≈ 0.80, only 20% (1 − R2) of one dimension varies independently of the other. In contrast to this pair of variables, separate correlations between each of them and beak length are less than 0.75, and therefore a large amount of variation in beak length, approximately half, is independent of variation in beak depth and beak width. Notice in table 4.1 that the net effect (s) of selection on beak width in 1977 was positive, even though the direct effect (β) was negative, because the direct effect was overwhelmed by positive selection on all the other, positively correlated, characters.
Selection Oscillates In Direction
By extending the study beyond the first few years, we learned that selection changes direction. Changes in the terrestrial environment are driven by interannual variation in rainfall (fig. 4.8). The environment changed profoundly in 1982–83 (figs. 4.9–4.11) with abundant rain (1,359 mm; fig. 4.12) and a prolonged wet season (eight months) associated with an exceptional El Niño event (Gibbs and Grant 1987a).
This transformed the composition of the seed supply from one dominated by large and hard seeds to one dominated by small and soft seeds (fig. 4.13). There was no immediate selective effect on fortis; survival was high, and effects were delayed. In the following year 53 mm of rain fell, and finches bred once or twice, but then a drought began, and the island received a mere 4 mm of rain in two days throughout the whole of 1985. The drought ended in 1986 with the return of rain (49 mm) and a partial resumption of breeding, which was almost entirely unsuccessful.
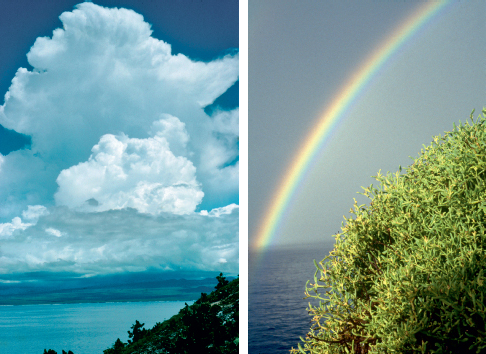
Fig. 4.8 Weather. Left: Typical cumulus clouds in the wet season over Santa Cruz. Right: Rainbow, same view.
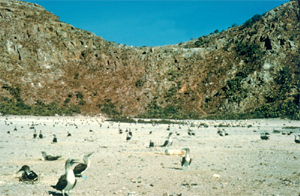
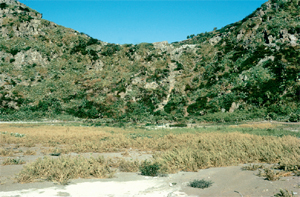
Fig. 4.9 Effects of El Niño. Right: Breeding of Blue-footed Boobies, Sula nebouxii, in March 1976. Left: Same view in the El Niño year of 1983, showing the effects of abundant rain on the crater and surrounding vegetation, and the absence of boobies (N. Grant).
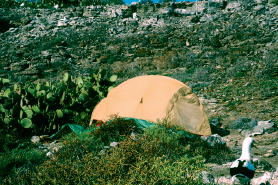
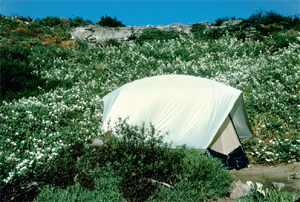
Fig. 4.10 Rampant growth. Right: The only place to put a tent is on the outer slope in sector 20 (fig. A.3.1), shown in 1975. Left: Same view in 1983, an El Niño year, after abundant rain has promoted prolific growth and flowering of Cacabus miersii.

Fig. 4.11 Seasonal and annual variation in vegetation. Upper left: Dry season (Bursera malacophylla trees are leafless). Upper middle: Wet season (trees are in leaf). Upper right: Extensive growth of annual plants in early stages of El Niño development. Lower left: Late stage of El Niño. Lower middle: Cactus bush almost smothered by Merremia aegyptica vines. Lower right: Aftermath of El Niño (dead vines drape cactus bushes and trees). From Grant and Grant 2008a.
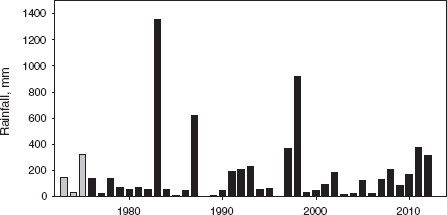
Fig. 4.12 Variation in total annual rainfall on Daphne. The unknown rainfall in 1973–75 (gray bars) has been estimated from a relationship between annual rainfall on Daphne and at the Charles Darwin Research Station on Santa Cruz Island (r = 0.93).
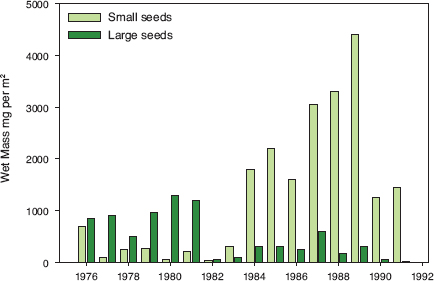
Fig. 4.13 Changes in seed composition associated with the El Niño event of 1982–83. Values are mean wet mass in milligrams per square meter. The seed supply was sampled twice a year from 1976 to 1991 and averaged (chapter 2). Annual totals for each seed species were converted to biomass by multiplying by their mean wet mass. Individual seeds fall into three discrete size-hardness classes. More than 20 species contribute to the small-soft category (size-hardness index DH1/2 < 2), and of these only 14 are common (appendix 1.1). Tribulus cistoides is the only species in the large-hard category (DH1/2 ≈ 10). The third class (DH1/2 = 2–7), not shown, comprises seeds of Opuntia echios, Desmodium glabrum, Tephrosia decumbens, Cenchrus platyacanthus, and Bursera malacophylla; the last two are consumed as they ripen, and only Opuntia echios contributes substantially to the regular dry-season food supply. Mean biomass of small-soft seeds was 206.14 ± 76.74 mg (s.e.) per square meter in the seven years before the 1982–83 El Niño event, and 2441.0 ± 361.49 mg in the eight following years. Mean biomass of large-hard seeds was 843.89 ± 165.07 mg before 1983 and 244.66 ± 50.96 mg afterward. From Grant and Grant 1993.
TABLE 4.2
Standardized selection differentials (s) and entries in a standardized selection gradient (β) with standard errors (s.e.) for two periods of heavy mortality associated with dry conditions before (1976–77) and after (1984–86) the El Niño perturbation of 1982–83

Note: Coefficients in boldface are significantly different from zero at p < 0.05. From Grant and Grant (1995a). Small corrections to the sample for 1976–77 in table 4.1 and inclusion of wing length and tarsus length changed coefficients for the other variables to a minor extent.
The critical years were 1984 to 1987, when adults survived poorly (32%; Gibbs and Grant 1987a). Although the seed supply declined during 1984 and 1985, it remained higher than in 1977 and 1982. More important than numbers was the composition; the proportion of the total seed biomass made up by small soft seeds in 1984 and 1985 was 21%–80%, which is 2–10 times greater than the previous maximum of 8% following a normal wet season. Correspondingly, proportions of Tribulus seeds and Opuntia seeds in the diet declined (Grant and Grant 1993). In this altered environment small birds with small beaks had a strong selective advantage over the rest (table 4.2; Gibbs and Grant 1987b, Grant and Grant 1995a).

Fig. 4.14 Contrasting selection differentials for G. fortis in two droughts before (1976–77) and after (1984–86) the El Niño event of 1982–83 that transformed the vegetation on the island. Abbreviations: WT weight; WG wing length; TS tarsus length; BL beak length; BD beak depth; BW beak width. Modified from Gibbs and Grant 1987b.
Two differences from selection in the preceding years stand out. First, ignoring statistical significance, all selection differentials (s) were negative in 1984–85, whereas they were all positive in 1976–77 (fig. 4.14). The only (significant) target of selection in 1984–85 was beak length (table 4.2), which was selected in the opposite direction (increase) to all other traits (decrease). The indirect effects of the other traits, even though individually none were significant, apparently outweighed the direct effect on beak length because beaks became more pointed as a result of a reduction in average beak depth and beak width without a net change in beak length. Second, males experienced stronger selection than females. For example, selection differentials for overall body size (PC1) were almost twice as large for males (–0.41, p < 0.001) as for females (–0.22, p < 0.05). Despite that, males and females survived equally well, unlike in 1977 (Boag and Grant 1981, Gibbs and Grant 1987b).
Thus small individuals with relatively pointed beaks survived the stressful period of 1984–85 best (Gibbs and Grant 1987b, Grant and Grant 1993). Large birds may have been at a disadvantage because (a) they have a higher resting metabolic rate (e.g., Nilsson et al. 2009), (b) they suffer from relatively high water loss associated with higher metabolic rates (MacMillen 1990, Williams 1996, Williams and Tieleman 2005; but see Greenberg et al. 2012), (c) associated with their greater daily energy needs they may have had difficulty in finding enough large seeds, and (d) they may not be as skillful as small birds in acquiring small seeds. As in previous years, birds feeding on large seeds in 1984 and 1985 (n = 108–124 birds) were larger in beak dimensions, especially depth and width, than those feeding on small soft seeds (Gibbs and Grant 1987b). Birds with relatively pointed beaks may have gained an advantage in being able to pick up small seeds with their forceps-like beaks, and to process them rapidly and in sufficient numbers to maintain a positive energy balance.
Evolutionary Response
All evolutionary responses to the 1984–86 selection were significant except for tarsus and beak length. They agreed in direction with the signs of the β coefficients, in that offspring were smaller on average than the adults before selection in all traits except for beak length. With heritabilities of less than 1.0 they should have been more similar to the population average before selection and hence larger than their parents, but in fact they were even smaller than their parents, except in beak length. Differences from predicted means in three traits were statistically significant: weight, wing length, and beak depth (Grant and Grant 1995a). The net result was that observed decreases (mean standard deviation shift = 0.24) were twice as large as those predicted (mean = 0.12 s.d.). Why?
We considered several possible biases in the analysis that might have led to the unexpectedly small size—incorrect estimation of heritabilities and selection coefficients, incorrect identification of fathers (chapter 3), missing variables, selection against large offspring in 1987 before they were measured—and found evidence for only one, a distortion due to sustained effects of poor nutrition during growth (Grant and Grant 1995a). Offspring that hatched in the second half of the breeding season and survived to be measured were significantly smaller than the early ones in weight, wing length, beak depth, and, almost significantly, beak width. This is understandable because breeding density was high (100 pairs), unlike in 1978 (~50 pairs), and food supply declined seasonally. Exclusion of the late offspring resulted in a much better fit to predicted values, and now only wing length was significantly smaller than predicted, probably through abrasion during extensive feeding on the ground in the ensuing drought when most of the birds were measured. Consistent with this explanation, late offspring measured by one of us (PRG) in 1988 and again in 1989 generally increased in wing length as a result of molting (15 of 22), whereas early ones did not (6 of 16). The difference is close to statistical significance (χ12 = 3.527, p = 0.06).
These analyses illustrate the important point that selection analysis assumes the parental and offspring generations experience similar environmental conditions during growth to maturity. If they are not similar, environmental differences may cause generations to differ in average morphology, thereby giving a misleading estimate of the evolutionary response to selection.
Selection in Opposite Directions
Correlations between characters introduce uncertainty into the direction of evolution, especially when characters are selected in different directions. Directions may differ in two ways: two correlated traits are selected in opposite directions at the same time, or the same trait is selected in opposite directions at different times. A possible example of the first is the contrast between directions of selection on beak length and beak depth described above. This is rare in fortis. More often one trait is selected and another is not selected. An example of the second is the contrast between directions of selection on beak depth in 1976–77 and 1984–85.
Antagonistic selection may take the form of higher survival of small juveniles and large adults (Price and Grant 1984). Selection against large juveniles was observed in 1978 and again in 1979, but not in 1984 and 1985 (Gibbs and Grant 1987b). We do not know how often such selection takes place or its magnitude because usually we are not present on the island when fully grown juveniles can be measured and then followed in their first year. Another potential form of antagonistic selection is bidirectional selection on males and females (Price 1984b). Again it is hard to judge how common this is. Typically selection is in the same direction on both sexes, and if it is strong, it is unequal and most severe for the sex furthest from the selected joint mean. Antagonistic selection dampens the net effect of directional selection and hence the strength of evolutionary change.
Conclusions
The trajectory shown in figure 1.6 is not a straight line through time but rises and falls. In this chapter we have shown that natural selection is the agency and evolution is the outcome because the traits subject to selection are highly heritable. The environment changed, and selection occurred in different directions tracking the change. The two contrasting selection episodes illustrate the value of considering selection separately from evolution. Traits subjected to selection underwent evolutionary change, but did not do so always because correlated characters were selected as a set, and the genetic correlations affected the evolutionary consequences. Beak length was not a target of selection in 1976–77; nevertheless it evolved as a correlated response to selection on other traits. In contrast, beak length was selected in the 1984–86 episode but did not evolve, partly because the effect was nullified by selection in the opposite direction on positively correlated traits. Evolutionary change in this dimension, or lack of it, could not be understood without the correlation structure. The fact that sets of correlated traits were selected in different ways in the two episodes, and also in a parallel study of G. conirostris (Large Cactus Finch) on Isla Genovesa (Grant 1985, Grant and Grant 1989), raises the interesting possibility that genetic correlations, which can constrain evolution (Agrawal and Stinchcombe 2009, Walsh and Blows 2009), may be modified (weakened) more easily by oscillating than by unidirectional selection.
Before discussing events in the second half of the study we will first consider how differential reproduction contributes to overall fitness, in both fortis and scandens (next chapter).
Summary
Natural selection occurs most strongly when the environment changes. We began the research speculating that natural selection fluctuates in direction, with different optima in years of contrasting food supply. This was confirmed with an example in the first twelve years of the study. The strongest selection on fortis occurred under severe drought conditions in 1976–77 and 1984–85, when large fractions of the population died. In the first episode large birds, especially those with deep beaks, survived best, apparently as a result of their ability to crack open the large and hard woody fruits of Tribulus cistoides and the hard seeds of Opuntia echios that became relatively abundant after finches had depleted much of the supply of small and soft seeds. Evolutionary responses of morphological traits were well predicted from estimates of selection strengths and genetic variation. The second selection episode followed an exceptionally strong and prolonged El Niño event. The abundant rain altered the composition of the food supply, which became dominated by an abundance of small and soft seeds. A drought occurred in 1984–85, and under the changed conditions of the food environment small birds with pointed beaks had a selective advantage over the rest. Evolutionary responses to selection were not predicted as well as in the first episode, apparently because offspring suffered effects of poor nutrition during growth as the breeding season progressed. Thus selection oscillates in direction in different droughts depending on the preceding conditions during the growing season. The net effect of selection is influenced by antagonistic selection on the same trait in opposite directions at different times and on different, correlated traits in opposite directions at the same time. In later chapters (8 and 12) we will extend the discussion of selection to other species and later years.


 = GP-1S, where G and P are genetic and phenotypic variance-covariance matrices, S is a vector of selection differentials, and Δ


