Chapter 1
Interacting with Customer Data
IN THIS CHAPTER
 Looking at big data problems
 Recognizing why data is crucial to digital marketing
 Discovering different types of data
Are you drowning in data but don’t have enough useful information? Most companies today are encountering big data problems. (Big data is the term used to describe all the analytical information collected from digital content.) A book on digital marketing would not be complete without a discussion of data. But before you look at specific content measurements, you need to understand the impact technology has had on data and the opportunities and problems it presents. In today’s marketplace, data plays a key role in every part of your online business and is critical to your success.
The good news is that both small and large companies can collect the data they need to make smart decisions. The bad news is that so much data gets collected that making sense of it can be hard. In this chapter, you look at the types of data that are available to you to gather, and the problems you may run into when trying to harness their value.
Understanding Big Data
To expand on the brief definition of big data from the introduction, it’s really a massive digital collection of structured and unstructured data. (Both types are defined a little later in this chapter.)
Thanks to technology, reams of customer data available from customer relationship management systems (CRMs), and even more is being collected on social media platforms and generated by users in the form of ratings and reviews.
Big data is a valuable commodity for marketing. It lets you see data patterns that you may have missed and allows you to make predictions about the content your customers want. But you need to ask yourself a question before you launch a big data effort. That is, what are the business goals for the data you are collecting? Your content needs to tie in to your overall business goals — and your big data effort needs to tie in as well. You want to be sure that the questions you want your data to answer are crucial to the success of the business itself.
Looking at different kinds of big data
Marketers have always been able to extract some form of data for marketing efforts. You could get such things as a customer list with locations or a list of purchases by amount. So why is data collection an issue now?
The answer is that there is more data now than ever before. Smartphones, social networks, websites, and factories with data sensors on machinery, and more all have data. All of it must be useful — but how to harness its value?
To understand some of the basic concepts that underlie big data, you can start by looking at the kind of data you can extract. Table 1-1 shows the model that IBM follows.
TABLE 1-1 Types of Data
|
Data Types |
Description |
Examples |
|
Descriptive |
“Who” data |
Geo-demographics, attributes, characteristics |
|
Behavioral |
“What” data |
Transactions, payments history, and orders |
|
Interaction |
“How” data |
Emails, web clicks, chat transcripts |
|
Attitudinal |
“Why” data |
Market research, social media |
You can look further at how to understand the who, what, how, and why designations by looking at descriptive data, behavioral data interaction data, and attitudinal data as follows:
- Descriptive data: This is your “who” data. You analyze it to find out who your customers are.
- Behavioral data: This is your “what” data. You analyze it to find out what interactions your customer has had with your company.
- Interaction data: This is your “how” data. You analyze it to find out how your customers interact with your company. It helps you understand their reasoning for interacting with your brand.
- Attitudinal data: This is your “why” data. It tells you why your customers are interested in your brand.
Looking at problems with big data
Aside from the types of messages that can be extracted from big data, you also need to recognize that you are dealing with two different categories of data — structured and unstructured. Structured data has been around a long time, but unstructured data has become available with the advent of social media. Here’s how they differ from one another:
- Structured data: In previous years, all the data that companies collected was structured. The data fit into neat categories and could be presented on a spreadsheet. For example, think about a list of customer deliveries. Each cell in the database had predictable information — location, date of delivery, and so on. Computers were programmed to collect this data, and everything was very straightforward. When data scientists received this data, they knew what to expect and how it would be analyzed. This is still true.
- Unstructured data: With the advent of social networks and user-generated content, you now have a mountain of data that isn’t structured. You have reviews, comments, and ratings. You also have a variety of formats — photos, live streaming data, and video. This data is more complex and requires different ways of analyzing and extracting meaning from it.
In addition to the structure, businesses have other problems to confront. Marketers have dubbed these problems “the Four Vs” of big data.
The problems are related to the following:
- Volume: Information scientists believe that 90 percent of the world’s data has been created in the last few years. Dealing with all of it in an effective way has been difficult for both large and small companies.
- Variety: Smartphones, tablets, computers, networks, and even watches generate data. Some is structured and some is not. None of it fits into a neat little package that can be easily analyzed.
- Velocity: Data is coming at an incredible rate. Not only are there vast amounts of it, but the problems are compounded by how fast new data is created.
- Veracity: Can the data be trusted? Do managers want to stake their reputations on the fact that all the data that is flowing in is accurate? Common sense suggests that not everything collected can be used to predict customer behavior. How do you separate the wheat from the chaff?
Uncovering the Role Big Data Plays in Content Marketing
When you think about your content, you probably focus on what topic to write about and where you will distribute it. Those are important questions. The way you answer those questions, and many others, is by analyzing your data. When content marketing was in its infancy, many companies flew by the seat of their pants. They believed that they instinctively knew what kind of information their customers wanted.
They proceeded to send steady streams of content, only to find that much of it was greeted without enthusiasm. That’s when managers decided that big data really did matter. Now they know that they need to use data to tell them how to beat the competition and get customers’ attention. There’s no time to waste sending content that doesn’t hit its mark.
Improving your content marketing
So, as a marketer, you want to know how using big data will improve your content marketing efforts. You should be happy to know that it enhances your effort in several ways. It helps you:
- Be more effective against your competition. By analyzing a variety of data, you can understand your competitors in ways that you couldn’t before. This understanding helps you create content with quality that surpasses that of your competition.
- Find new ways to compete. New data may allow you to find and explore new business models and niches. This exploration helps you create content that expands your customer base and creates new revenue streams.
- Zero in on your targeted audience. With more data telling you about channels, you know how and where to communicate with your customers. You can create the content that customers value and distribute it to the places they will look.
- Interact with your community. By knowing where your customers congregate, you can create a community of like-minded people who will help guide your content marketing efforts by providing feedback.
- Analyze your wins and losses. By quickly showing you what tactics are succeeding and failing, you can make revisions to content that improve website traffic and customer satisfaction.
Using real-time content
Obviously, the desire by marketers to provide customers with exciting real-time content is strong. It’s a way to capture attention and customers have come to expect it. The key to using this content effectively is to keep your customers at the center of all your efforts.
Customers have grown used to having their smartphones and other devices with them so that they can communicate as needed. Companies should expand their content messages as much as possible to take advantage of real-time content. (See Book 3 for more information about content types.)
Here are some other ideas that can expand your real-time reach:
- Use Facebook Live (
https://live.fb.com/). Facebook Live makes it very easy to set up live streaming. You can interact with your customers and learn exactly what they care about. (See more about Facebook in Book 7.) - Stream YouTube Live (
https://www.youtube.com/live). You can set reminders to catch YouTube sports, music, and games. (See more about YouTube in Book 8, Chapter 1.) - Create Instastories (
https://help.instagram.com/899271546851408). Instastories have become very popular and are featured at the top of your Instagram feed. They are photos or videos that tell a quick story or show users something you’re doing. They disappear from the site after 24 hours. (See more about Instagram in Book 7, Chapter 5.) - Conduct Twitter chats. Don’t only rely on tweets. Twitter chats are available in real time to all interested parties. You may be able to interest new users in your company by appealing to them from this channel. In addition, the transcript (content) will be available to them after the live chat. (See more about Twitter in Book 8, Chapter 1).
- Host Google Hangouts: Developing a webinar (an online seminar) for Google Hangouts is a quick and easy way to target customers on Google, the web’s most popular search platform. It also lets you create content that can be viewed later.
-
Newsjack: Newsjacking is defined as the art of using news stories and celebrities to create timely content for your customers. You’ve probably seen content with titles like “What [insert rock star name] can teach you about [insert concept].” The trick with this content is to actually make the information valuable, as opposed to just using a celebrity name to get attention.
 Some marketers argue that getting attention is what newsjacking is about, but your audience will tire of it if you keep providing content attached to famous names and events that’s just not useful.
Discovering the Internet of Things
Are you curious about the Internet of Things (IoT) and how it relates to data? You’re going to hear more about the IoT as time goes on. The IoT is a network of items that communicate their data to people and things without the need for human interaction. Included are such things as sensors in machines, appliances, and electronics.
Reviewing IoT market size
Technology writer Walt Mossberg of Recode, shown in Figure 1-1, describes the IoT as “a whole constellation of inanimate objects [that] is being designed with built-in wireless connectivity so that they can be monitored, controlled, and linked over the Internet via a mobile app.” Mossberg says that users can install these objects in the home “without changing wiring or hiring a professional” (http://recode.net/2014/01/28/smartthings-automates-your-house-via-sensors-app/).

FIGURE 1-1: Recode.
What are examples of how the IoT benefits both business and consumers?
- Business: In the enterprise space, your factory floor can have machines that tell your managers when they need maintenance or need to have parts replaced.
- Consumer: As a consumer, you can be alerted when someone comes to your front door or when your appliance is out of warranty.
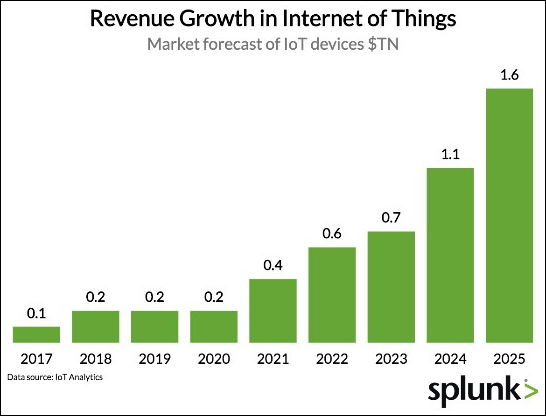
So how big a market will the IoT be? Annual revenue from IoT sales is forecast to hit $1.6 trillion by 2025 (from just $200 billion in 2018) as shown in Figure 1-2. (https://priceonomics.com/the-iot-data-explosion-how-big-is-the-iot-data/) Does that get your attention?

FIGURE 1-2: IoT sales projections from Priceonomics.
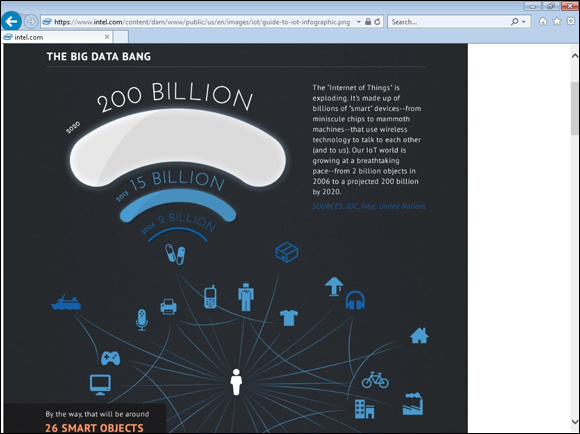
In addition, Intel projects that in 2020, the IoT will have two billion objects (see Intel’s infographic, shown in Figure 1-3 and found at http://www.intel.com/content/www/us/en/internet-of-things/infographics/guide-to-iot.html).

FIGURE 1-3: The Intel infographic on IoT.
Clearly, you should not ignore this trend. What you need to know is how it will impact your customers.
Impacting content marketing
To help you understand how the IoT will affect your customer’s experience, here’s an example to consider. Your customer can receive your content in a myriad of places. She is no longer confined to gadgets such as her laptop and iPhone. For example, her refrigerator can alert her to problems with food temperature. This capability affects your touchpoints (points of contact between the customer and the company) and the customer journey, and requires you to develop new messages for customer consumption based on the device customers are coming from.
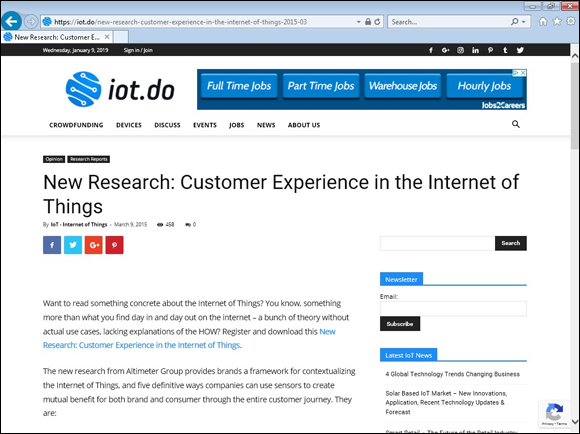
Following are some specific ways in which the IoT impacts content marketing and the customer experience. In March of 2015, Altimeter produced an excellent report called “Customer Experience in the Internet of Things: Five Ways Brands Can Use Sensors to Build Better Customer Relationships” by Jessica Groopman (https://iot.do/new-research-customer-experience-in-the-internet-of-things-2015-03; see Figure 1-4). This report discusses a variety of ways the customer can be affected by the IoT, including providing support and rewards. Four in particular have a direct impact on content marketing.

FIGURE 1-4: Altimeter’s Customer Experience Report.
Following are ways to provide consumers with information and affect their decision-making:
- Environment and proximity data: You can send consumers your product messages based on factors like location, weather, and product interaction. Retailers, for example, can send targeted messages about what to wear or eat to beat the heat.
- Location-based information: Another way to use location data is to determine the customer’s proximity to the product itself. Companies can guide shoppers to find nearby products and to choose the specific product when they are in the retail store itself.
- Monitoring data: The product can monitor and send a variety of data from the device itself. An example is a health device that reports current heart rate to the user.
- Breaking news: Companies can alert users to important announcements and emergencies right from their devices in real time. Such alerts provide a public service as well as benefits to the user.
Visualizing Big Data
One of the ways in which companies are coping with the influx of big data is to create visual displays that help them make sense of the data. For example, you’ve probably seen infographics that attempt to simplify the data. You can also use tools to create dashboards, mock-ups, and simulations.
So how do you decide whether your data would lend itself to one of these visualization types? One way is to ask yourself the purpose of your visualization. Jim Stikeleather writing for the Harvard Business Review, laid out three reasons to visualize data.
Stikeleather recommends data visualization for
- Confirmation: If your purpose is to confirm your assumptions, you want to display visuals (possibly on a dashboard) that help you determine whether you are correct. Visualization also helps you to look at how your present model works and whether you need to make changes.
- Education: If your goal is to educate, you can take one of two routes: simply report on your findings, or gather new insights about what you are seeing.
- Exploration: If your purpose is to explore new relationships and processes, you should create visuals to predict and manage the data.
Use this list as a guideline when you are deciding whether visualization will enhance your data. After you understand your purpose for creating visuals, you can help others understand your findings.
 The focus of this book is the idea of creating content that speaks to specific personas on the buyer journey. Don’t get sidetracked by providing real-time content that doesn’t speak directly to your customers.