7
THE LIVES AND DEATHS
OF STARS (I)
NEIL DEGRASSE TYSON
Two astronomers working independently, Henry Norris Russell and Ejnar Hertzsprung, decided to take all the known stars and plot their luminosity versus their color (see figure 7.1). This graph is, not surprisingly, called the Hertzsprung–Russell (HR) diagram. You can quantify the colors of stars if you know their spectra. We know today, as they knew then, that color is a measure of temperature (through the Planck function). The vertical coordinate on the HR diagram shows luminosity, and the horizontal coordinate shows color or temperature, with the hottest (blue) stars on the left, and the least hot (red) stars on the right.
Henry Norris Russell was chair of the Princeton astrophysics department. By many accounts, he was the first American astrophysicist. Because his early diagram showed temperature increasing toward the left, we follow that tradition today. He had data on thousands and thousands of stars, obtained mostly by women at the Harvard College Observatory, doing what most men considered to be menial work, classifying spectra of all these stars. That was back when the humans who did calculations were called “computers.” People were computers. There was one large room—filled with these women. Back then, around the turn of the twentieth century, women weren’t professors and had no access to any of the jobs that men coveted. But this room of computers included some smart, motivated women who, in the analyses of these spectra, deduced important features of the universe—features that you will learn about in subsequent chapters. Henrietta Leavitt was among them. Cecilia Payne also worked on spectra at Harvard for a decade as Harlow Shapley’s assistant before eventually being appointed a professor. She was also the one who discovered that the Sun is made mostly of hydrogen. Astronomy, because of that peculiar history, has a fascinating legacy of early contributions by women.
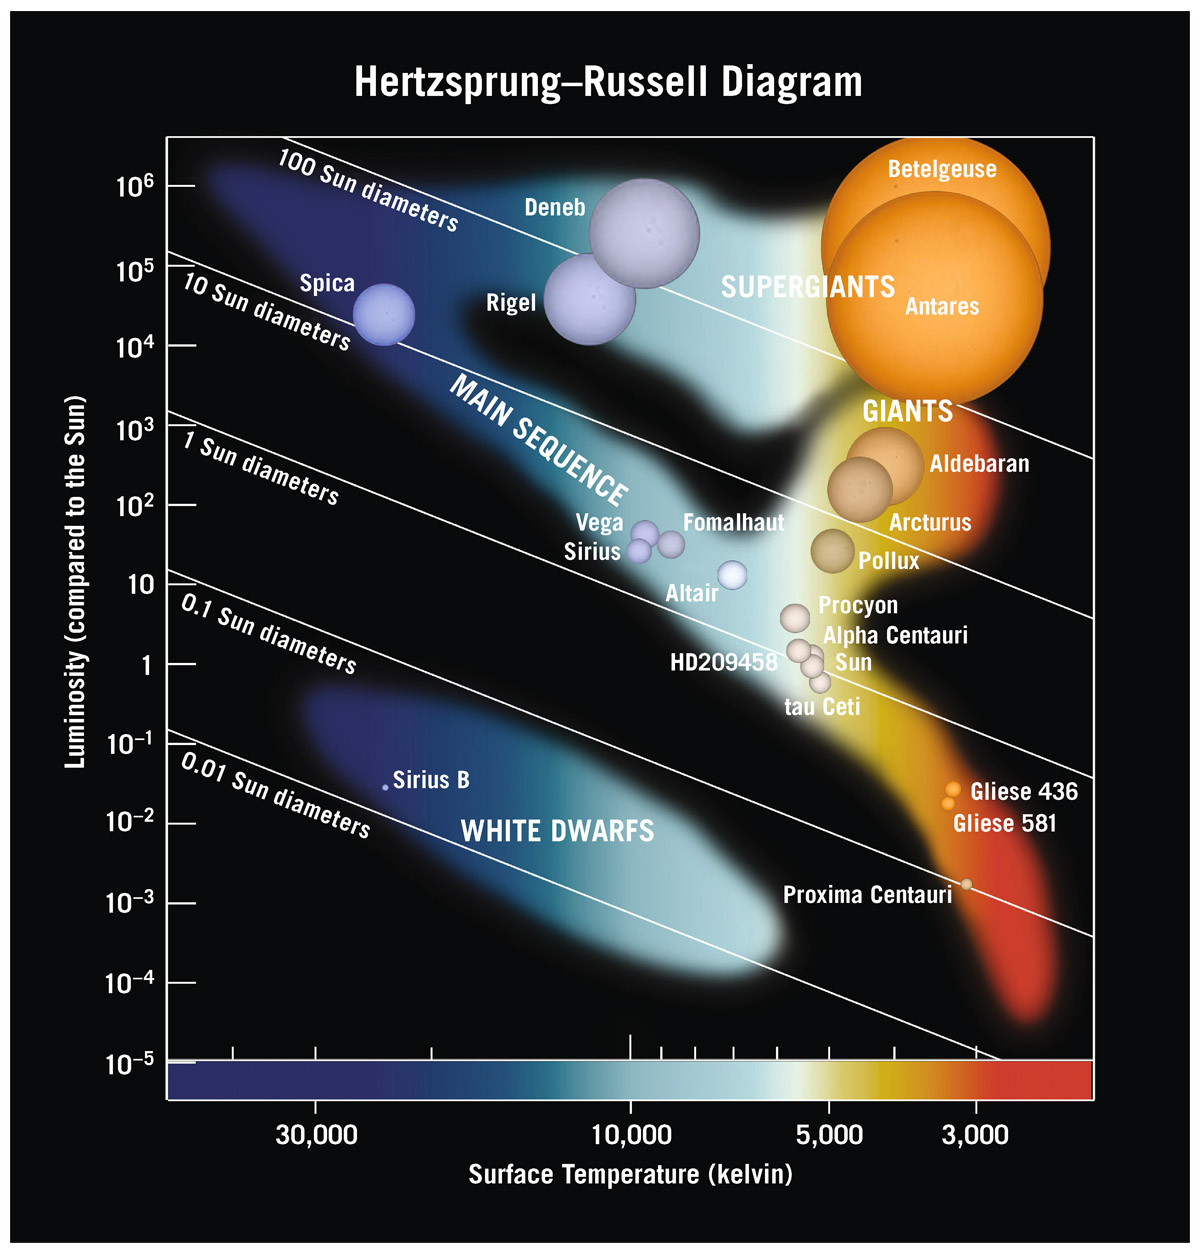
FIGURE 7.1. Hertzsprung–Russell diagram for stars. Luminosities of stars are plotted against their surface temperatures. Note that by convention, surface temperature decreases to the right. Stars with cooler surface temperatures are red, while the hotter ones are blue, as indicated here. The shading indicates where stars are commonly found. Stars lying along a particular labeled diagonal line all have the same radii.
Credit: Adapted from J. Richard Gott, Robert J. Vanderbei (Sizing Up the Universe, National Geographic, 2011)
From catalogs of stellar luminosities and temperatures, Hertzsprung and Russell started filling in the diagram. They discovered that stars did not occupy just any place in this diagram. Some regions had no stars—the blank places in this diagram—but diagonally, right down the middle, a prominent sequence of stars emerged. They called it the main sequence, as is the way of my field, giving something the simplest possible name.
Ninety percent of the cataloged stars land in that zone. There’s a smattering in the upper right corner. These stars have relatively low temperature, yet they are highly luminous. If they have low temperature, what color might they be? Red. How do you have a low-temperature red thing that has extremely high luminosity? What must be true about it? It must be huge. Indeed, these stars are big red things. We call them red giants. Armed with our knowledge of the Planck function, we know that they must be red and they must be big. I live for power of deduction like that. Even higher on the upper right are the red supergiants. We can now walk into a new astronomical arena and analyze the whole situation armed just with the physics you now carry on your utility belt. In fact, using the Stefan–Boltzmann law and the radius r of the star, giving (L = 4πr2σT4), we can draw diagonal lines of constant size on the diagram: 0.01 Sun diameters, 0.1 Sun diameters, 1 Sun diameter, 10 Sun diameters, and 100 Sun diameters. Now we know how big these stars are. The Sun lies on the 1-Sun-diameter line, of course. Red supergiants are larger than 100 Sun diameters. Below the main sequence we find another group of stars. These are hot but not too hot; that makes them white. They are extremely low in luminosity, so they must be small. We call them white dwarfs. Some people in the U.K. (like J.R.R. Tolkien) might prefer to say dwarves. But in America we form the plural of dwarf as dwarfs. Astronomers are not alone in their preference. Disney’s 1937 film is Snow White and the Seven Dwarfs, not Seven Dwarves.
At the time the HR diagram was published, classifying stars into zones, we didn’t know why they grouped that way. Maybe a star is born with high luminosity and over time, it gets progressively weaker until it dies as a low-luminosity, low-temperature thing. Perhaps it slides downward along the main sequence (simultaneously cooling and losing luminosity) as it ages. A reasonable guess, but that kind of reasoning led to an estimate for the age of the Sun of about a trillion years, which was much larger than the age of Earth. For dozens of years, we proposed educated guesses to answer the question—until we figured out what was really going on. That insight began by taking a look at some different kinds of objects in the sky (figures 7.2 and 7.3).
These images show stars clustered together, officially called star clusters. Some have a few hundred stars, others have hundreds of thousands. If the number of stars is only a few hundred (like the Pleiades in figure 7.2) we call it an open cluster; if the cluster has hundreds of thousands of stars, it tends to be spherical or globe-shaped, like M13 (in figure 7.3), and we call it a globular cluster.
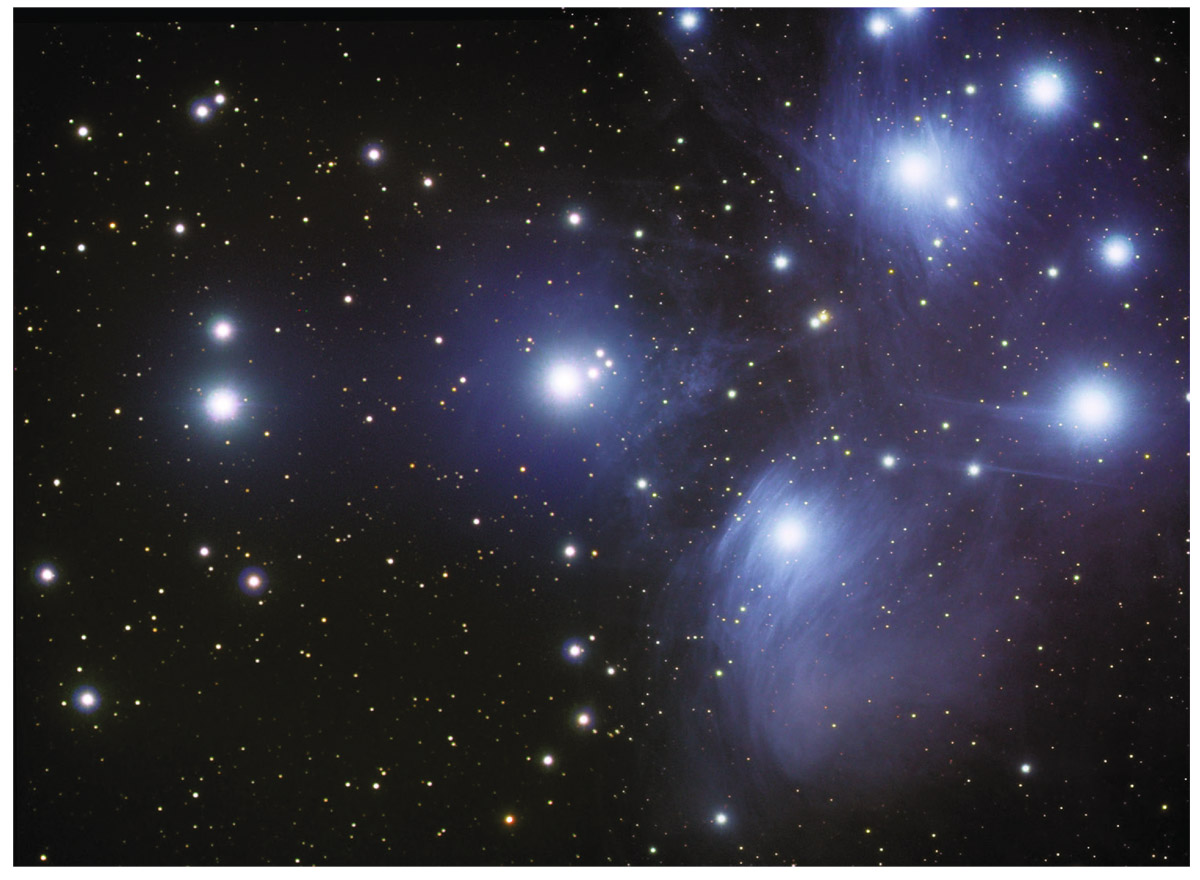
FIGURE 7.2. The Pleiades, an open star cluster. This is a young star cluster (probably less than 100 million years old).
Photo credit: Robert J. Vanderbei
Globular clusters can have hundreds of thousands of stars, but open clusters, up to a thousand. When you see one of these objects in the sky, it’s clear and obvious which kind of cluster you’re looking at. There’s no argument, because there is no middle ground: either they have a few stars or they have a whole bunch. The stars in a particular cluster have a common birthday—they formed from a gas cloud all at the same time.
The Pleiades is a young star cluster—it’s like looking at a kindergarten class. Young, bright, blue stars dominate the picture. But the HR diagram for this cluster shows a complete main sequence and no red giants. The blue stars at the top of the main sequence are so bright that they dominate, but red stars lower down on the main sequence are also in evidence. The Pleiades shows what an ensemble of stars looks like soon after they’re born. From it, we can see that some stars are born having high luminosity and high temperature while other stars are born having low luminosity and low temperature—they’re just born that way—along the entire main sequence.
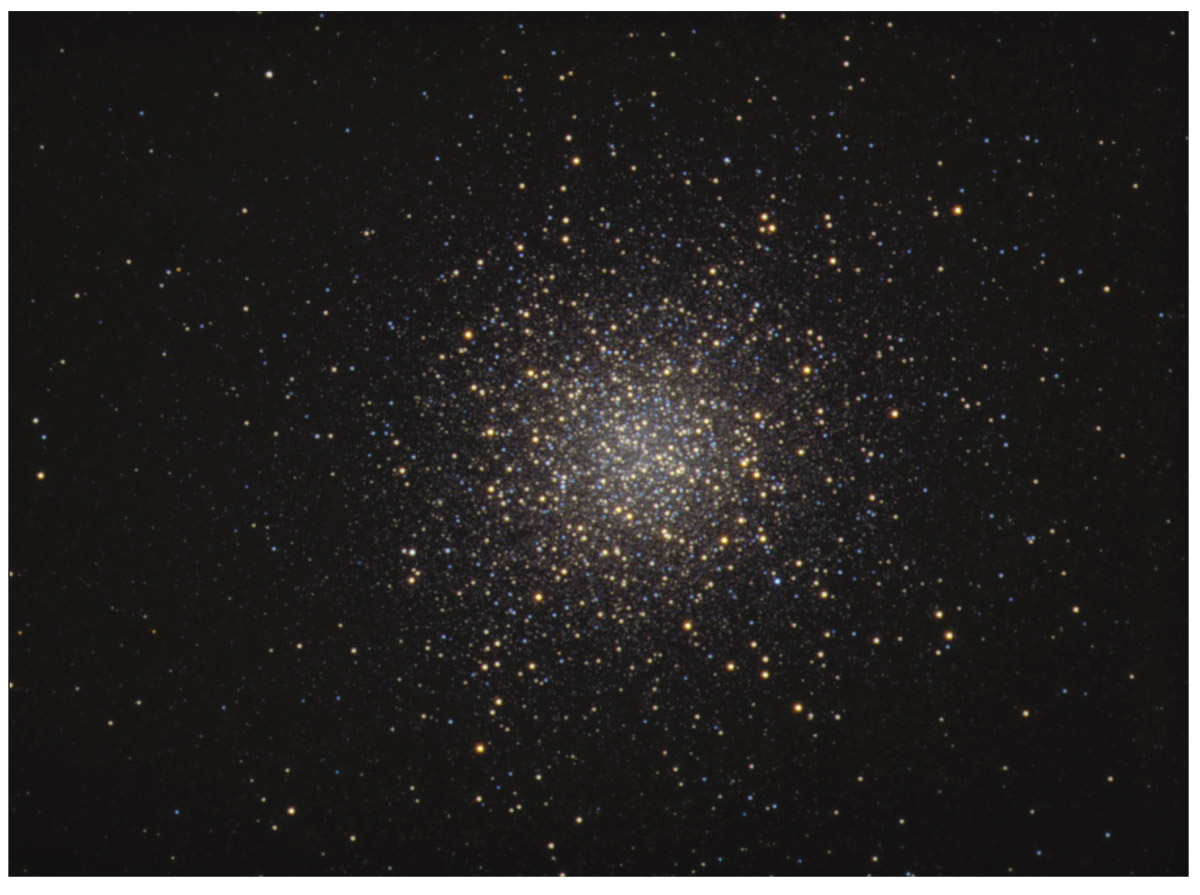
FIGURE 7.3. M13, a globular cluster.
Photo credit: Adapted from J. Richard Gott, Robert J. Vanderbei (Sizing Up the Universe, National Geographic, 2011)
Globular clusters like M13 show a main sequence minus an upper end, plus some red giants, which are not part of the main sequence. The picture of M13 is like looking at a fiftieth college reunion—all the stars are old. The red giants are the brightest and dominate the picture. M13’s main sequence still has low-luminosity, low-temperature objects, but where did the bright blue ones go? Did they exit the scene? What happened? You can probably guess where they “went”: they became red giants. The upper part of the main sequence was peeling away, with luminous blue stars becoming red giants.
We also found middle-aged cases: clusters for which just part of the upper main sequence was gone and only some red giant stars had appeared.
To figure out the masses of different types of stars, we had to be clever. We measured the Doppler shifts in the spectral lines of binary stars as they orbited each other, and applied Newton’s law of gravity. From this exercise, we discovered that the main sequence is also a mass sequence, running from massive, luminous, blue stars at the top left to low-mass, low-luminosity red stars at the bottom right. Low-mass stars are born with low luminosity and low temperature, whereas high-mass stars are born with high luminosity and high temperature.
Massive blue stars on the upper main sequence live for perhaps 10 million years. That’s actually not much time. Around the middle of the main sequence, a star like the Sun lives for 10 billion years, a thousand times longer. Following the main sequence all the way down to the bottom, the low-luminosity red stars should live for trillions of years. We see 90% of stars on the main sequence. Why? It turns out that stars spend 90% of their lifetimes with luminosity and temperature that land them on the main sequence. Think of it this way: I know, or I am pretty confident, that you brush your teeth in a bathroom every day. But if I take snapshots of you during the day at random times, I’m not likely to catch you in the act, because even though every day you spend some time brushing your teeth, you don’t spend much time doing it. We’ve come to learn that for some regions of the HR diagram that are sparsely populated, stars are actually “passing through” those regions as their luminosity and/or temperature changes, but they do so quickly, not spending much time there. It is rare to catch stars in the act of brushing their teeth.
What’s going on down in the center of stars? We agreed that as you raise the temperature, particles move faster and faster. We also agreed that 90% of the atomic nuclei in the universe are hydrogen, the same percentage found in stars. Take a blob of gas that is 90% hydrogen—it’s not a star yet. Let it collapse and form a star. As you might suspect, the center becomes the hottest part of the star. If you compress something it becomes hot. The centers of stars are hot enough (as we shall see) to create a nuclear furnace that keeps the center hot. It’s much less hot up on the surface. The centers of stars are so hot that all electrons are stripped entirely from their atoms, leaving their nuclei bare.
The hydrogen nucleus has one proton. When another proton approaches it, the two protons repel one another. Protons are positively charged, and like charges repel one another with a 1/r2 force. The closer they get, the harder they repel. But increase their temperature. Higher temperature means larger average kinetic energies, and higher velocities for the protons. Higher velocities mean that the protons can approach closer to one another before the electrostatic forces make them turn around. It turns out that there is a magic temperature—about 10 million K—at which these protons are able to get so close together that a whole new short-range, strong nuclear force takes over, attracting them and binding them together, as I mentioned in chapter 1. This attractive nuclear force, unknown a hundred years ago, must be quite strong to overcome the natural electrostatic repulsion of the protons. What else to call it other than the strong nuclear force? It’s what enables what came to be called thermonuclear fusion. (The strong nuclear force is also what holds more massive nuclei together. The helium nucleus has two protons and two neutrons. The two protons repel due to electrostatic repulsion; it is the strong nuclear force that holds them in the nucleus. Similarly with the carbon nucleus [six protons and six neutrons] and the oxygen nucleus [eight protons and eight neutrons]).
The ensuing reaction when two protons come together at 10 million K is kind of fun. You end up with a proton and a neutron stuck together—one of the protons has spontaneously turned into a neutron—and a positively charged electron, called a positron, is simultaneously ejected. That’s antimatter, exotic stuff. That positron weighs the same as an electron, but when it meets up with an electron, they annihilate, converting all their mass into the energy carried away by two photons. This follows precisely Einstein’s mass-energy equation E = mc2, about which Rich will have much more to say in chapter 18. Also ejected is an electron neutrino, a neutral (zero-charge) particle that interacts so weakly with other stuff in the universe that it promptly escapes from the Sun. Notice that charge is conserved in this reaction. We start with two positive charges (each proton has one) and end with two positive charges (one on the proton and one on the positron). The reaction creates energy, because the sum of the masses of the original particles is more than the sum of the masses of the particles at the end. Mass is lost, converted to energy via E = mc2. What is a nucleus with a proton and a neutron? It has only one proton in it, so it is still hydrogen, but now it is a heavier version of hydrogen. We often call it “heavy hydrogen,” but it also has its own name, deuterium.
Now I have some deuterium. Deuterium plus another proton gives me a ppn nucleus (two protons, one neutron) plus more energy. What have I just made? I now have two protons in my nucleus, and when you have two protons, it’s called helium. Helium derives from Helios—the Greek god of the Sun. We have an element named after the Sun. That’s because this element was discovered in the Sun, through spectral analysis, before we discovered it on Earth. This ppn nucleus is a lighter-than-normal version of helium, called helium-3 because it has three nuclear particles (two protons and one neutron). Now collide two of these helium-3 nuclei: ppn + ppn = ppnn + p + p + more energy. This resulting ppnn is full, red-blooded helium-4 (the normal helium you find in helium balloons).
All this goes on at 15 million K in the center of the Sun, which converts 4 million tons of matter into energy every second. We came to understand that stars in the main sequence are converting hydrogen into helium. Eventually, the hydrogen in the core runs out, and then, all heaven breaks loose: the star’s envelope expands, and it becomes a red giant. About 5 billion years from now, our Sun will become a red giant, throw off its gaseous envelope, and settle down to become a white dwarf. More massive stars will become red giants, and supergiants. They may explode as supernovae, with their cores collapsing to form neutron stars or black holes. We will return to this topic in chapter 8.
For now, let’s go back to the HR diagram. We have the main sequence, red giants, and white dwarfs, with temperature increasing to the left and luminosity getting higher as you go upward. Stars are given spectral classification letters. Some are relics from a pre-quantum classification scheme in which they were actually in alphabetical order, but the system is still in use: O B A F G K M L T Y. Each letter designates a class of surface temperature for stars; the Sun is a G star. Their approximate surface temperatures and colors are:
O (>33,000 K, blue),
B (10,000–33,000 K, blue-white),
A (7,500–10,000 K, white to blue-white),
F (6,000–7,500 K, white),
G (5,200–6,000 K, white),
K (3,700–5,200 K, orange), and
M (2,000–3,700 K, red),
all of which are included in figure 7.1. Off to the right, beyond our chart, would be the remaining classes: L (1,300–2,000 K, red), T (700–1,300 K, red), and Y (<700 K, red). If you look at the temperatures on the scale at the bottom of the figure, you can see where these classes go. Spica is a B star, Sirius is an A star, Procyon is an F star, and Gliese 581 is an M star. Each star has both a horizontal position on the chart that shows its temperature (hotter on the left, cooler on the right) and a vertical position that shows its luminosity (increasing from bottom to top) . The Sun has exactly one solar luminosity, of course, by definition, as can be seen by noting its luminosity on the vertical scale. This is a logarithmic scale, allowing us to plot the huge range of observed luminosities, with each tick mark going up representing a star 10 times as luminous.
Along the top edge of figure 7.1 are stars with a million times the Sun’s luminosity. At the bottom of the chart are stars with 1/100,000 of the Sun’s luminosity. The range in luminosity among the main sequence stars in the universe is staggering. We would eventually figure out that stars at the top end of the main sequence are only about 60 times the mass of the Sun, not a million times more massive. At the bottom end, they are only about a tenth the mass of the Sun, but as indicated, are much, much fainter than the Sun. So the range of masses is large but not nearly as large as the range we find in luminosities. In fact, we can give a formal relationship describing how the luminosity depends on a star’s mass on the main sequence, but it’s nonlinear: the luminosity is proportional to mass raised to the 3.5 power. Which tells us that two stars of slightly different mass will have very different luminosities.
Here is a cool calculation. Start with E = mc2. That’s one of the first equations anybody ever learns in school. You know this equation before you even know what it means. You learn it in third grade perhaps, and find out Einstein came up with it. Good old Albert, from work he did in 1905. The equation says, as we have discussed, that a certain amount of mass can be converted into energy through this relationship, in which c, the enormous speed of light, gets squared, becoming very large indeed. Nuclear bombs owe their power to what goes on in this equation. Rich will explore the origins of this equation in Einstein’s theory of Special Relativity in chapter 18.
If a star has a certain amount of mass and a certain amount of luminosity, for how long will it stay alive? Of course, you can ask the same question of your gas-driven car: you know the capacity of its gas tank when you fill it up, and you also know its gas mileage, in miles per gallon. From these facts, you can predict how far you can go before your car runs out of gas. A star’s luminosity is its energy emitted per unit time. If you multiply the lifetime ℓ of the star by its luminosity L, you will get the total energy it emits over its lifetime, ℓL. We know the luminosity of a star, the rate at which a star is consuming fuel, and we know how much hydrogen fuel it has, so what is the lifetime of a main-sequence star? That is, how long will it stay on the main sequence? The total energy you can get out of a star by fusing its hydrogen fuel is proportional to its mass M. Remember E = mc2. Total energy emitted is proportional to M and is also proportional to ℓL, so M is proportional to ℓL. That means ℓ is proportional to M/L. If L is proportional to M3.5, as I have said, then ℓ is proportional to M/M3.5, which is the same as 1/M2.5. The more massive a star is, the shorter will be its main sequence lifetime will be!
Let’s see what that means. If the lifetime of a star is proportional to 1/M2.5, then if I have a star that’s 4 times the mass of the Sun, its lifetime should be 1/42.5 times as long as the Sun’s. Now 1/42.5 is one divided by 4 squared times the square root of 4. The square root of 4 is 2, and 4 squared is 16. Thus, this 4-solar-mass star has a lifetime that is 1/32 of the lifetime of the Sun. The main-sequence lifetime of the Sun is about 10 billion years. So, this 4-solar-mass star will have a main-sequence lifetime only 1/32 of 10 billion years, or about 300 million years. That’s short.
Another example: 1/402.5 is about 1/10,000, so if you have a 40-solar-mass star, it will live only 1 million years—that’s tiny compared to a billion years. Let’s take a step in the other direction. Consider a star that has 1/10 the mass of the Sun. One over 1/10 is 10, and 10 raised to the 2.5 power is about 300. That star will live 300 times as long as the Sun. What is 300 times 10 billion? It’s 3,000 billion, or 3 trillion years, much longer than the current age of the universe—making that star very efficient in its fuel consumption. A 10-solar-mass star lives 1/300 as long as the Sun, whereas a 1/10-solar-mass star lives 300 times longer.
Hydrogen fuses to form helium inside a star on the main sequence. Stars do other stuff in their cores during their red-giant phase. More fusing occurs, producing such elements as carbon and oxygen, and others down the periodic table to iron (which has 26 protons and 30 neutrons). A star spends 90% of its life on the main sequence, before it starts cranking out these additional elements as a red giant. That last phase happens fast, occupying a mere 10% of a star’s life. Every time you bring together light elements (lighter than iron, number 26 on the periodic table) to make a heavier one, all these reactions lose mass, and the fusion reaction progresses via E = mc2 and emits energy. This fusion process is called exothermic, because it gives off energy. But we know other nuclear processes that give off energy as well. Take uranium (number 92), split its nucleus into smaller ones, and that will be exothermic too. This was done in World War II—the Hiroshima bomb was a uranium bomb; the Nagasaki bomb used plutonium (number 94). Each of these elements has a huge nucleus, and has isotopes (versions having the same number of protons but different numbers of neutrons) that are unstable. If you split them into parts, creating lighter elements, energy is released. This is also exothermic and is called fission. Most of the world’s nuclear arsenal going into the Cold War consisted of fission bombs, whereas today, most of the power of our nuclear arsenal resides in bombs that fuse hydrogen into helium. Just to put their relative destructive energy in perspective, fusion bombs use fission bombs as their trigger, giving a sense of how devastating these fusion-based weapons really are. We know how efficiently they convert matter into energy, and that’s exactly what stars do. The Sun is one big thermonuclear fusion bomb, except its awesome energy is contained by all that mass pressing down on the core. We have not yet been able to make a contained nuclear fusion power plant. All nuclear power plants in America, France, and other countries are contained fission power plants.
You just can’t just split atoms and keep getting energy forever; you can’t fuse atoms and get energy forever either. Figure 7.4 explains why. The horizontal axis shows the atomic number, the number of nucleons (i.e., protons or neutrons) that each naturally occurring element contains, and it starts at 1, hydrogen. Hydrogen’s nucleus has one proton. The chart goes all the way out to 238, uranium; its nucleus has 92 protons and 146 neutrons. Some elements, like uranium, have different isotopes; uranium-235, which has 92 protons and only 143 neutrons, is radioactive and highly fissionable (it was the isotope used in the atomic bomb dropped on Hiroshima). All the other elements lie between hydrogen and uranium on the chart. Plotted vertically is the binding energy—binding energy per nucleon. The larger the binding energy is, the lower on the chart the element is placed.
To appreciate binding energy, imagine taking two magnets stuck together with the north pole of one matched up with the south pole of the other. In this configuration, you will need to invest energy if you want to pull the magnets apart. Binding energy is what keeps the two magnets together. Figure 7.4 shows hydrogen at the top of the chart—zero binding energy. Hydrogen fusing into helium falls down the hill, releasing energy. Helium has a larger binding energy relative to hydrogen—it’s like being down in a valley relative to hydrogen. Note the scale: these binding energies are large, (measured in millions of electron volts per nucleon). Recall that we introduced the electron volt (eV) in chapter 6. You have to add energy to helium (over 7 million electron volts times 4 nucleons, or more than 28 million electron volts) to break it apart into hydrogen. This curve dips in the middle to its lowest point. Uranium at the right-hand edge of the diagram is higher than this lowest point in the middle. If you are an element, you can undergo fission exothermically, or fusion exothermically, until you land all the way down at the bottom. Iron, with its 26 protons and 30 neutrons (i.e., 56 nucleons), occupies that bottom spot. If I try to fuse iron, it goes endothermic and absorbs energy. If I try to fission iron, it’s endothermic again. The buck stops on iron: there is no more energy to be released when you get to iron.
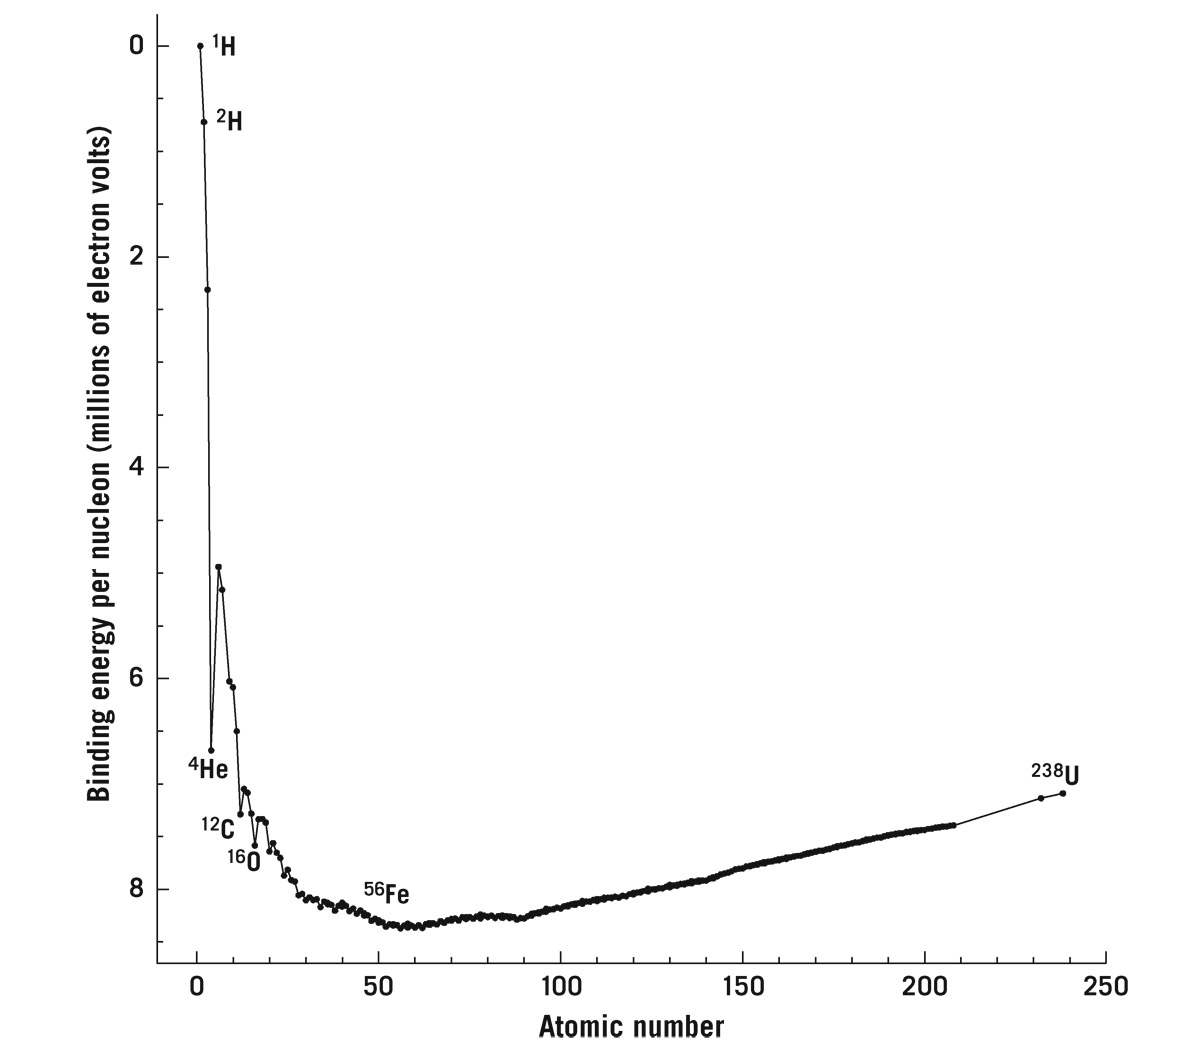
FIGURE 7.4. Binding energy per nucleon of atomic nuclei. Only stable isotopes for each element are shown. Binding energy is shown in millions of electron volts per nucleon (i.e., proton or neutron). This represents the energy per nucleon that would be released in creating this nucleus from free protons. The greater the binding energy per nucleon (lower in the diagram), the less mass there will be per nucleon in the nucleus (according to Einstein’s relation E = mc2). Credit: Michael A. Strauss, using data from: http://www.nndc.bnl.gov/amdc/nubase/nubtab03.asc; G. Audia, O. Bersillon, J. Blachot, and A. H. Wapstra, Nuclear Physics A 729 (2003): 3–128
Stars are in the business of making energy. If a star is cranking along, fusing its elements down the line, and if it’s getting energy for doing so, you have a happy star. The energy being generated keeps the center of the star hot, and the thermal pressure of that hot gas keeps gravity from collapsing the star under its own weight. Let’s say I have a main sequence star ten times as massive as the Sun: it’s mostly hydrogen and helium, and in its core it is still converting hydrogen to helium; that’s Scene 1. By Scene 2, the core is now pure helium, but it still has hydrogen and helium in the surrounding envelope. Fusion stops in the center, and the center can’t hold the star up anymore, so what does the star do? The star’s core collapses, the pressure builds, and the temperature increases, becoming hot enough to fuse helium. It takes a higher temperature to bring helium nuclei together (ppnn + ppnn) than it does to bring hydrogen nuclei together (p + p), because each helium nucleus (ppnn) has two protons—doubling the number of positive charges repelling one another. Continuing with Scene 2, helium fusion kicks in (at 100 million K), keeping the star stable. In the middle of that very hot core, helium is becoming carbon; outside the core, our envelope has hydrogen fusion in a shell. Eventually, I get a ball of carbon in the center, and the center is not hot enough to fuse carbon, so the fusion stops. The core collapses further, the temperature rises again, and carbon fusion begins. That’s Scene 3. We now have carbon fusing to make oxygen in the center of the carbon core in the center of the helium core, in the center of the star’s envelope, which still has hydrogen and helium. We’re creating an onion of elements, layer upon layer, because it’s always hottest in the middle. Each reaction releases energy. Eventually, you get iron in the middle, surrounded by successive shells of all the other lighter elements. Therein sits the future chemical enrichment of the galaxy.
But these elements are still locked inside a star, and they have to get out of the star somehow, because we’re made of these elements! We now know that since iron is the end of the road, once iron accumulates in the core, the fusion stops, and the star collapses. If it tries to fuse iron, doing so sucks energy out of the star, collapsing the star even faster. Stars are in the business of making energy, not absorbing it. As the core collapses faster and faster, the star implodes, leaving a tiny, superdense neutron star in the center, whose formation generates enough kinetic energy to blow off the entire envelope and outer core of the star and causes a titanic explosion, for several weeks shining billions of times brighter than the Sun. The guts of this star are now released into the galaxy, into what we call the interstellar medium, chemically enriching gas clouds with heavy elements, enabling gas clouds to become something more interesting than clouds of pure hydrogen and helium.
Figure 7.5 shows a beautiful spiral galaxy M51, containing a hundred billion stars, sitting there nicely (top view) until a star explodes (in the bottom view). As we’ll see in chapter 12, we live in a spiral galaxy, not unlike M51. Before the explosion (top) you can see the galaxy and some foreground stars in the Milky Way, which are much closer to us (and of course far less luminous) than the galaxy. When one of these explosions goes off, we see a new star in the galaxy (bottom), one that was not visible before and is by far the brightest thing in the galaxy. It’s a single star. If you’re a planet in orbit around that star, you’re toast. Quite simply, and quite literally. We call these things supernovae. Nova means “new” in Latin, and it meant a new star in the sky. We later learned that in a supernova, we were seeing the death throes of a star. Not all stars can do this; only relatively high-mass stars become supernovae, leaving tiny, incredibly dense neutron stars at the center when they blow off their outer parts. Even higher-mass stars exist. And they explode too. But when one of them collapses, the increase in gravity near the center warps space so severely that it closes itself off from the rest of the universe, and guess what you get: a black hole. A black hole may sometimes form at the center while the envelope of the star is being thrown off, also creating a supernova explosion.
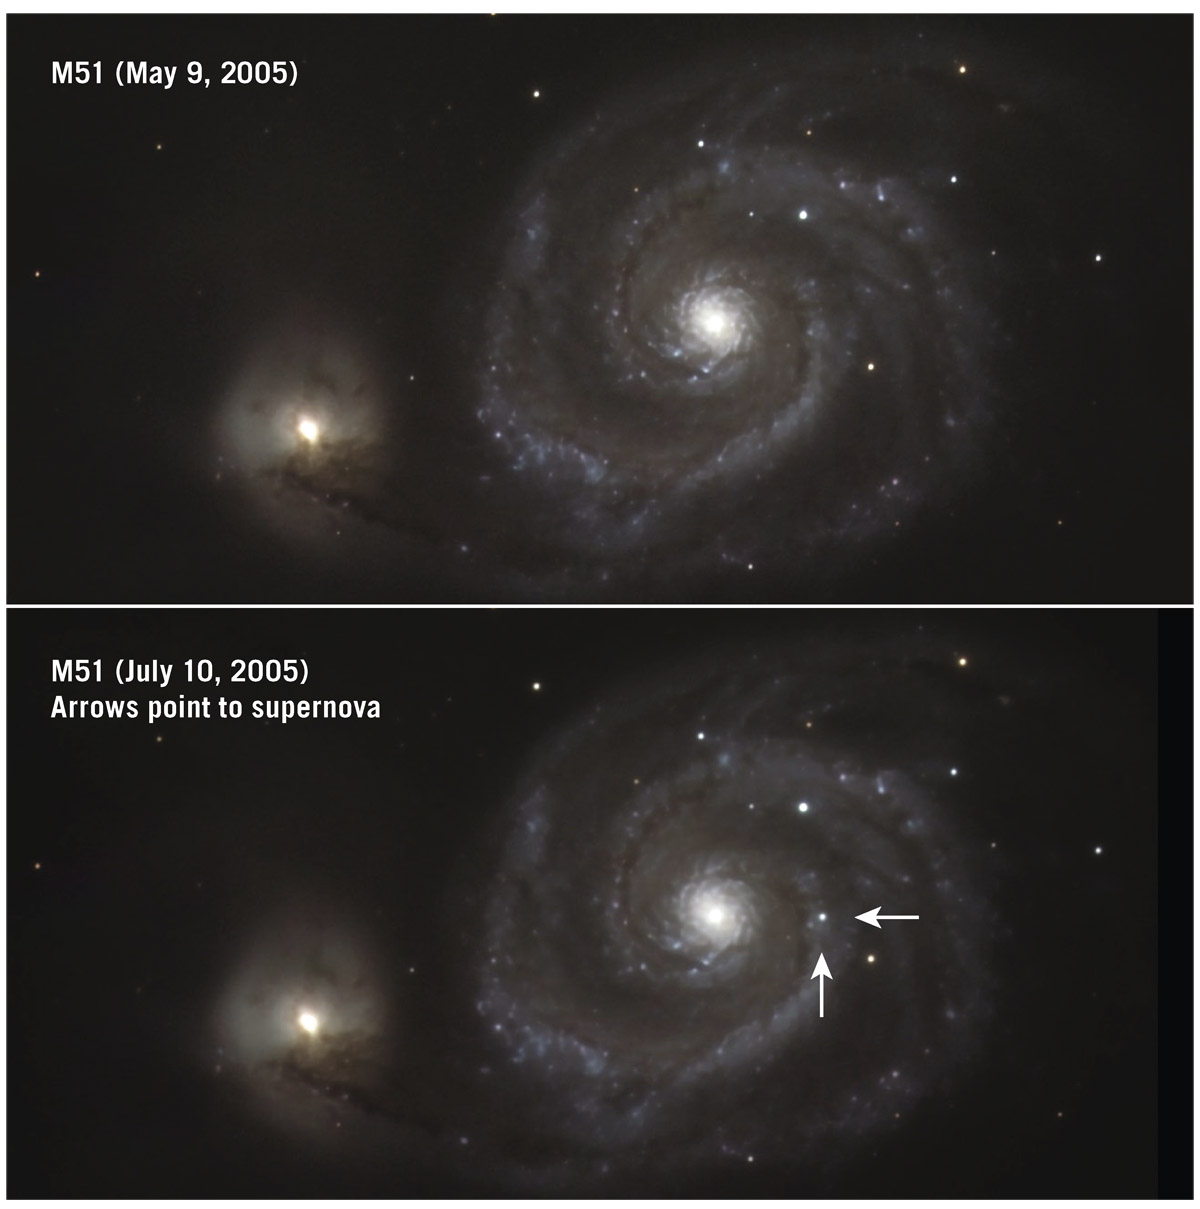
FIGURE 7.5. Spiral Galaxy M51 and supernova.
Photo credit: J. Richard Gott, Robert J. Vanderbei (Sizing Up the Universe, National Geographic, 2011)
Stephen Hawking works on black holes; he has made major discoveries about their strange behavior, and Rich will have much more to say about black holes and Hawking’s discoveries in chapter 20. The animated TV sitcom The Simpsons has given Stephen Hawking the reputation of being the smartest person alive. Most of us agree.
Now, let me tell you about star births. The Orion Nebula is a stellar nursery; a gas cloud that has already been enriched with heavier elements forged in the cores of a previous generation of dying stars.
In the center of the nebula are bright, newly born massive O and B stars. These O and B stars are radiating intensely in the ultraviolet. This hot UV radiation has photons with enough energy to ionize (strip the electrons off) the hydrogen gas near the center. The gas is trying to form stars, but it’s being thwarted by the intense luminosity from the high-mass stars in the center. Meanwhile, some of this enriched gas is ready to make something more interesting than just smaller balls of gas. It can also make balls of solid stuff that contain oxygen, silicon, iron—things like terrestrial planets. Some nascent stars are also forming planetary systems from the gas that swaddles them. These are new solar systems being born from rotating disks of material (see figure 7.6). And in the Orion Nebula it’s still happening now. Some stellar nurseries are birthing thousands upon thousands of solar systems. Our galaxy has 300 billion stars, many of them likely surrounded by planets of their own.
How important are we in this picture? We’re quite small—cosmically insignificant. A depressing revelation for some, who would prefer to feel large. The problem is history. Every time we make an argument that we’re special in the cosmos, either that we are in the center or that the whole universe revolves around us, or that we are made of special ingredients, or that we’ve been around since the beginning, we learn that the opposite is true. In fact, we occupy a humble corner of the galaxy, which occupies its own humble corner in the universe. Every astrophysicist lives with that reality.
Let me make you feel even smaller. In figure 7.7, taken by the Hubble Space Telescope, all the smudges in the picture are entire galaxies, so far away that each of them occupies only a small part of the image. Each one of these smudges harbors more than 100 billion stars unto itself. And this is just another small pocket of the universe. This Hubble Ultra-Deep Field, as it is known, is the deepest image of the universe ever acquired. It shows about 10,000 galaxies. This whole picture covers a patch of sky 1/65 of the area of the full Moon, about 1/13 millionth of the whole sky. Since this spot on the sky is not unusual, the number of galaxies we can see in the whole sky is 13 million times as many as we can see in this picture. That means 130 billion galaxies are within the reach of the Hubble Space Telescope.
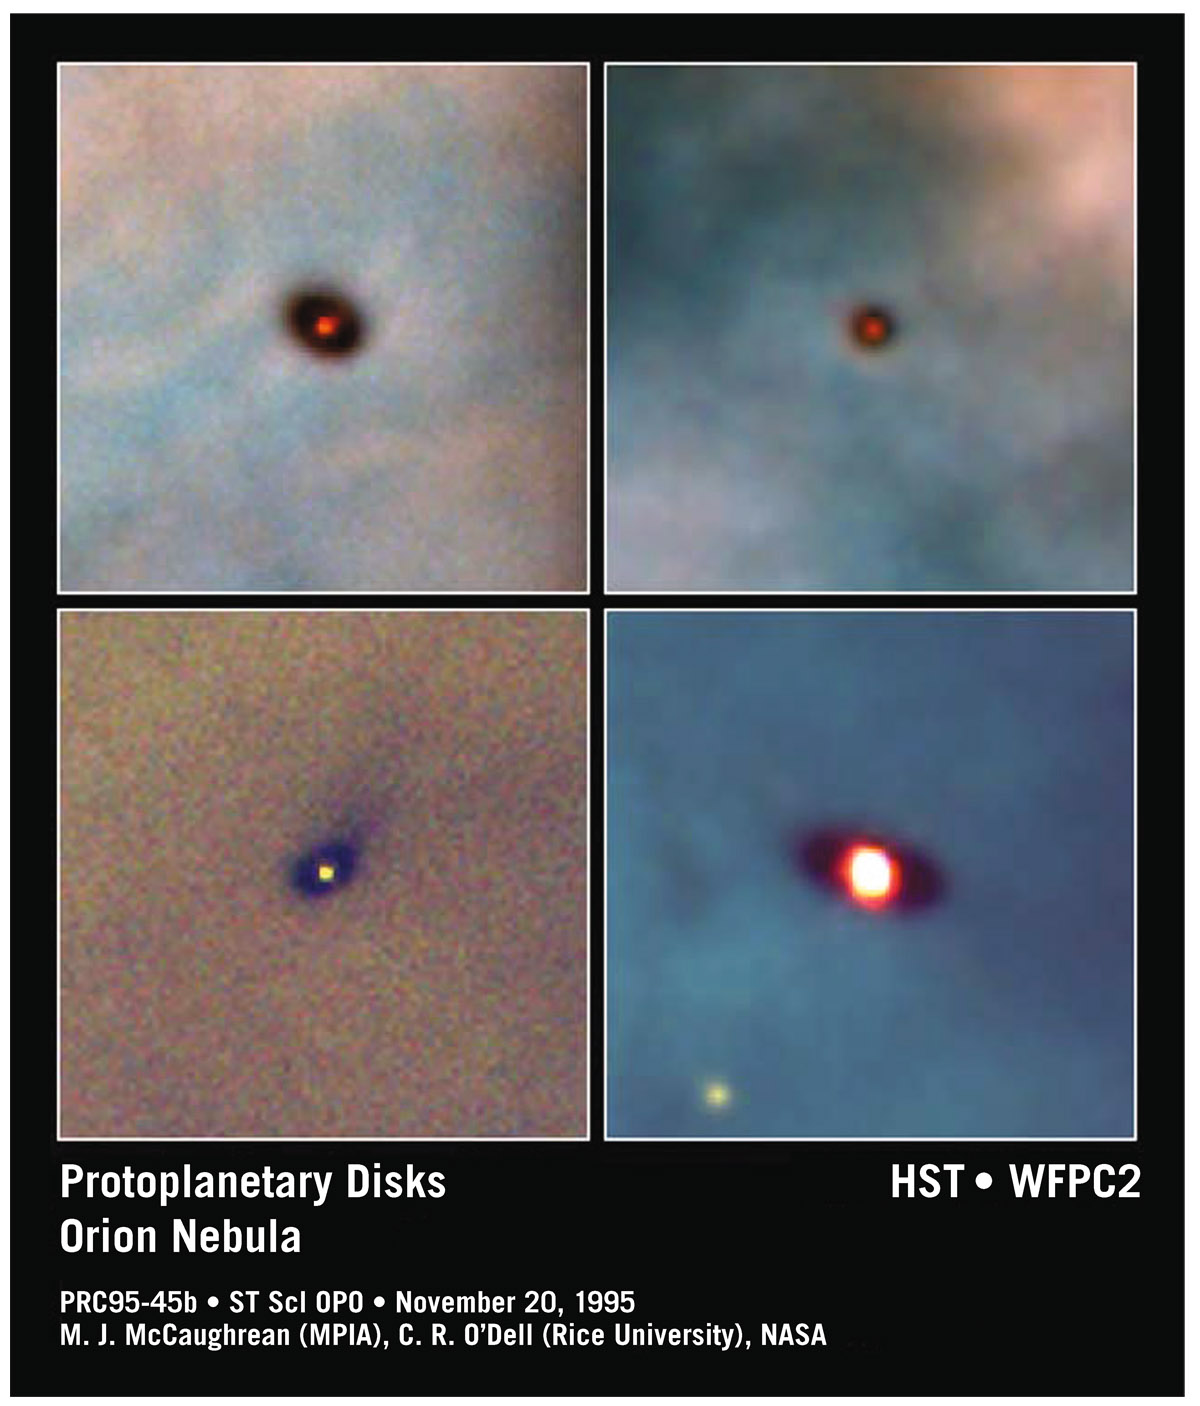
FIGURE 7.6. Protoplanetary disks around newly formed stars in the Orion Nebula taken by the Hubble Space Telescope. Photo credit: M. J. McCaughrean (MPIA), C. R. O’Dell (Rice University), NASA
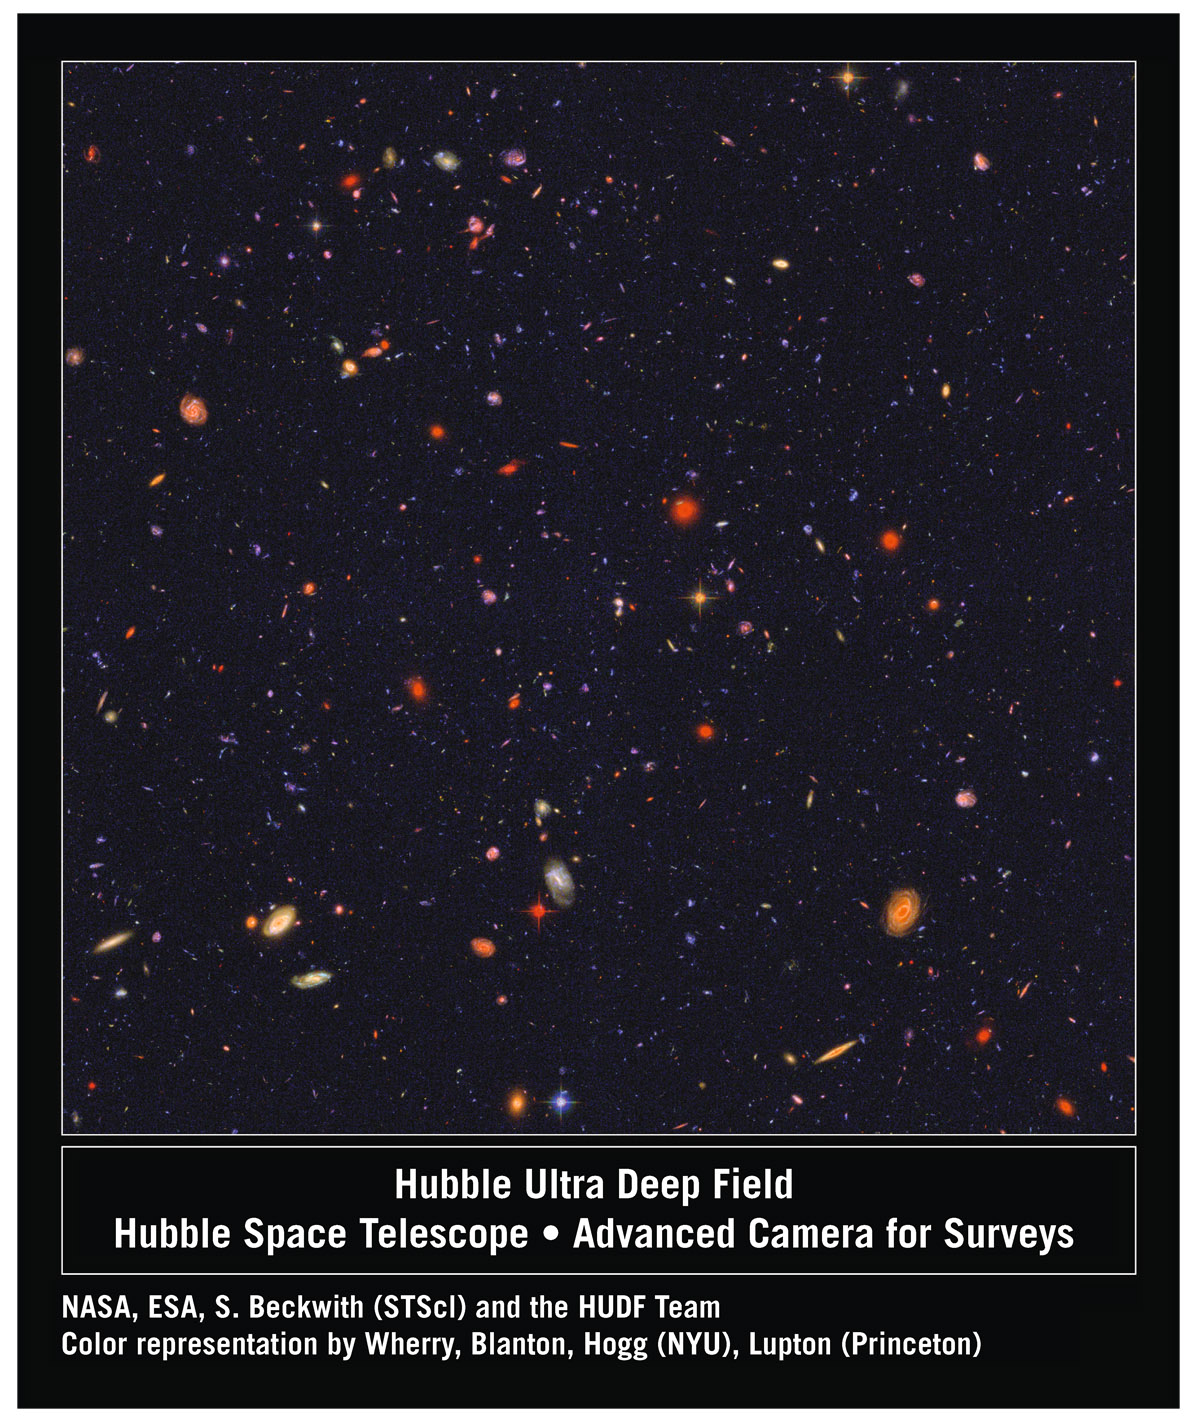
FIGURE 7.7. Hubble Ultra Deep Field. This long-exposure photograph taken by the Hubble Space Telescope shows about 10,000 galaxies. But it covers only about 1/13 millionth of the sky. Therefore, there are about 130 billion galaxies within the range of this telescope over the whole sky. Photo credit: NASA/ESA/S. Beckwith(STScI) and The HUDF Team. Color representation by Nic Wherry, David W. Hogg, Michael Blanton (New York University), Robert Lupton (Princeton)
In his book Pale Blue Dot, Carl Sagan noted that everyone we ever knew, everyone we have ever read about in history, lived on Earth, this one tiny dot in the universe—something I think about often. I think about it, because your mind says “I feel small,” your heart says “I feel small,” but now you’re empowered, and you’ll continue to be empowered as this book unfolds, not to think small, but to think big. Why? Because you’re now enlightened by the laws of physics, the machinery by which the universe operates. In effect, understanding astrophysics emboldens and empowers you to look up in the sky and say, No, I don’t feel small, I feel large, because the human brain, our three pounds of gray matter, figured this stuff out. And yet, even more mysteries await me.