Chapter 31 NURSING ASSESSMENT: cardiovascular system
1. Describe the anatomical location and function of the following cardiac structures: pericardial layers, atria, ventricles, semilunar valves and atrioventricular valves.
2. Describe the coronary circulation and the areas of heart muscle supplied by the major coronary arteries.
3. Explain the normal sequence of events involved in the conduction pathway of the heart.
4. Explore the structure and function of arteries, capillaries, veins and endothelium.
5. Define blood pressure and the mechanisms involved in its regulation.
6. Identify the waveforms and the associated cardiac events represented on a normal electrocardiogram.
7. Apply appropriate techniques used in the physical assessment of the cardiovascular system.
8. Differentiate between normal and common abnormal findings of a physical assessment of the cardiovascular system.
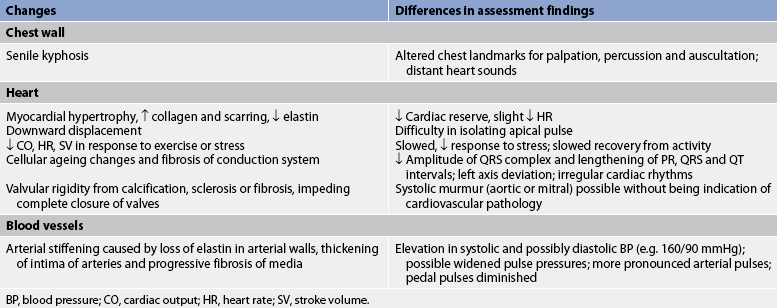
9. Analyse the effects of age-related changes of the cardiovascular system and differences in assessment findings.
10. Describe the purpose, significance of results and nursing responsibilities of diagnostic studies of the cardiovascular system.
Structures and functions of the cardiovascular system
HEART
Structure
The heart is a four-chambered hollow muscular organ normally the approximate size of a fist. It lies within the thorax in the mediastinal space between the right and left pleural cavities. Its beating is often palpable at the fifth intercostal space approximately 5 cm left of the midline (see Fig 31-1). This pulsation, arising at the apex of the heart, is termed the point of maximal impulse (PMI).
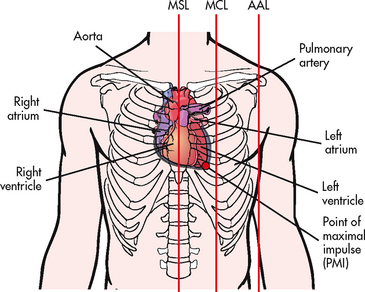
Figure 31-1 Orientation of the heart within the thorax. Red lines indicate the midsternal line (MSL), midclavicular line (MCL) and anterior axillary line (AAL).
The heart is composed of three layers: a thin inner lining, the endocardium; a layer of muscle, the myocardium; and a fibrous outer layer, the epicardium. The heart is surrounded by the pericardium. The inner (visceral) layer of the pericardium is in contact with the epicardium and the outer (parietal) layer is in contact with the mediastinum. A small amount of pericardial fluid (approximately 10–30 mL) lubricates the space between the pericardial layers (pericardial space) and prevents friction between the surfaces as the heart contracts.
The heart is divided vertically by the septum. This creates a right and left atrium and a right and left ventricle. The thickness of the walls of each chamber is different. The atrial myocardium is thinner than that of the ventricles, and the left ventricular wall is three times thicker than the right ventricular wall.1 The thickness of the left ventricle provides the force to pump the blood into the systemic circulation.
Blood flow through the heart
The right atrium receives venous blood from the inferior and superior venae cavae and the coronary sinus (see Fig 31-2). The blood then passes through the tricuspid valve into the right ventricle. With each contraction, the right ventricle pumps blood through the pulmonic valve into the pulmonary artery and to the lungs. Blood flows to the left atrium by way of the pulmonary veins. It then passes through the mitral valve and into the left ventricle. As the heart contracts, blood is ejected through the aortic valve into the aorta and thus enters the high-pressure systemic circulation.
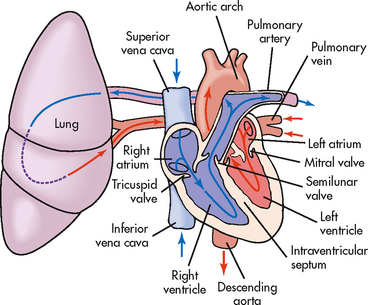
Figure 31-2 Schematic representation of blood flow through the heart. Arrows indicate the direction of flow.
Cardiac valves
The four valves of the heart serve to keep blood flowing in a forward direction. The cusps of the mitral and tricuspid valves are attached to thin strands of fibrous tissue termed chordae tendineae (see Fig 31-3). Chordae are anchored in the papillary muscles of the ventricles. This support system prevents the eversion of the leaflets into the atria during ventricular contraction. The pulmonic and aortic valves (also known as semilunar valves) prevent blood from regurgitating into the ventricles at the end of each ventricular contraction.
Blood supply to the myocardium
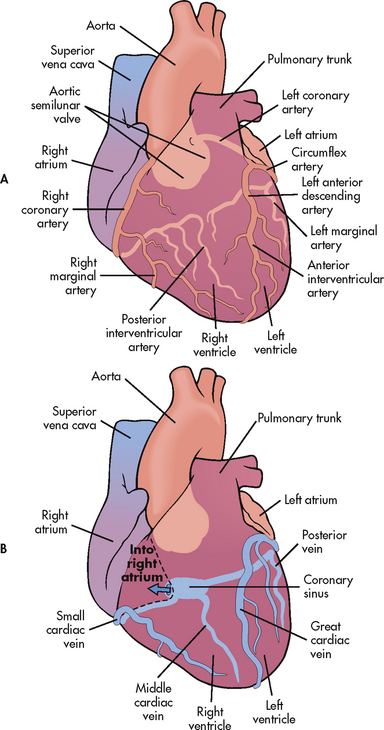
The myocardium has its own blood supply, the coronary circulation (see Fig 31-4). Blood flow into the coronary arteries occurs primarily during diastole. The right coronary artery and its branches usually supply the right atrium, the right ventricle and a portion of the posterior wall of the left ventricle. The left coronary artery and its branches (left anterior descending artery and left circumflex artery) supply the left atrium and the left ventricle. In 90% of people, the atrioventricular (AV) node and the bundle of His, part of the cardiac conduction system, receive blood supply from the right coronary artery. For this reason, obstruction of this artery often causes serious defects in cardiac conduction.
The divisions of coronary veins parallel the coronary arteries. Most of the blood from the coronary system drains into the coronary sinus, which empties into the right atrium near the entrance to the inferior vena cava (see Fig 31-4).
Conduction system
The conduction system consists of specialised nerve tissue responsible for creating and transporting the electrochemical impulses or action potential (AP) through the heart muscle. (The action potential is the momentary change in electrical potential on the surface of a cell that occurs when it is stimulated, resulting in the transmission of an electrical impulse.) Cardiac AP occurs when three ions move across the cell membrane.1 In the rest of the body, the AP results from the opening and closing of two channels: the sodium and potassium channels. Because there are only two channels involved, the AP produced is incredibly swift; the effect of one immediately follows the other. In the case of the heart cells, there are three channels involved: sodium, potassium and calcium, which slows the response. The other difference in the heart cells is that they have automaticity, which means they generate spontaneous depolarisation. Both the sinoatrial (SA) node and the AV node have this capability.1,2
The electricochemical impulse is initiated by the SA node (the pacemaker of the heart) (see Fig 31-5). Each impulse generated at the SA node travels swiftly through the muscle fibres of the atria by internodal pathways and cell-to-cell conduction. Mechanical contraction of the atria follows the depolarisation of the cells. (Cardiac conduction and ECG monitoring are discussed in Ch 35.)
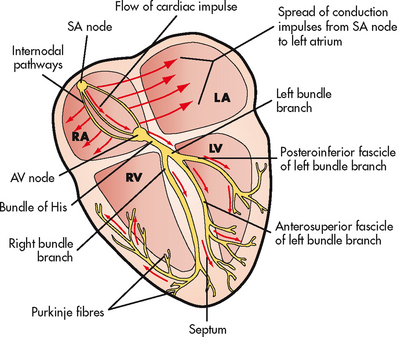
Figure 31-5 Conduction system of the heart. AV, atrioventricular; LA, left atrium; LV, left ventricle; RA, right atrium; RV, right ventricle; SA, sinoatrial.
The cardiac cycle starts with depolarisation of the SA node. Its climax is ejection of blood into the pulmonary and systemic circulations. It ends with repolarisation when the contractile fibre cells and the conduction pathway cells regain their resting polarised condition. Cardiac muscle cells have a compensatory mechanism that makes them unresponsive or refractory to restimulation during the AP. During systole there is an absolute refractory period during which cardiac muscle does not respond to any stimuli. After this period, cardiac muscle gradually recovers its excitability and a relative refractory period occurs by early diastole.3
Electrocardiogram
The electrochemical activity of the heart can be detected on the body surface and is recorded on an electrocardiogram (ECG). The letters P, QRS, T and U are used to identify the separate waveforms (see Fig 31-6).
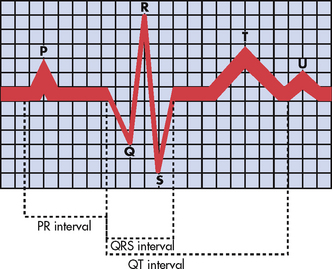
Figure 31-6 The normal electrocardiogram (ECG) pattern. The P wave represents depolarisation of the atria. The QRS interval indicates depolarisation of the ventricles. The T wave represents repolarisation of the ventricles. The U wave, if present, may indicate hypokalaemia or repolarisation abnormalities. The PR interval is a measure of the time required for the impulse to spread from the sinoatrial node to the ventricles.
The first wave, P, begins with the firing of the SA node and represents depolarisation of the fibres of the atria. The QRS wave represents depolarisation from the AV node throughout the ventricles. There is a delay of impulse transmission through the AV node that accounts for the time sequence between the end of the P wave and the beginning of the QRS wave. The T wave represents repolarisation of the ventricles. The U wave, if seen, represents delayed ventricular repolarisation and may be associated with hypokalaemia.
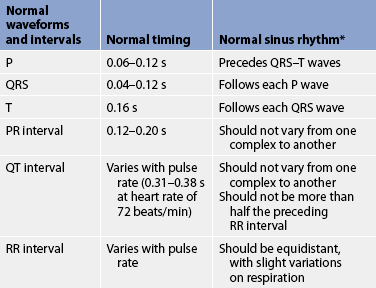
Intervals between these waves (PR, QRS and QT intervals) reflect the length of time it takes for the impulse to travel from one area of the heart to another. These time intervals can be measured (see Table 31-1) and deviations from these time references often indicate pathology. (ECGs are described in detail in Ch 35.) In addition, the RR interval is compared on the ECG and measured to establish regularity between the ECG complexes. The RR interval can also be counted over a 60-second period to reveal the heart rate.
Mechanical system
Depolarisation triggers mechanical activity. Systole, contraction of the myocardium, results in ejection of blood from the cardiac chamber. Relaxation of the myocardium, diastole, allows for filling of the chamber. Cardiac output (CO) is the measurement of mechanical efficiency. CO is the amount of blood pumped by each ventricle in 1 minute. It is calculated by multiplying the amount of blood ejected from the ventricle with the heartbeat—the stroke volume (SV)—by the heart rate (HR) per minute:
CO = SV × HR
For the normal adult at rest, CO is maintained in the range of 4–8 L per minute. The cardiac index (CI) is the CO divided by the body surface area (BSA). The CI adjusts the CO to the body size. The normal CI is 2.8–4.2 L per minute per metre squared (L/min/m2).2
Factors affecting cardiac output
Numerous factors can affect either the HR or the SV and thus the CO. The HR is regulated primarily by the autonomic nervous system through the influence of an increased concentration of circulating catecholamines due to factors such as exercise, the ‘fright or flight’ effect or increased metabolism. The tachycardia that results leads to greater contractility in the heart and an elevation of stroke work and SV. Ventricular filling is affected by the rate and speed of myocardial relaxation and it is influenced by the availability of calcium in the myocardial cells. The factors affecting the SV are preload, contractility and afterload.3 Increasing preload, contractility and afterload increase the workload of the myocardium, resulting in increased oxygen demand.
Starling’s law states that, to a point, the more the fibres are stretched, the greater their force of contraction. Thus the relationship between the initial length of the muscle fibres and the developed force is of prime importance for the function of the heart muscle. The volume of blood in the ventricles at the end of diastole, before the next contraction, is called preload. Preload determines the amount of stretch placed on myocardial fibres.
Contractility can be increased by noradrenaline released by the sympathetic nervous system, as well as by adrenaline. Increasing contractility raises the SV by increasing ventricular emptying.
Afterload is the peripheral resistance against which the left ventricle must pump. Afterload is affected by the size of the ventricle, wall tension and arterial blood pressure. If the arterial blood pressure is elevated, the ventricles will meet increased resistance to ejection of blood, increasing the work demand. Eventually this results in ventricular hypertrophy (enlargement of the cardiac muscle tissue without an increase in the size of cavities).
Cardiac reserve
The cardiovascular system must respond to numerous situations in health and illness (e.g. exercise, stress, hypovolaemia). The ability to respond to these demands by altering CO threefold or fourfold is termed cardiac reserve. The increase in CO results from an increase in HR or SV. The HR can increase to as high as 180 beats/min for short periods without deleterious effects. The SV can be increased by increasing either preload or contractility.
VASCULAR SYSTEM
Blood vessels
The three major types of blood vessels in the vascular system are the arteries, veins and capillaries. Arteries carry blood away from the heart and, except for the pulmonary artery, carry oxygenated blood. Veins carry blood towards the heart and, except for the pulmonary veins, carry deoxygenated blood. Small branches of arteries and veins are arterioles and venules, respectively. Blood circulates from the heart into arteries, arterioles, capillaries, venules and veins and back to the heart.
Arteries and arterioles
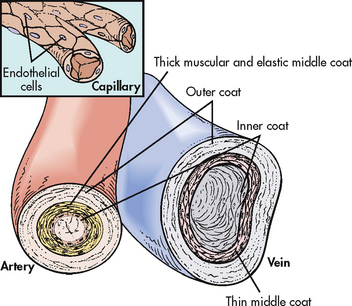
The arterial system differs from the venous system by the amount and type of tissue that makes up arterial walls (see Fig 31-7). The large arteries have thick walls that are composed mainly of elastic tissue. This elastic property cushions the impact of the pressure created by ventricular contraction and provides recoil that propels blood forwards into the circulation. Large arteries also contain some smooth muscle. Examples of large arteries are the aorta and the pulmonary artery.
Arterioles have relatively little elastic tissue and more smooth muscle. Arterioles serve as the major control of arterial blood pressure and distribution of blood flow. They respond readily to local conditions, such as low oxygen (O2) and increasing levels of carbon dioxide (CO2), by dilating or constricting. The innermost lining of the arteries is the endothelium. The endothelium serves to maintain haemostasis, promote blood flow and, under normal conditions, inhibit blood coagulation. When the endothelial surface is disrupted (e.g. rupture of an atherosclerotic plaque), the coagulation cascade is initiated and results in the formation of a fibrin clot.
Veins and venules
Veins are large-diameter, thin-walled vessels that return blood to the right atrium (see Fig 31-7). The venous system is a low-pressure, high-volume system. The larger veins contain semi-lunar valves at intervals to maintain the blood flow towards the heart and to prevent backward flow. The amount of blood in the venous system is affected by a number of factors, including arterial flow, compression of veins by skeletal muscles, alterations in thoracic and abdominal pressures and right atrial pressure.
The largest veins are the superior vena cava, which returns blood to the heart from the head, neck and arms, and the inferior vena cava, which returns blood to the heart from the lower part of the body. These large-diameter vessels are affected by the pressure in the right side of the heart. Elevated right atrial pressure can cause distended neck veins or liver engorgement as a result of resistance to blood flow.
Venules are relatively small vessels made up of a small amount of muscle and connective tissue. Venules collect blood from various capillary beds and channel it to the larger veins.
Capillaries
The thin capillary wall is made up of endothelial cells, with no elastic or muscle tissue (see Fig 31-7). There are many kilometres of capillaries in an adult. The exchange of cellular nutrients and metabolic end products takes place through these thin-walled vessels.
REGULATION OF THE CARDIOVASCULAR SYSTEM
Autonomic nervous system
The autonomic nervous system consists of the sympathetic nervous system and the parasympathetic nervous system (see Ch 55).
Effect on the heart
Stimulation of the sympathetic nervous system increases the HR, the speed of impulse conduction through the AV node and the force of atrial and ventricular contractions. This effect is mediated by specific sites in the heart called alpha(α)-adrenergic receptors, which are receptors for noradrenaline and adrenaline.
In contrast, stimulation of the parasympathetic system (mediated by the vagus nerve) causes a decrease in the HR by the action on the SA node and slows conduction through the AV node.
Effect on the blood vessels
The source of neural control of blood vessels is the sympathetic nervous system. The α-adrenergic receptors are located in vascular smooth muscles. Stimulation of the α-adrenergic receptors results in vasoconstriction. Decreased stimulation to the α-adrenergic receptors causes vasodilation. (Sympathetic nervous system receptors that influence blood pressure are described in Ch 32.)
The parasympathetic nerves have selective distribution in the blood vessels. Blood vessels in skeletal muscle do not receive parasympathetic input.
Baroreceptors
Baroreceptors in the aortic arch and carotid sinus (at the origin of the internal carotid artery) are sensitive to stretch or pressure within the arterial system. Stimulation of these receptors sends information to the vasomotor centre in the brainstem. This results in temporary inhibition of the sympathetic nervous system and enhancement of the parasympathetic influence, causing a decreased HR and peripheral vasodilation. Decreased arterial pressure causes the opposite effect.
Chemoreceptors
Chemoreceptors are located in the aortic arch and carotid body. They are capable of initiating changes in the HR and arterial pressure in response to decreased arterial O2 pressure, increased arterial CO2 pressure and decreased plasma pH. When the chemoreceptor reflexes are stimulated, they subsequently stimulate the vasomotor centre to increase cardiac activity.
BLOOD PRESSURE
The arterial blood pressure (BP) is a measure of the pressure exerted by blood against the walls of the arterial system. The systolic blood pressure (SBP) is the peak pressure exerted against the arteries when the heart contracts. The diastolic blood pressure (DBP) is the residual pressure of the arterial system during ventricular relaxation. BP is usually expressed as the ratio of systolic to diastolic pressure.
The two main factors influencing BP are cardiac output and systemic vascular resistance (SVR):
BP = CO × SVR
SVR is the force opposing the movement of blood. This force is created primarily in small arteries and arterioles. Normal BP is SBP less than 120 mmHg and DBP less than 80 mmHg (see Ch 32).
Measurement of arterial blood pressure
BP can be measured by invasive and non-invasive techniques. The invasive technique consists of catheter insertion into an artery. The catheter is attached to a recording device and the pressure is measured directly (see Ch 65).
Non-invasive, indirect measurement of BP can be done with a sphygmomanometer and a stethoscope. The sphygmomanometer consists of an inflatable cuff and a pressure gauge. The BP is measured externally by listening for sounds of turbulent blood flow through a compressed artery (termed Korotkoff sounds). The brachial artery is the usual site for measuring BP. After placing the appropriate-sized cuff on the extremity, the cuff is inflated to a pressure 20–30 mmHg above the systolic pressure. This causes blood flow in the artery to cease. As the pressure in the cuff is lowered, the artery is auscultated for Korotkoff sounds. There are five phases of Korotkoff sounds. The first phase is a tapping sound caused by the spurt of blood into the constricted artery as the pressure in the cuff is gradually deflated. This sound is considered the SBP. The fifth phase occurs when the sound disappears and is known as the DBP.3 Clinically the BP is recorded as SBP/DBP (e.g. 120/80 mmHg). Occasionally an auscultatory gap is heard. An auscultatory gap is a loss of sound between the SBP and the DBP. The BP could be measured incorrectly if the cuff is not inflated to exceed the true SBP.
Gerontological considerations: effects of ageing on the cardiovascular system
Cardiovascular disease is Australia and New Zealand’s greatest health problem.4 Coronary heart disease predominantly affects middle-aged and older Australians and New Zealanders, with the majority of hospital admissions for heart attack and cardiac procedures occurring among the population aged 60 years and over—70% of acute myocardial infarction (AMI) hospital admissions, 73% of coronary artery bypass graft (CABG) procedures and 61% of percutaneous transluminal coronary angioplasty (PTCA) procedures. Premature death related to cardiovascular disease accounts for 24.2% of male deaths and 17.2% of female deaths.4 The most common cardiovascular problem is coronary artery disease (CAD) secondary to atherosclerosis. It is difficult to separate normal ageing changes from the pathophysiological changes of atherosclerosis. Current research suggests that some of the normal changes of ageing promote atherosclerosis, hypertension and cardiac failure.4
With increasing age, the amount of collagen in the heart increases and elastin decreases. These changes affect the contractile and distensible properties of the myocardium. One of the major age-associated alterations in the cardiovascular response to exercise is a striking decrease in the cardiac response caused by decreased contractility and the HR response to increased work. The resting HR is not markedly affected by ageing.
Cardiac valves become thicker and stiffer from lipid accumulation, degeneration of collagen and calcification. The aortic and mitral valves are most frequently affected. This can lead to valve incompetence or stenosis. The turbulent blood flow across the affected valve results in a murmur.
The number of pacemaker cells in the SA node decreases with age. By 75 years, a person may have only 10% of the normal number of pacemaker cells, though this is compatible with normal SA node function.5 This increases the likelihood of SA node dysfunction, causing sinus bradycardia. Similar decreases in the number of conduction cells in the AV node, the bundle of His and the bundle branches also occur with ageing. Fibrosis of the bundle branches may precipitate chronic heart block. A normal ECG of an ageing patient may show small, inconspicuous increases in the PR, QRS and QT intervals.
The autonomic nervous system control of the cardiovascular system is altered with ageing. The number and function of beta(β)-adrenergic receptors in the heart decrease with age. Therefore, the older adult has a decreased response to physical and emotional stress and is less sensitive to β-adrenergic agonist drugs.
Arterial blood vessels thicken and become less elastic with age. Arteries increase their sensitivity to vasopressin (antidiuretic hormone).5 Both of these changes contribute to a progressive increase in SBP and a decrease or no increase in DBP with age. Consequently an increase in the pulse pressure is found. Despite the changes associated with ageing, the heart is able to function adequately under most circumstances.
Age-related changes in the cardiovascular system and differences in assessment findings are presented in Table 31-2.
In addition to the auscultatory technique, another non-invasive way to measure BP indirectly is to use an automated device that uses oscillometric measurements to assess BP. Though this method does not involve auscultation of Korotkoff sounds, the same attention to proper technique is important for accuracy.
SBP (and pulse) can be assessed using a Doppler ultrasonic flowmeter. The hand-held transducer is positioned over the artery (identified by audible, pulsatile sounds). The cuff is applied above the artery, inflated until the sounds disappear and then another 23–30 mmHg beyond that point. The cuff is then slowly deflated until sounds return. This point is the SBP.
Another non-invasive way to measure BP indirectly is to use automatic BP monitors (see Ch 32). Ambulatory BP monitoring may be used to diagnose hypertension more accurately in some patients (see Ch 32). The monitor consists of a BP cuff and a lightweight microprocessing unit. This method records a patient’s BP at preset intervals during routine activities over 24–48 hours.
Newer devices for self-monitoring of BP that use the same peripheral blood flow occlusion method have sensors attached to the finger or ear.
Pulse pressure and mean arterial pressure
Pulse pressure is the difference between the SBP and DBP. It is normally about one-third of the SBP. If the BP is 120/80 mmHg, the pulse pressure is 40 mmHg. An increased pulse pressure may occur during exercise or in individuals with atherosclerosis of the larger arteries due to an increased SBP. A decreased pulse pressure may be found in cardiac failure or hypovolaemia.
Another measurement related to BP is the mean arterial pressure (MAP). The MAP is the perfusion pressure felt by organs in the body. It is not the average of the DBP and SBP because the duration of diastole exceeds that of systole at normal HRs. MAP is calculated by adding the DBP to one-third of the pulse pressure:
MAP = DBP + ⅓ pulse pressure
A person with a BP of 120/60 mmHg has a MAP of 80 mmHg. A MAP of greater than 60 mmHg is necessary to sustain the vital organs of an average person under most conditions. If the MAP falls significantly below this number for an appreciable time, vital organs will be under-perfused and will become ischaemic.
Assessment of the cardiovascular system
SUBJECTIVE DATA
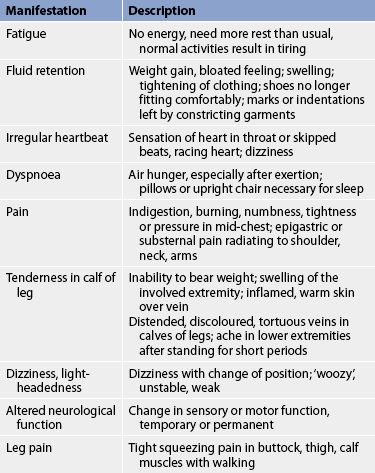
A careful health history and physical examination should aid in differentiating symptoms that reflect a cardiovascular problem from those of problems in other body systems. For instance, it is important to determine whether weight gain is the result of overeating or a manifestation of fluid retention. Common diagnostic cues that should alert you to the possibility of underlying cardiovascular problems should be explored and documented (see Table 31-3). Nurses need to be aware that men and women may describe different signs and symptoms when explaining cardiac events (see Health disparities box). Close questioning of the patient is crucial.
Important health information
Past health history
Many illnesses affect the cardiovascular system directly or indirectly. The patient should be questioned about a history of chest pain, shortness of breath, alcoholism or excessive drinking, anaemia, rheumatic fever, streptococcal sore throat, congenital heart disease, stroke, syncope, hypertension, thrombophlebitis, intermittent claudication, varicosities and oedema.
Medications
An assessment of the patient’s current and past use of medications should be made. This includes both over-the-counter (OTC) drugs and prescription drugs. For example, aspirin, which prolongs the blood clotting time, is contained in many drugs used to alleviate cold symptoms.
HEALTH DISPARITIES
Men
• Experience the onset of heart disease earlier than women.
• Are often less ill on presentation.
• Have more typical angina symptoms.
• Describe pain as substernal, crushing pain.
• Standard screening for the risk of sudden cardiac death (e.g. EPS) has been noted to be more predictive in men.
• Are more likely to be referred for cardiac catheterisation.
Women
• Experience the onset of heart disease approximately 10 years later than men.
• Are often more ill on presentation.
• Have more coexisting conditions.
• Often have angina symptoms that are not typical.
• Often report pain in the back, jaw, arms, epigastric region.
• May report non-pain symptoms, such as fatigue, diaphoresis, palpitations, nausea or vomiting.
• Certain diagnostic tests are less predictive for women.
• Exercise ECG testing is possibly affected by hormonal factors influencing ST changes.
• Nuclear imaging is affected by artefact from breast attenuation.
• Pharmacological echocardiography is recommended as an effective method for evaluating women.
A medication assessment should list the name of the drug and the patient’s understanding of its purpose and side effects. Drugs that may adversely affect the cardiovascular system should also be assessed. Some of these and examples of their effect on the cardiovascular system are as follows:
Surgery or other treatment
Ask the patient about specific treatments, past surgery or hospital admissions related to cardiovascular problems. Any hospitalisations for diagnostic examinations or cardiovascular symptoms should be explored. Note whether an ECG or a chest X-ray was taken for baseline data.
Functional health patterns
The strong correlation between components of a patient’s lifestyle and cardiovascular health supports the need to review each functional health pattern. Key questions to ask patients with cardiovascular problems are listed in Table 31-4.
• Have you noticed an increase in cardiovascular symptoms, such as chest pain or dyspnoea?*
• Do you practise any preventative measures to decrease cardiac risk factors?*
• Do you foresee any potential self-care problems because of your cardiovascular problem?*
• Describe your usual daily dietary intake, including fat, sodium and fluid.
• What is your present weight? What was your weight 1 year ago? If different, explain.
• Does eating cause fatigue or shortness of breath?*
• Do your feet or ankles ever swell?*
• Have you ever taken medication to help you get rid of excess fluid?*
• Are your activities or exercises limited because of your cardiovascular problem?*
• Are your activities of daily living restricted because of your cardiovascular problem?*
• Do you experience any discomfort or side effects as a result of exercise or activity?*
• How many pillows do you sleep on at night?
• How many times a night do you awaken to urinate?
• Do you ever wake up suddenly and feel as if you cannot catch your breath?*
• Have you noticed any changes in your memory or level of awareness?*
• Do you ever experience dizziness?*
• Do you find it difficult to express yourself verbally?*
• Do you experience any pain (e.g. Chest pain, leg pain with activity) as a result of your cardiovascular problem?*
Self-perception–self-concept pattern
• Have your perceptions of yourself changed since you were diagnosed with a cardiovascular disease?*
• How has your cardiovascular disease affected your life and your self-esteem?
• Describe how this illness has affected the roles that you play in your daily life.
• Describe how this illness has affected your relationships.
• How have your significant others been affected by your disease?
Sexuality–reproductive pattern
• Has your sexual behaviour changed?*
• Do you experience any cardiac-related symptoms during intercourse?*
• Do any of your medications affect your ability to participate in sexual activities?*
Coping–stress tolerance pattern
• Do you practise any stress reduction techniques?*
• Describe your normal coping mechanisms for stress.
• Who or where would you turn to during a time of stress? Are these people or services helping you now?*
• Do you feel capable of handling your present health situation?
• Do you experience any cardiovascular symptoms, such as chest pain or palpitations, during times of stress?*
• What influence has your value-belief system had during your illness?
• Do you feel any conflicts between your value-belief system and your planned therapy?*
• Describe any cultural or religious beliefs that may influence the treatment of your cardiovascular problem.
Health perception–health management pattern
Ask the patient about the presence of cardiovascular risk factors. Major risk factors include elevated serum lipid levels, hypertension, cigarette smoking, sedentary lifestyle and obesity. Stressful lifestyle and diabetes mellitus should also be investigated.
If the patient uses tobacco, the number of pack-years of tobacco use (number of packets smoked per day multiplied by the number of years the patient has smoked) should be estimated. The patient’s attitude about tobacco use, as well as attempts to stop and methods used, should be documented. Alcohol use should also be recorded. This information should include type of alcohol, amount, frequency and any changes in the reaction to it. In addition, the use of habit-forming drugs, including recreational drugs, should be noted. It is also important to obtain information on the patient’s perception of how this illness may affect the future level of wellness and ability for self-care.
A question about the patient’s allergies is appropriate. Determine whether the patient has ever experienced a drug reaction or an allergic reaction. A specific question regarding any allergic reaction to shellfish is important as this may warn of potential dye allergies. If the patient has been treated for allergies, their understanding of this therapy should be determined. The patient should also be asked whether they have experienced an anaphylactic reaction.
Confirmed illnesses of blood relatives can highlight any hereditary or familial tendencies towards CAD, peripheral vascular disease, hypertension, bleeding, cardiac disorders, diabetes mellitus, atherosclerosis and stroke. Any family members who were diagnosed with cardiac disease when they were younger than 55 years should be noted. In addition, disorders affecting the vascular system, such as intermittent claudication and varicosities, may be familial. Finally, a family health history of non-cardiac conditions, such as asthma, renal disease and obesity, should be assessed because they can affect the cardiovascular system.
Nutritional–metabolic pattern
Being underweight or overweight may indicate potential cardiovascular problems. Thus, it is important to assess the patient’s weight history in relation to height and build. It is also of value to record the history of weight gain and loss and the patient’s attitude to healthy eating and weight loss. A typical day’s diet should be examined for its adequacy in relation to the patient’s lifestyle. The amount of salt, saturated fats and triglycerides in the patient’s diet should be determined. In addition to actual food habits, which may be influenced greatly by ethnicity, the patient’s attitudes and plans in relation to diet should be investigated.
Elimination pattern
The patient on diuretics may report increased urinary elimination, increased stress incontinence and sleep disturbance from nocturia. Problems with constipation should be investigated and documented. Straining at stool (Valsalva manoeuvre) should be avoided in patients with cardiovascular problems. Cardiovascular problems may impair the patient’s ability to get to a toilet as quickly as necessary. The patient should be questioned about this if incontinence or constipation is problematic and whether they have changed activity and exercise patterns due to these problems.
Activity–exercise pattern
The benefit of exercise to cardiovascular health is indisputable, with sustained aerobic exercise being most beneficial in the early stages of cardiovascular diseases and resistance exercises taking an important role in the rehabilitation of people with heart failure. Inquire about the types of exercise undertaken, their duration and frequency and the occurrence of any unwanted effects. Record the length of time the exercise program has been practised, along with participation in individual or group sports. Any symptoms indicative of cardiovascular problems, such as light-headedness, chest pain, shortness of breath or claudication, during exercise should be noted. Patients with diabetes mellitus should screen their blood sugar level before and after exercise when commencing or increasing their exercise activities.
The patient should also be questioned about any limitations in activities of daily living (ADLs) as a result of a cardiovascular problem. Such problems are often associated with fatigue and depression, which are symptoms of cardiac disease. Also gather information about the patient’s leisure and recreational activities. Any decrease in previous abilities should be noted, as there may be an insidious decline in ADLs.
Sleep–rest pattern
Although there are many possible causes, cardiovascular problems are often the cause of interrupted sleep. Paroxysmal nocturnal dyspnoea (attacks of shortness of breath, especially at night, that awaken the patient) and Cheyne-Stokes respirations are associated with heart failure. Many patients with heart failure may need to sleep with their head elevated on pillows. Note the number of pillows needed for comfort and whether this has changed recently.
Sleep apnoea has been associated with an increased risk of life-threatening arrhythmias, especially in patients with left ventricular failure, and should be investigated. Nocturia, a common finding with cardiovascular patients, also interrupts normal sleep patterns and should be explored.
Cognitive–perceptual pattern
It is important to ask both the patient and significant others about cognitive–perceptual problems. Any pain associated with the cardiovascular system, such as chest pain and claudication, should be reported. Cardiovascular problems such as arrhythmias, hypertension and stroke may cause problems with vertigo, language and memory. As a person ages the likelihood of problems associated with vascular dementia occur and these need to be considered when evaluating the patient’s cognition and perception.
Self-perception–self-concept pattern
If a cardiovascular event has been of acute origin, the patient’s self-perception may be affected. Invasive diagnostic and palliative procedures often lead to body image concerns for the patient. When the cardiovascular disease is chronic in nature, the patient may not be able to identify the cause but can often describe the inability to ‘keep up’ previous levels of activity or accomplishments. This too may affect the patient’s self-esteem. Therefore, it is essential to inquire about the effects of the illness on the patient.
Role–relationship pattern
The patient’s sex, ethnicity and age are all related to cardiovascular health and are therefore important basic information. In addition, discussing the patient’s marital status, role in the household, number of children and their ages, living environment and carer responsibilities and significant others assists in identifying strengths and support systems in the patient’s life. It is important to assess the patient’s level of satisfaction or dissatisfaction with each assigned role, as this may indicate possible areas of stress or conflict.
Sexuality–reproductive pattern
Ask the patient about the effect of the cardiovascular problem on sexual patterns and satisfaction. It is common for patients with cardiovascular problems to have a fear of sudden death during sexual intercourse, causing a major alteration in sexual behaviour. Fatigue or shortness of breath may also curtail sexual activity. Erectile dysfunction may be a symptom of peripheral vascular disease and is a side effect of some medications used in treating cardiovascular problems (e.g. β-adrenergic blockers, diuretics). This side effect may result in non-compliance with medical treatment. Counselling of both the patient and partner may be indicated.
Ask male patients about the use of drugs for erectile dysfunction (e.g. sildenafil). These drugs are contraindicated if the patient is taking a nitrate. When taken together, life-threatening hypertension can occur.
Ask female patients about the use of hormone replacement therapy (HRT) for symptoms of menopause. Studies have indicated that there is no cardiac benefit with the use of HRT and there may possibly be an increased cardiac risk.
Coping–stress tolerance pattern
Ask the patient to identify areas that cause them stress or anxiety. Potentially stressful areas include marital relationships, family, occupation, church, friends, finances and housing. Although many people enjoy certain activities, these activities can be stressful at the same time as they are rewarding. The usual methods of coping with stress should be investigated.
High levels of anxiety, anger and hostility have emerged as risk factors for cardiac disease and cardiac events.6 The patient and family should be asked about the frequency of these types of behaviour.
Information about support systems, such as family, extended family and friends, counsellors or religious groups, may provide excellent resources for developing a plan of care.
Value–belief pattern
Individual values and beliefs, which are greatly affected by culture and/or experiences with the health system, may play a significant role in the level of conflict a patient faces when dealing with a diagnosis of cardiovascular disease. Some patients may attribute their illness to punishment from God; others may feel that a ‘higher power’ may assist them; while yet others may adopt a more fatalistic approach to their illness and a reduced interest in rehabilitation and lifestyle changes. Information about a patient’s values and beliefs will help you to intervene during periods of crisis. It is also important to determine whether the proposed plan of care causes any conflict with the patient’s value system.
OBJECTIVE DATA
Physical examination
Vital signs
After the patient’s general appearance has been observed, vital signs, including BP, heart rate, respiratory rate and temperature, are taken. Orthostatic (postural) BP and HR should be measured while the patient is sitting, lying and standing. An appropriate-sized cuff should be used for accurate readings. Normally there is a reduction of up to 15 mmHg in the SBP and 3–5 mmHg in the DBP in the standing position. The HR should not increase more than 20 beats per minute from supine to standing. Baseline BP measurements should be taken in both arms. These readings may vary by 5–15 mmHg. A greater variance indicates pathology. The arm with the highest BP should be used for subsequent readings. BP in the lower extremities is expected to be about 10 mmHg higher than in the upper extremities.
Peripheral vascular system
Inspection
Inspection of the skin colour, hair distribution and venous blood flow provides information about arterial blood flow and venous return. The extremities should be inspected for conditions such as oedema, thrombophlebitis, varicose veins and lesions (e.g. stasis ulcers). Oedema in the extremities can be caused by gravity, interruption of venous return or elevation of right atrial pressure.
A measure used for assessing arterial flow to the extremities is the capillary filling time. The patient’s hands are positioned near the level of the heart and the nail beds are squeezed to produce blanching and observed for the return of colour. With normal arterial capillary perfusion and CO, the colour will return within 3 seconds.
The large veins in the neck (internal and external jugular) should be inspected while the patient is gradually elevated to an upright (30–45°) position. Distension and prominent pulsations of these neck veins, referred to as jugular venous distension, can be caused by right atrial pressure elevation.
Palpation
Palpation of the pulses in the neck and extremities also provides information on arterial blood flow. The pulses should be palpated to assess the volume and pressure within each vessel. Characteristics of the arteries on the right and left sides of the body should be compared. It is important to palpate each carotid pulse separately to avoid vagal stimulation and subsequent arrhythmias.
When palpating the arteries identified by the pulse points in Figure 31-8, note the pressure of the pulse wave or how far the vessel wall distends when the pulse occurs. This judgement of the pulsation volume is recorded as normal, bounding, thready or absent. A scale may be used to document pulse volume or amplitude:3
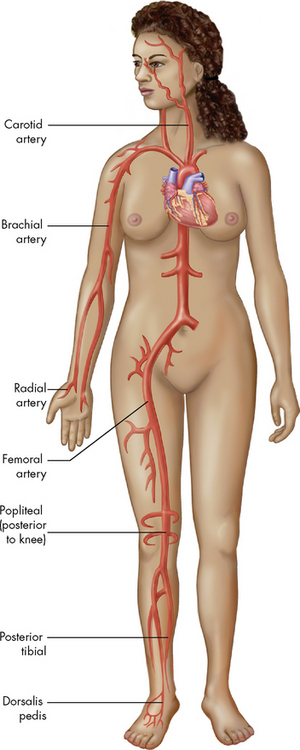
Figure 31-8 Each pulse point is named after the artery with which it is associated.
Source: Patton, KT, Thibodeau GA. Anatomy & physiology. 7th edn. St Louis: Mosby; 2010.
The rigidity (hardness) of the vessel should also be noted. The normal pulse will feel like a tap, whereas a vessel wall that is narrowed or bulging will vibrate. The term for a palpable vibration is thrill.
Auscultation
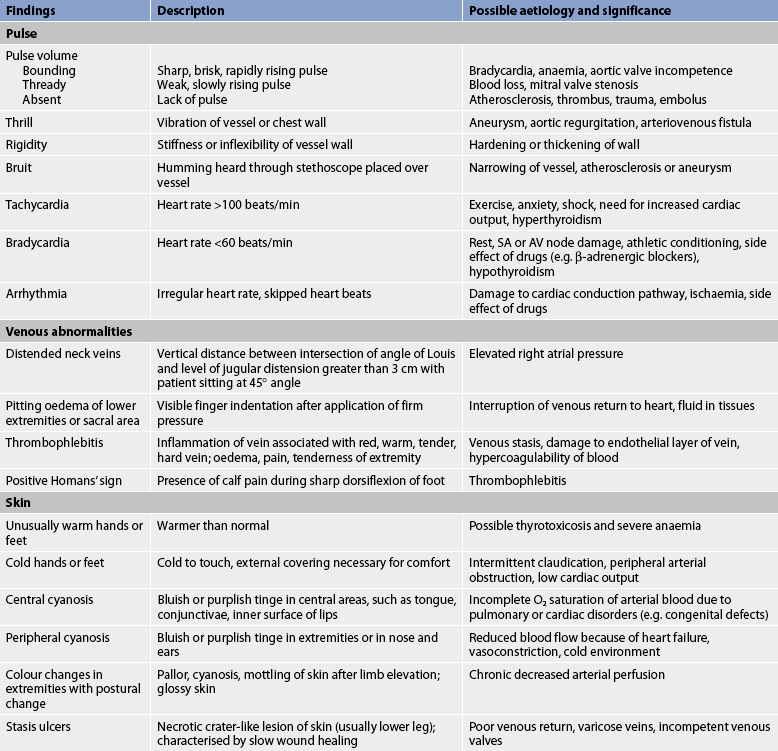
An artery that has a narrowed or bulging wall may create turbulent blood flow. This abnormal flow can create a buzzing or humming termed a bruit. It can be heard with a stethoscope placed over the vessel. Auscultation of major arteries, such as the carotid arteries, abdominal aorta and femoral arteries, should be part of the initial cardiovascular assessment. Abnormalities of the cardiovascular system are described in Table 31-5.
Thorax
Inspection and palpation
An overall inspection and palpation of the bony structures of the thorax is the initial step in the examination. Next, inspect and palpate the areas where the cardiac valves project their sounds by identifying the intercostal spaces (ICSs). The raised notch, the angle of Louis, where the manubrium and the body of the sternum are joined, is readily palpable in the midline of the sternum. The angle of Louis is at the level of the second rib and can therefore be used to count ICSs and locate specific auscultatory areas.
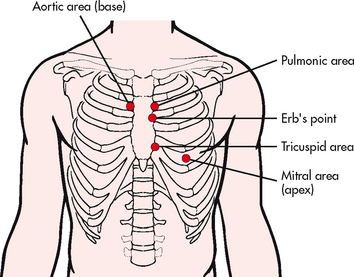
The following auscultatory areas can be located: aortic area in the second ICS to the right of the sternum; pulmonic area in the second ICS to the left of the sternum; tricuspid area in the fifth left ICS close to the sternum; and mitral area in the left midclavicular line at the level of the fifth ICS (see Fig 31-9). A fifth auscultatory area is Erb’s point, located at the third left ICS near the sternum. Normally, no pulsations are felt in these areas unless the patient has a thin chest wall.
Valvular disorder may be suspected if abnormal pulsations or thrills are felt. Next, inspect and palpate the epigastric area, which lies on either side of the midline just below the xiphoid process. (In a thin person the pulsation of the abdominal aorta may be visible and can normally be palpated here.) Then inspect the praecordium, which is located between the apex and the sternum, for heaves. Heaves are sustained lifts of the chest wall in the praecordial area that can be seen or palpated. They may be caused by left ventricular enlargement. Normally no pulsations are seen or felt here.
When the patient is recumbent, inspect and palpate the mitral valve area for the PMI, which is due to the pulsation of the apex of the heart. This pulsation or ventricular thrust lies within the midclavicular line in the fifth ICS (see Fig 31-1). If the PMI is palpable, its position is recorded in relation to the midclavicular line and ICSs. When the PMI is left of the midclavicular line, the heart may be enlarged.
Percussion
The borders of the right and left sides of the heart can be estimated by percussion. Stand to the right of the recumbent patient and percuss along the curve of the rib in the fourth and fifth ICS, starting at the midaxillary line. The percussion note over the heart is dull in comparison with the resonance over the lung and is recorded in relation to the midclavicular line.
Auscultation
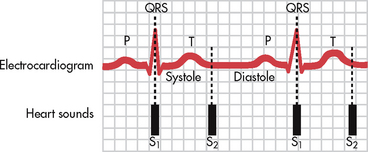
The movement of the cardiac valves creates some turbulence in the blood flow, resulting in normal heart sounds (see Fig 31-10). These sounds can be heard through a stethoscope placed on the chest wall. The first heart sound (S1), which is caused by the closure of the tricuspid and mitral (AV) valves, has a soft lub sound. The second heart sound (S2), which is caused by the closure of the aortic and pulmonic (semilunar) valves, has a sharp dup sound. S1 signals the beginning of systole. S2 signals the beginning of diastole (see Fig 31-11). Listen to the auscultatory areas in sequence with both the diaphragm and the bell of the stethoscope.
The first and second heart sounds are heard best with the diaphragm of the stethoscope because they are high pitched. Extra heart sounds (S3 or S4), if present, are heard best with the bell of the stethoscope because they are low pitched. If the patient leans forwards while sitting, sounds from the second ICS (aortic and pulmonic areas) are accentuated, whereas the left lateral decubitus position accentuates sounds produced at the mitral area.
Listen at the apical area with the diaphragm of the stethoscope while simultaneously palpating the radial pulse. If fewer radial than apical pulses are counted, a pulse deficit is present. A judgement about the rhythm (regular or irregular) is also made when listening at the apex.
Palpating one carotid artery while auscultating it allows differentiation of S1 from S2 and systole from diastole. Because S1 (lub) occurs almost simultaneously with ventricular ejection, it is heard when the carotid pulse is felt.
Normally no sound is heard between S1 and S2 during the periods of systole and diastole. Sounds that are heard during these periods may represent abnormalities and should be described. An exception to this is a normal splitting of S2, which is best heard at the pulmonic area during inspiration. Splitting of this heart sound can be abnormal if it is heard during expiration or if it is constant (fixed) during the respiratory cycle.
The S3 heart sound is a low-intensity vibration of the ventricular walls usually associated with ventricular filling. An S3 heart sound may occur in patients with left ventricular failure or mitral valve regurgitation. It is heard closely after S2 and is known as a ventricular gallop. The S4 heart sound is a low-frequency vibration caused by atrial contraction. It precedes S1 of the next cycle and is known as an atrial gallop. An S4 heart sound may occur in patients with CAD, left ventricular hypertrophy or aortic stenosis.
Murmurs are sounds produced by turbulent blood flow through the heart or the walls of large arteries. Most murmurs are the result of cardiac abnormalities but some occur in normal cardiac structures. Murmurs are graded on a six-point scale of loudness and recorded as a Roman numeral ratio; the numerator is the intensity of the murmur and the denominator is always VI, which indicates that the six-point scale is being used. A grade of I/VI indicates a soft, faint murmur; a grade of VI/VI indicates a murmur that can be heard without a stethoscope.
If an abnormal sound is heard, it should be documented. This description should include the timing (during systole or diastole), location (the site on the chest where it is heard the loudest), pitch (heard best with the diaphragm or the bell of the stethoscope), position (heard best when the patient is recumbent, sitting and leaning forwards or in the left lateral decubitus position), characteristic (harsh, musical, soft, short, long) and any other abnormal findings (irregular cardiac rhythms or palpable chest wall heaves) associated with the sound.
The most common abnormal sounds and abnormal assessment findings are described in Table 31-5. A method of recording data from the cardiovascular assessment is presented in Table 31-6.
TABLE 31-6 Normal physical assessment of the cardiovascular system
| Inspection | Normal skin colour with capillary refill time <3 s; thorax symmetric with no visible PMI; no JVD with patient at 45° angle |
| Palpation | PMI palpable in fifth ICS at MCL; no forceful pulsations, thrills or heaves; slight palpable pulsations of abdominal aorta in epigastric area; carotid and extremity pulses 2+ and equal bilaterally; no evidence of impaired arterial flow or venous return in lower extremities |
| Percussion | Unable to distinguish right-sided heart border |
| Auscultation | S1 and S2 heard; HR 72 beats/min and regular; no murmurs or extra heart sounds |
HR, heart rate; ICS, intercostal space; JVD, jugular venous distension; MCL, midclavicular line; PMI, point of maximal impulse.
Diagnostic studies of the cardiovascular system
Numerous diagnostic procedures add to the information obtained from the history and physical examination of the cardiovascular system. The most common studies used to assess the cardiovascular system are presented in Table 31-7.
TABLE 31-7 Cardiovascular system
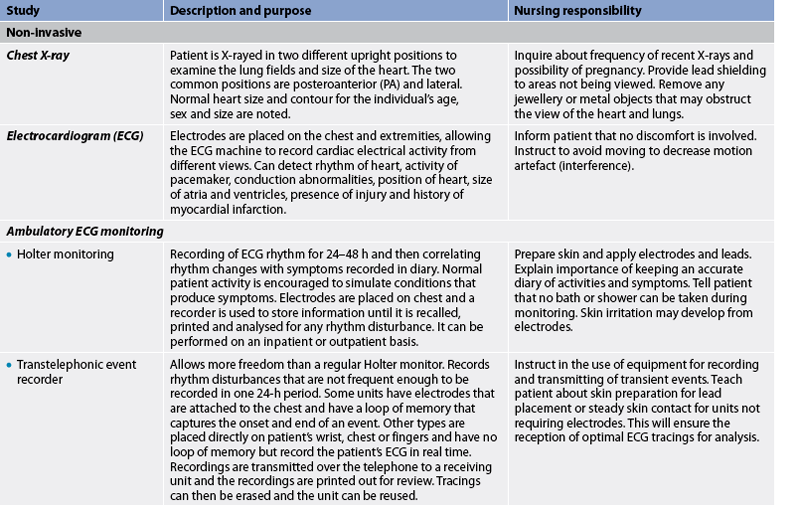
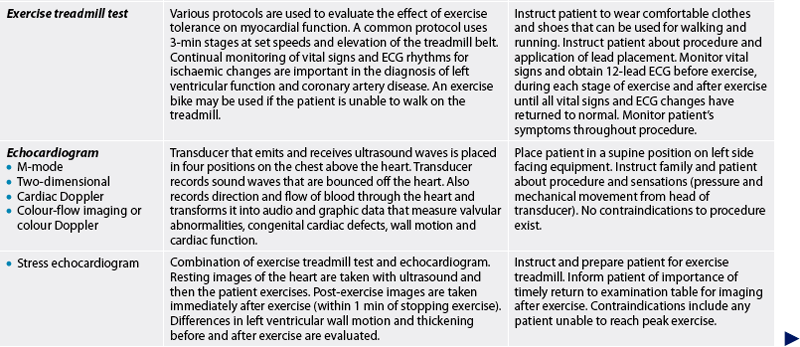
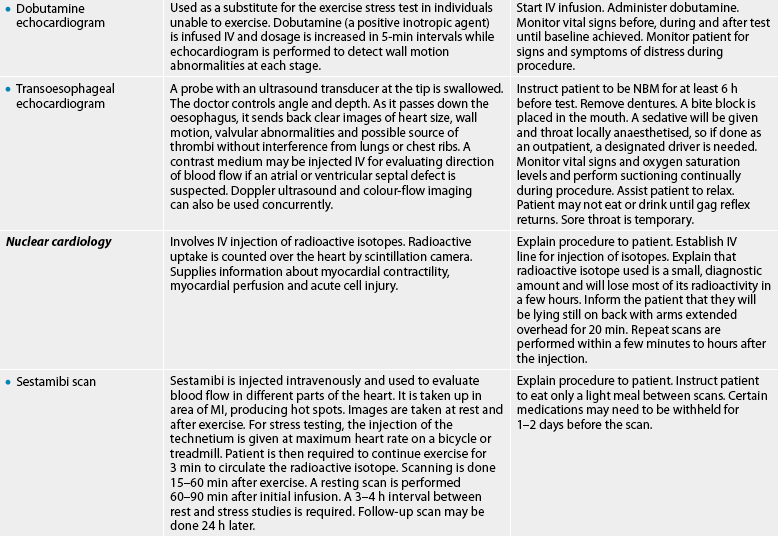
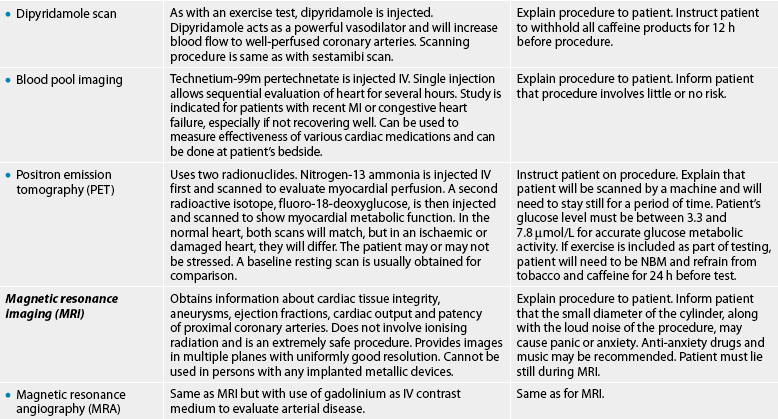
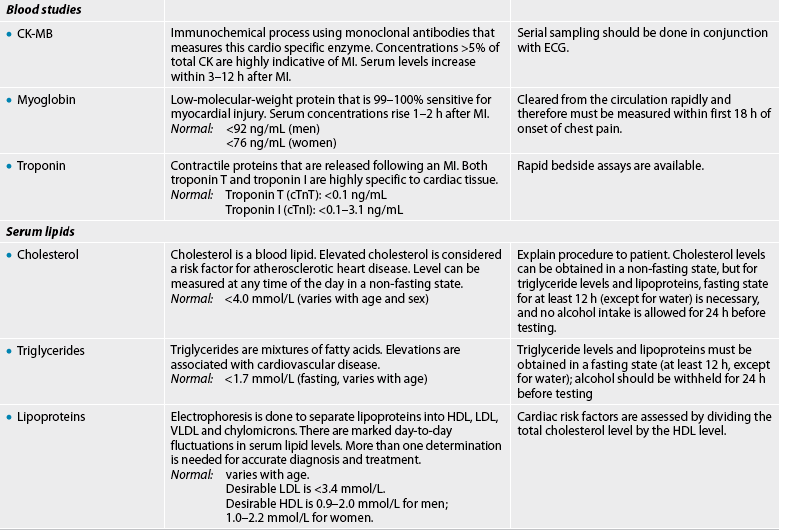
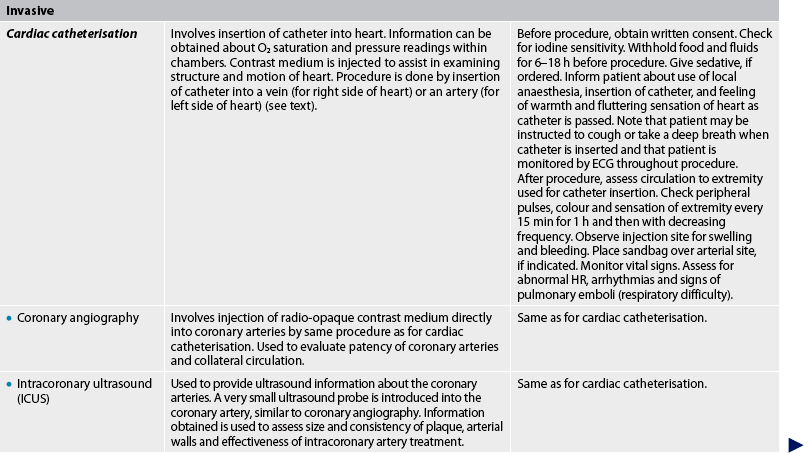

CK, creatinine kinase; ECG, electrocardiogram; HDL, high-density lipoproteins; HR, heart rate; IV, intravenous; LDL, low-density lipoproteins;
MI, myocardial infarction; NBM, nil by mouth; VLDL, very-low-density lipoproteins.
* Additional peripheral vascular diagnostic studies are found in table 37-5.
BLOOD STUDIES
Numerous blood studies contribute information about the cardiovascular system. For example, studies of the blood itself reflect the O2-carrying capacity (red blood cell count and haemoglobin) and coagulation properties (clotting times).
Cardiac markers
When myocardial cells are injured, they release their cell contents, including enzymes and other proteins, into the circulation. These biochemical markers are useful in the diagnosis of myocardial injury and necrosis. The enzymes that are characteristic of cardiac injury are creatine kinase (CK), lactic dehydrogenase (LDH) and serum aspartate aminotransferase (AST), formerly called serum glutamic-oxalocetic transaminase (SGOT). Because these enzymes are found in a variety of body tissues, they can be elevated as a result of injury to the muscles, liver, brain and other organs. LDH and AST levels are no longer typically used as markers of myocardial injury. CK is present in heart muscle, skeletal muscle and brain tissue. CK-MM is found primarily in the skeletal muscle and CK-BB is found in the brain and nervous tissue. CK-MB elevation is specific for myocardial tissue injury. CK-MB levels rise 4–6 hours after symptom onset, peak in 18–24 hours and return to baseline within 3 days after myocardial infarction (MI).
Troponin is a myocardial muscle protein released into circulation after injury. There are two subtypes—troponin T (cTnT) and troponin I (cTnI)—and they are specific to myocardial tissue so are therefore the preferred test to diagnose MI. Normally there is no circulating troponin, so a rise in its level is diagnostic of myocardial damage. cTnT and cTnI are detectable within 1 hour of myocardial injury, have specificity at 3–6 hours following the onset of symptoms and reach peak levels within 12 hours.7
Myoglobin is a low-molecular-weight haem protein found in cardiac and skeletal muscle. Myoglobin elevation is a sensitive indicator of early MI and serum elevations occur within 1–2 hours after injury but decline rapidly after 7 hours. Its clinical value is limited due to the non-specificity of myoglobin for MI and its brief presence after infarction (24 hours).8
Correct interpretation of diagnostic tests requires consideration of the time frame from the onset of symptoms, together with the time frame of the expected presence and elevated levels of the biomarkers. The additional data (patient symptoms, history and ECG changes) complete the diagnostic picture for the patient with a suspected MI.8
Blood lipids
Blood lipids consist of triglycerides, cholesterol and phospholipids. They circulate in the blood bound to protein. Thus, they are often referred to as lipoproteins (see Fig 33-6).
Triglycerides are the main storage form of lipids and constitute approximately 95% of fatty tissue. Cholesterol, a structural component of cell membranes and plasma lipoproteins, is a precursor of corticosteroids, sex hormones and bile salts. In addition to being absorbed from food in the gastrointestinal tract, cholesterol can also be synthesised in the liver. Phospholipids contain glycerol, fatty acids, phosphates and a nitrogenous compound. Although formed in most cells, phospholipids usually enter the circulation as lipoproteins synthesised by the liver. Apoproteins are water-soluble proteins that combine with most lipids to form lipoproteins.
Different classes of lipoproteins contain varying amounts of the naturally occurring lipids. These include the following:
1. chylomicrons: primarily exogenous triglycerides from dietary fat
2. low-density lipoproteins (LDLs): mostly cholesterol with moderate amounts of phospholipids
3. high-density lipoproteins (HDLs): about one-half protein and one-half phospholipids and cholesterol
4. very-low-density lipoproteins (VLDLs): primarily endogenous triglycerides with moderate amounts of phospholipids and cholesterol.
A lipid profile test usually measures cholesterol, triglyceride, LDL and HDL levels. An elevation in LDL has a strong and direct association with CAD; an increase in HDL has been associated with a decreased risk of CAD.3 High levels of HDL serve a protective role by mobilising cholesterol from tissues. Increased triglyceride levels are also linked to the progression of CAD.9 Although the association between elevated serum cholesterol levels and CAD exists, determination of total cholesterol level is not sufficient for an assessment of coronary risk. A risk assessment for CAD is given by comparing the total cholesterol to HDL ratio.10 An increase in the ratio indicates increased risk. This combination provides more information than either value alone. The patient must fast for 12–14 hours before the blood test to eliminate the effects of a recent meal. A specimen should not be taken if the patient is under acute stress.
Plasma levels of apolipoprotein A-1 (Apo A-1) (the major HDL protein) and apolipoprotein B (Apo B) (the major LDL protein) are better predictors of CAD than HDL or LDL levels. Measurements of these lipoproteins may replace cholesterol–lipoprotein determinations in assessing the risk of CAD.
Lipoprotein (a), or Lp (a), is being assessed for its role in CAD. Increased levels of Lp (a), especially with increased levels of LDH, are strongly associated with the progression of atherosclerosis. In addition, Lp (a) is found to have thrombogenic properties that increase the risk of clot formation at the site of intravascular lesions.10
Lipoprotein-associated phospholipase A2 (Lp-PLA2) is an enzyme made by macrophages. Lp-PLA2 promotes vascular inflammation through the hydrolysis of oxidised LDLs within the intima of blood vessels, thus contributing directly to the development of atherosclerosis. Elevated levels of Lp-PLA2 are indicative of the vascular inflammation that is associated with the formation of plaque within the arteries.
Serum levels of Lp-PLA2 are measured by the PLAC test. Elevated results on the PLAC test even without an elevation in LDL-cholesterol levels has been related to an increased risk of having CAD. The PLAC blood test can be included in normal clinical evaluation to better determine a patient’s risk for developing CAD.
C-reactive protein
C-reactive protein (CRP) is a protein produced by the liver during periods of acute inflammation. It is emerging as an independent risk factor for CAD and predictor of cardiac events. The measurement of CRP using a high-sensitivity test (hsCRP) has been shown to predict the risk for future cardiac events in patients with unstable angina and MI.11
Homocysteine
Homocysteine is an amino acid that is produced during protein catabolism. Elevated homocysteine levels can be either hereditary or acquired from dietary deficiencies of vitamins B6, B12 or folate. Elevated levels have been linked to an increased risk of a first cardiac event. They have also been identified as a predictor of CAD, stroke and thromboembolism, even in patients with familial predisposition to early cardiovascular disease.
Cardiac natriuretic peptide markers
There are three natriuretic peptides (NP): atrial natriuretic peptide (ANP) originates in the atrium, type B natriuretic peptide (BNP) in the ventricles and type C in endothelial and renal epithelial cells. BNP has emerged as the marker of choice for distinguishing a cardiac or respiratory cause of dyspnoea. When ventricular diastolic BP increases (e.g. heart failure), BNP is released and serves to increase natriuresis.
CHEST X-RAY
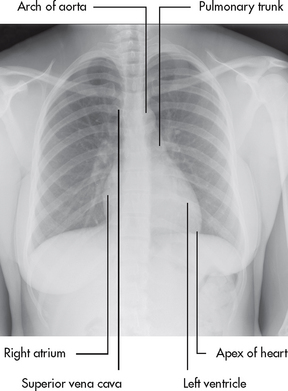
A radiographic picture can depict cardiac contours, heart size and configuration, and anatomical changes in individual chambers (see Fig 31-12). The radiographic image records any displacement or enlargement of the heart, the presence of extra fluid around the heart (pericardial effusion) and pulmonary congestion.
ELECTROCARDIOGRAM
The basic P, QRS and T waveforms (see Table 31-1) are used to assess cardiac function. Deviations from normal sinus rhythm can indicate abnormalities in heart function. There are many types of ECG monitoring, including resting ECG, ambulatory monitoring and exercise or stress testing.12 A resting ECG helps identify at one point in time primary conduction abnormalities, cardiac arrhythmias, cardiac hypertrophy, pericarditis, myocardial ischaemia, the site and extent of MI, pacemaker performance and the effectiveness of drug therapy. It is also used to monitor recovery from an MI.
Ambulatory electrocardiogram monitoring
Continuous ambulatory ECG can provide diagnostic information over a greater period of time than a standard resting ECG. In Holter monitoring a recorder is worn by the patient for 24–48 hours and the resulting ECG information is then stored until it is played back for printing and evaluation. While the patient performs usual activities, Holter monitoring gives them freedom to perform those activities that are associated with the cardiovascular symptoms. The patient maintains a record of activities, symptoms and sleep, and this record is correlated with the ECG events recorded by the device (see Table 31-7).
Transtelephonic event recorders
This type of recorder is helpful for monitoring less frequent ECG events. The monitor is a portable unit that uses electrodes to transmit a limited ECG over the telephone to a receiving device. A disadvantage of this type of monitoring is that if the event occurs for only a short duration, the symptoms may be over before the patient puts on the device and calls the assigned number. Likewise, if patients are extremely symptomatic (e.g. syncopal), they may not be physically able to transmit the ECG.
Exercise or stress testing
Cardiac symptoms frequently occur only with activity. Exercise testing is a method used to evaluate the cardiovascular response to physical stress. This is helpful in assessing cardiovascular disease and is part of the risk screening for discharging patients following chest pain without conducting an invasive coronary angiogram and also defining limits for exercise programs. Patient selection for exercise testing is appropriate for individuals who do not have limitations related to walking or using a bicycle and those without abnormal ECGs that limit diagnostic interpretation (e.g. pacemakers, left bundle branch block). β-adrenergic blockers may be withheld 24 hours before the test as they will blunt the heart rate and not allow the patient to achieve maximal heart rate. The patient should be instructed to refrain from eating, drinking caffeine-containing drinks, smoking or participating in strenuous exercise for 3 hours prior to the test.
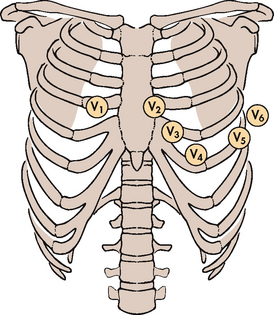
The placement of electrodes is similar to a regular 12-lead placement for chest leads V1 to V6 (see Fig 31-13). Limb leads are placed on upper and lower chest walls to alleviate muscle interference during exercise.
Resting BP and ECGs are performed in the supine position, while standing and after hyperventilation to provide a baseline for comparison of any changes during exercise.
As the patient exercises on a treadmill or stationary bicycle, the BP, ECG and often the O2 saturation level are measured and monitored. The patient exercises to either peak HR (calculated by subtracting the person’s age from 220) or to peak exercise tolerance, at which time the test is terminated and the treadmill is slowed while the patient continues walking. The test is also terminated for moderate-to-severe chest discomfort or significant ST segment depression indicating ischaemic changes associated with CAD. After the treadmill belt is stopped, the patient lies down to rest. The ECG is monitored after exercise for rhythm disturbances or, if ECG changes occurred with exercise, for return to baseline.
6-minute walk test
A 6-minute walk test may be used for patients with heart or peripheral arterial disease to measure response to and determine functional capacity for daily physical activities. (It is also used in pulmonary assessment.) The total distance that a patient can quickly walk on a flat surface in the 6-minute time interval is measured. This test is useful in patients who are unable to perform a treadmill or bicycle exercise test. A decrease in O2 saturation recorded using this test may be used as a criterion to prescribe domiciliary O2 therapy for patients with heart failure.
Echocardiogram
The echocardiogram uses ultrasound waves to record the movement of the structures of the heart. In the normal heart, ultrasonic sound waves directed at the heart are reflected back in typical configurations (see Fig 31-14). The echocardiogram provides information about abnormalities of: (1) valvular structure and motion; (2) cardiac chamber size and contents; (3) ventricular muscle and septal motion and thickness; (4) the pericardial sac; and (5) the ascending aorta. The ejection fraction (EF) or the percentage of end-diastolic blood volume that is ejected during systole can also be measured. The EF provides information about the function of the left ventricle during systole.
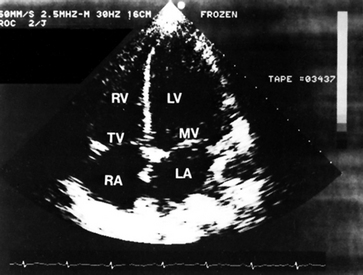
Figure 31-14 Apical four-chamber, two-dimensional echocardiographic view in a normal patient. LA, left atrium; LV, left ventricle; MV, mitral valve; RA, right atrium; RV, right ventricle; TV, tricuspid valve.
Two commonly used types are the M-mode (motion-mode) echocardiogram and the two-dimensional (2D, real-time, cross-sectional) echocardiogram. In the M-mode, a single ultrasound beam is directed towards the heart, recording the motion of the intracardiac structures, as well as detecting wall thickness and chamber size. The 2D echocardiogram sweeps the ultrasound beam through an arc, producing a cross-sectional view and shows correct spatial relationships among the structures.
Doppler technology and colour-flow imaging enhance echocardiogram studies. Doppler technology allows for sound evaluation of the flow or motion of the scanned object (heart valves, ventricular walls, blood flow). Colour-flow imaging (duplex) is a combination of 2D echocardiography and Doppler technology. It uses colour changes to demonstrate the velocity and direction of blood flow. Pathological conditions, such as valvular leaks and congenital defects, can be diagnosed more effectively.
Stress echocardiography, a combination of treadmill test and ultrasound images, evaluates segmental wall motion abnormalities.13 By using a digital computer system to compare images before and after exercise, wall motion and segmental function can be clearly seen. This diagnostic test provides the information of an exercise stress test with the information gained from an echocardiogram. For those individuals unable to exercise, infusion of dobutamine or dipyridamole causes a pharmacological stress on the heart while the patient is resting. The same ultrasound technology is used.
Transoesophageal echocardiography (TOE) is used to provide more precise echocardiography of the heart than surface 2D echocardiography by eliminating interference from the chest wall and lungs. TOE uses a modified, flexible endoscope probe with an ultrasound transducer in the tip for imaging of the heart and great vessels. The probe is introduced into the oesophagus to the level of the heart, and M-mode, 2D, pulsed Doppler and colour-flow imaging can be obtained.
TOE is used frequently in an outpatient setting. In addition, TOE has application in the operating room to assess presurgical and postsurgical cardiac function.
The risks of TOE are minimal. However, complications may include perforation of the oesophagus, haemorrhage, arrhythmias, vasovagal reactions and transient hypoxaemia. TOE is contraindicated if the patient has a history of oesophageal disorders, dysphagia or radiation therapy to the chest wall.
Contrast echocardiography uses intravenous (IV) contrast agents (e.g. albumin microbubbles agitated saline) to assist in delineation of the images, especially in technically difficult patients. When these agents are injected into the cardiac blood pool, they greatly enhance reflectivity for the ultrasound procedure.
Real-time three-dimensional (3D) ultrasound is a new technology that uses multiple 2D echo images with computer technology to provide a reconstruction of the heart. This technique generates precise information about the structures of the heart and how these structures change during the cardiac cycle. It is useful for the detection of congenital heart defects and endocarditis as well as for the calculation of ventricular volumes.
NUCLEAR CARDIOLOGY
One of the most common nuclear imaging tests is the multiple-gated acquisition (MUGA) scan or cardiac blood pool scan. This test provides information on wall motion during systole and diastole, cardiac valves and EF.14 A small amount of the patient’s blood is removed, mixed with a radioactive isotope (e.g. technetium–sestamibi) and reinjected. Using the ECG for timing, images are acquired during the cardiac cycle.
Single photon emission computed tomography (SPECT) is used for the evaluation of the myocardium at risk of infarction and to determine infarction size. Small amounts of radioactive isotope are injected intravenously and recordings are made of the radioactivity emitted over a specific area of the body. The total radiation exposure is minimal. The circulation of this tagged material can be used to detect coronary artery blood flow, intracardiac shunts, the motion of ventricles and the size of the heart chambers. The most commonly used nuclear imaging tests include sestamibi scanning and blood pool imaging. Positron emission tomography (PET) scanning uses two isotopes (see Table 31-7). PET scans are highly sensitive in distinguishing between viable and non-viable myocardial tissue. Cost and availability limit the widespread use of PET scanning.14,15
Perfusion imaging is also used with exercise testing to determine whether the coronary blood flow changes with increased activity. Stress exercising imaging may show an abnormality even when a resting image is normal. This procedure is indicated to diagnose CAD, determine the prognosis in already diagnosed coronary disease, assess the physiological significance of a known coronary lesion and assess the effectiveness of various therapeutic modalities, such as bypass surgery or angioplasty.
Stress perfusion imaging is always preferred but if a patient is unable to tolerate exercise, an IV infusion of dipyridamole or adenosine may be given to dilate the coronary arteries and therefore simulate the effect of exercise. After the vasodilator takes effect, the isotope is injected and the procedure proceeds. The patient is required to lie flat for 40 minutes while the pictures are taken. All caffeine and theophylline products must be withheld 12 hours before the study as they counteract the vasodilator effects of the stress agents. Calcium channel blockers and β-adrenergic blockers should be withheld 24 hours before the test. Patients may be given aminophylline either prophylactically at the end of the test or in response to symptoms as it is a specific blocker to vasodilator stress agents. The protocol for its use is similar for the vasodilator stress agents and adverse side effects are rare.
MAGNETIC RESONANCE IMAGING
Although not widely used because of equipment size and access, magnetic resonance imaging (MRI) allows detection and localisation of areas of MI in a 3D view. It is sensitive enough to gauge even small MIs not apparent with SPECT imaging and can assist in the final diagnosis of MI. It is also beginning to play a role in the prediction of viability and recovery from MI. Its utility for diagnosing the presence and severity of CAD is still being studied.
Magnetic resonance angiography (MRA) is used for imaging vascular occlusive disease and abdominal aortic aneurysms. The contrast material is non-iodine based and is injected through an IV line. The MRA images compare favourably to duplex ultrasound of arterial stenosis.14
COMPUTED TOMOGRAPHY
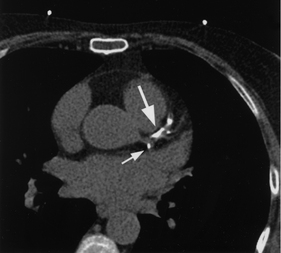
Computed tomography (CT) with spiral technology is a non-invasive scan used to quantify calcium deposits in coronary arteries (see Fig 31-15). It has been limited by the difficulty of imaging the constantly moving heart and the need for patients to hold their breath for each set of image acquisitions.16 Electron beam computed tomography (EBCT), also known as ultrafast CT, uses a scanning electron beam to allow quantification of calcification in the coronary arteries and the heart valves. A calcium score can be formulated for a segment of a coronary artery, a specific coronary artery or the entire coronary system. Several studies have shown EBCT coronary calcium scores are predictive of cardiac events. The test is rapid and may have clinical applications for screening patients with and without symptoms of cardiac disease.
CARDIAC CATHETERISATION AND CORONARY ANGIOGRAPHY
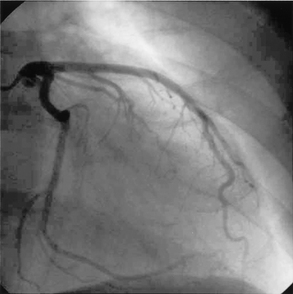
Cardiac catheterisation is a common outpatient procedure. It provides a means of obtaining information about CAD, congenital heart disease, valvular heart disease and ventricular function. Cardiac catheterisation can be used to measure intracardiac pressures and O2 levels in various parts of the heart, as well as CO and EF. With injection of contrast media and fluoroscopy, the coronary arteries can be visualised (see Fig 31-16), chambers of the heart can be outlined and wall motion can be observed.
Cardiac catheterisation is performed by insertion of a radio-opaque catheter into the right or left side of the heart. For the right side of the heart, a catheter is inserted through an arm vein (basilic or cephalic) or a leg vein (femoral). The catheter is advanced into the vena cava, the right atrium and the right ventricle. The catheter is further inserted into the pulmonary artery and pressures are recorded. The catheter is then advanced until it is wedged or lodged in position. This position is called the pulmonary artery wedge position (wedge pressure). It obstructs the flow and pressure from the right side of the heart and enables assessment through the pulmonary capillary bed to the pressure in the left side of the heart. The wedge pressure is used to determine the function of the left side of the heart.
The left heart catheterisation is performed by insertion of a catheter into a femoral or brachial artery. The catheter is passed in a retrograde manner up the aorta, across the aortic valve and into the left ventricle. Coronary angiography can be done with a left heart catheterisation.
Patients frequently feel a temporary hot and flushed sensation with contrast media injection. (See Table 31-7 for the nursing responsibilities related to cardiac catheterisation.)
Complications of cardiac catheterisation include looping, kinking or breaking off of the catheter; blood loss; allergic reaction to the contrast media; infection; thrombus formation; air or blood embolism; arrhythmias; MI; stroke; puncture of the ventricles, cardiac septum or lung tissue; and, rarely, death.17
INTRACORONARY ULTRASOUND
Intracoronary ultrasound (ICUS), also known as intravascular ultrasound (IVUS), is an invasive procedure performed in the catheterisation laboratory in conjunction with coronary angiography. The 2D or 3D ultrasound images provide a cross-sectional view of the arterial walls of the coronary arteries. In this procedure, a miniature transducer attached to a small catheter is introduced through a peripheral artery and advanced to the artery to be studied. Once in the artery, ultrasound images are obtained. The health of the arterial layers is assessed, as is the composition, location and thickness of any plaque. ICUS is currently used to diagnose the severity of CAD. It may also evaluate the vessel response to treatments such as stent placement as well as any complications that may have occurred during the procedure. Because the patient will most often have ICUS in addition to angiography or a coronary intervention, nursing care of the patient following ICUS is similar to that following cardiac catheterisation.
ELECTROPHYSIOLOGICAL STUDY
An electrophysiological study (EPS) is the direct study and manipulation of the electrical activity of the heart using electrodes placed inside the cardiac chambers. It provides information on SA node function, AV node conduction and ventricular conduction. It is particularly helpful in diagnosing the source of arrhythmias. Patients with a history of symptomatic supraventricular or ventricular tachycardias may be at risk of sudden cardiac death. Information obtained during an EPS can assist in making an accurate diagnosis and guiding appropriate treatment decisions.7,8
Catheters are inserted in a similar method as for right and left heart catheterisation. These catheters are placed at specific anatomical sites within the heart to record electrical activity. Nursing care for patients after EPS includes close ECG monitoring, puncture site assessment, vital signs and other responsibilities related to care after cardiac catheterisation.
BLOOD FLOW AND PRESSURE MEASUREMENTS
Peripheral vessel blood flow
Duplex imaging is useful in the diagnosis of occlusive disease in the peripheral blood vessels and for the diagnosis of thrombophlebitis. Peripheral vessel blood flow can be assessed by injection of contrast media into the appropriate arteries or veins (arteriography and venography). With these tests, arterial occlusions and venous abnormalities can be located.
Haemodynamic monitoring
Bedside haemodynamic monitoring of pressures of the cardiovascular system is frequently used to assess cardiovascular status. Invasive haemodynamic monitoring using intra-arterial and pulmonary artery catheters can be used to monitor arterial BP, intracardiac pressures and CO (Ch 65). The central venous pressure (CVP) is a measurement of preload and can be used to monitor the pressure in the right atrium. See Chapter 65 for a complete discussion of haemodynamic monitoring.
1. A patient with a tricuspid valve disorder will have impaired blood flow between the:
2. A patient with a myocardial infarction of the anterior wall of the left ventricle most likely has an occlusion of the:
3. If the Purkinje system is damaged, conduction of the electrical impulse is impaired through the:
4. Prolonged pressure on the skin causes reddened areas at the point of contact due to:
5. When a person’s blood pressure rises, the homeostatic mechanism to compensate for an elevation involves stimulation of:
6. When checking the capillary filling time of a patient, the colour returns in 10 seconds. The nurse recognises this finding as indicative of:
7. The auscultatory area in the left midclavicular line at the level of the fifth intercostal space is the:
8. When assessing the patient, the nurse notes a palpable praecordial thrill. This finding may be caused by:
9. When assessing the cardiovascular system of a 79-year-old patient, the nurse expects to find:
10. An important nursing responsibility for a patient having an invasive cardiovascular diagnostic study is:
1 Craft J, Gordon C, Tiziani A. Understanding pathophysiology. Sydney: Elsevier, 2011.
2 Woods SL, Froelicher ES, Motzer S, et al. Cardiac nursing, 6th edn. Philadelphia: Lippincott Williams & Wilkins, 2009.
3 Libby P, Bonow R, Zipes DP, Mann L. Braunwald’s heart disease: a textbook of cardiovascular medicine, 8th edn. Philadelphia: Elsevier, 2008.
4 Australian Institute of Health & Welfare. Australia’s health. Canberra: AIHW; 2008. Available at www.aihw.gov.au/publications/index.cfm/title/10585 accessed 13 November 2010.
5 Linton AD, Lach H. Matteson & McConnell’s gerontological nursing: concepts and practice, 3rd edn. Philadelphia: Saunders, 2007.
6 Chida Y, Steptoe A. The association of anger and hostility with future coronary heart disease. J Am Coll Cardiol. 2009;53:936–946.
7 Reichlin T, Hochholzer W, Bassetti S, et al. Early diagnosis of myocardial infarction with sensitive cardiac troponin assays. N Engl J Med. 2009;361:858–867.
8 Acute Coronary Syndrome Guidelines Working Group, National Heart Foundation of Australia, Cardiac Society of Australia and New Zealand. NHFA and CS guidelines for the management of acute coronary syndromes. Summary of key recommendations. MJA. 2006;184(8 suppl):S1–S32.
9 Hopkins PN, Nanjee MN, Wu LL, et al. Altered composition of triglyceride-rich lipoproteins and coronary artery disease in a large case-control study. Atherosclerosis. 2009;207(2):559–566.
10 Pejic RN, Lee DT. Hypertriglyceridemia. J Am Board Fam Med. 2006;19(3):310–316.
11 American Heart Association. Inflammation, heart disease and stroke: the role of C-reactive protein. Available at www.americanheart.org/presenter.jhtml?identifier=4648, 2008. accessed 21 March 2011.
12 Bhatia VK, Ramzy IS, et al. Stress echocardiography provides early, safe and accurate risk stratification of patients with acute chest pain, non-diagnostic ECG and a normal 12h troponin. Heart. 2009;95:67.
13 Sicari R, Nihoyannopoulos P, Enangelista A, et al. Stress echocardiography expert consensus statement: executive summary. Eur Heart J. 2009;30(3):278–289.
14 Cerqueira MD. Diagnosis and prognosis of coronary artery disease: PET is superior to SPECT: con. J Nucl Cardiol. 2010;17(4):678–682.
15 Heller GV, Calnon D, Dorbala S. Recent advances in cardiac PET and PET/CT myocardial perfusion imaging. J Nucl Cardiol. 2009;16(6):962–969.
16 Sakuma H, Ichikawa Y, Chino S, et al. Detection of coronary artery stenosis with whole-heart coronary magnetic resonance angiography. J Am Coll Cardiol. 2006;48:1946–1950.
17 Applegate RJ, Sacrinty MT, Kutcher MA, et al. Trends in vascular complications after diagnostic cardiac catheterisation and PCI via the femoral artery, 1998–2007. J Am Coll Cardiol. 2008;1:317–326.

