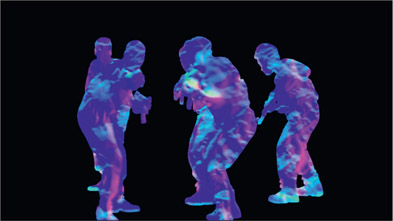
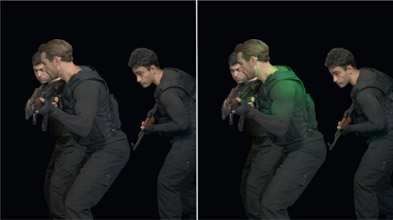
When I started in visual effects way back in 1985 at Robert Abel and Associates there was film and video. Period. Times and technology have changed to where we can get digital images from a wide variety of sources, each with its own virtues and limitations. In this chapter we will look at the entire zoo of digital images that may land on your monitor for a visual effect, what their specifications are, and their issues when working with them.
There is an entire section on Digital Cinema Images as these cameras have nearly finished replacing film as the capture media for movies. We will see how the Bayer array is used to capture RGB images and that what you see is not what you get as far as resolution is concerned, especially if there was a sensor crop. After a quick peak at High Frame Rate production we will see what goes into the DCI (Digital Cinema Initiative) that specifies how to deliver shots for digital theater projection. As of this writing over 98% of North American theaters use digital projectors and Europe is close behind, with the Asian market pedaling as fast as they can to catch up.
While film is nearly gone for theatrical projection it still plays a significant role in principal photography for movies. This means that many movies are captured on film then digitized for the entire post-production pipeline. This means you can get film scans for your effects shots so you need to be prepared for the odd composition, myriad of film formats and aspect ratios, and of course, grain. Lots of grain.
Saving the best for last, the final section of this chapter is a sneak preview of light field cinematography, an astonishing new technology being developed for shooting movies. light field cinematography captures vastly more data about the scene, which in turn is used to add utterly new capabilities to visual effects production. Not to spoil the fun of discovery in this section, let me just leave you with this tantalizing notion – deep images from live action clips.
A great deal of visual effects for episodic TV and commercials are done in HD video so understanding its issues will help with your compositing challenges for HD. There is a discussion of the various HD image formats, including anamorphic video and the scan modes. Interlaced video is supported in HD, which adds several issues for vfx work which are discussed along with tips and workarounds. Since almost all HD video uses color sub-sampling there is an explanation of what this is and how it damages any effort to pull keys. Film is still transferred to HD using a telecine, so that process is discussed along with workflows for removing the 3:3 pulldown that you will likely encounter.
WWW Std Def Video.pdf – this pdf file contains the Standard Definition Video information that appeared in this book up to the 3rd edition but has been dropped from this edition due to its obsolescence.
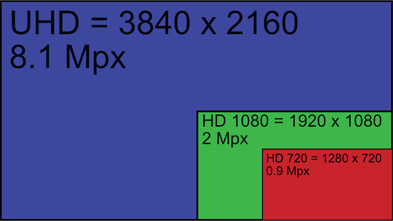
Figure 15.1
HD frame formats
While image size, frame rates, and scan modes can vary, the two constants with HD video are the square pixels and the aspect ratio of all HD formats – 16 × 9. Video folks like their aspect ratios in integers (16 × 9, 4 × 3, etc.) while film folks like a floating point designation (2.35, 1.85, etc.) So for film folks the HD aspect ratio is (16 ÷ 9 =) 1.777777…. or 1.78 when rounded off. There are two image sizes of HD video – 1920 × 1080 and 1280 × 720. In HD slang they are referred to as “1080” and “720”. The 1080 format has 2,073,600 pixels (2MP) per frame while 720 has 921,600 (0.9MP) – a bit less than half the pixels per frame. HD video files can have either 8 or 10 bit images. This can be confusing if you get a 10-bit DPX file to work with because there is a 10-bit rec709 format (video) and a 10-bit log format (Cineon). If it is a log file you can tell because it will appear fogged up and low contrast whereas the rec709 video file will look normal. Note that for HD and DCI the correct gamma is 2.4, whereas with earlier video it was 2.2.
UHD – Ultra High Definition TV, sometimes incorrectly referred to as 4k HD, is essentially four HD frames arranged 2 × 2 so its image size is a whopping 3840 × 2160 (8.1MP). While it is close to 4k resolution (4096) it is not really 4k. There is not much content being produced in UHD yet but that will change soon. Some producers are making UHD content to “future proof” their product for when UHD becomes dominant. 4k cameras and 4k displays are a lot easier to make than 4k signal transmission, so getting the picture to the home is the current bottleneck. But that is only a matter of time. In the meantime, when HD content is played on a UHD TV the internal circuitry does a 2:1 upres (up resolution) in real-time, along with a bit of image sharpening and even some frame rate interpolation to take 24fps content to 60 or even 120fps. The Ultra HD Blu-ray discs can deliver 60fps UHD data rates so you might get a 60fps UHD project to work on one day.
It was firmly stated that one of the constants of HD is the 16 × 9 image aspect ratio, but here we have some anamorphic video (squeezed horizontally), so what’s going on? What’s going on is that the fixed HD aspect ratio is the specification for broadcast. Within the production pipeline – the camera, recording, editorial, and special effects – you can have anything you want as long as the final deliverable is 16 × 9.
Knowing this, some camera manufacturers reduce the cost (cheapen) their cameras by using smaller/cheaper image sensors that are only 1440 × 1080 (Figure 15.2) with an aspect ratio of 4 × 3 to produce their image. So here’s the gotcha – the metadata with these images will identify them as anamorphic so the editing system will quietly stretch them out to 1920 × 1080 (Figure 15.3) for the editor. However, when you get the shot your software may or may not interpret the metadata, so it could present you with a 1440 × 1080 squeezed image to work with. Surprise!
Ideally your software is smart and reads the metadata to display it correctly like the example in Figure 15.3. This is best because all of your image-processing ops will be “squeezed” to match the pixel aspect ratio of the original anamorphic image with the results only stretched at the monitor for proper viewing. You can confirm your software’s anamorphic understanding by going to the image inspection information and checking that the pixel aspect ratio is 0.75 instead of the usual 1.0.
However, if your software does not understand anamorphic images then you will be staring at the squeezed image in Figure 15.2. The workflow is first to stretch it to 1920 × 1080, do your business, then write it out as 1920 × 1080. The image will take a bit of a softening hit horizontally, of course, so if that is objectionable a gentle sharpening operation could be applied in the horizontal direction only. If it is required to deliver the finished comp as anamorphic then simply resize the finished comp back to 1440 × 1080 and do not do any sharpening. Squeezing it back will restore the original sharpness. Keep in mind that because it is anamorphic and will be stretched on playback it is naturally soft horizontally anyway. There is a complete discussion about working with anamorphic images in the film section of this chapter at Section 15.3.5.5 Working with Cscope.
HD standards support two different scan modes: progressive and interlaced. Progressive scan works as you might expect by starting at the top of the frame then scanning each line in progressively to the bottom of the screen. Most of the time this works great, but if the camera has a progressive shutter instead of a global shutter then the clip may have a rolling shutter artifact, which was covered in detail in Chapter 11: Camera Effects.
WWW Progressive scan.mov – this is a little animation video that illustrates how progressive video scan works.

Figure 15.4
Even and odd scan lines of field 1 and field 2 combine to make one video frame
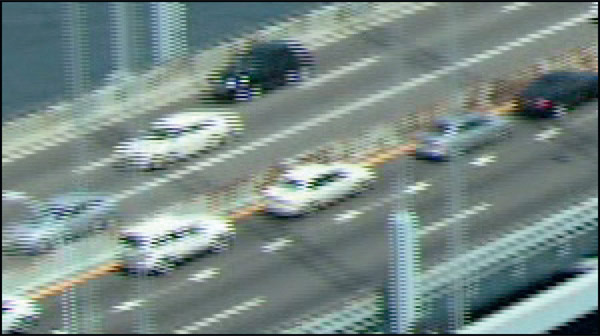
The HD video can also be interlaced, which is ever so much fun. Referring to Figure 15.4, the interlace scan starts at the top and scans towards the bottom of the frame, skipping every other scan line (field 1). Then, starting back at the first skipped scan line, it then scans every other scan line (field 2). When displayed on an interlaced display like a TV set it looks great. It looks less great on your workstation monitor, which is a progressive scan display like the example in Figure 15.5.
WWW Interlace scan.mov – this is a little animation video that illustrates how interlaced video scan works.
If interlaced is so icky then why do they do it? Historically, it was used for all television broadcasting to cut down on the bandwidth required to send the picture. Sending two fields sequentially 60 times per second rather than one full frame 30 times a second smoothed out the motion to the eye and reduced flicker. Regardless of the scan mode of the project in production, at broadcast time it is still transmitted as interlaced to accommodate fast action like a Nascar race. This is not a problem because an interlaced signal can carry both interlaced and progressive scan shows. However: no visual effects shot should ever be shot with interlaced video. For that very reason you are sure to get one so you will need to know how to cope with interlaced video.
There are really two cases of interlaced video – video shot with an interlaced scan, and film transferred to video with a 3:2 pulldown. This section deals with the interlaced scan video and the 3:2 pulldown case is covered in Section 15.1.10: Telecine.
When you have to work with interlaced video there are a number of issues that you will want to be aware of. The first thing to realize is that the two fields are in fact snapshots of the scene at two different moments in time. You can really see that in Figure 15.5 as the camera and cars have moved between the two fields so they are offset horizontally. The problem here is that the amount of offset will depend on the relative speed of each object. From the camera move, objects near the camera will be offset more than objects further from the camera. From the intrinsic motion of the cars, their field offsets will depend on their speed and direction. What this all means is that it is a non-trivial problem to integrate the two interlace fields into a single frame. Non-trivial, but not impossible. More on this later.
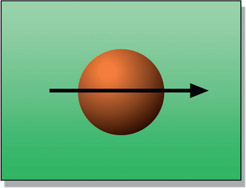
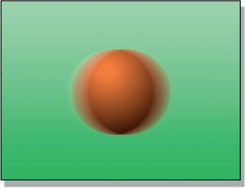
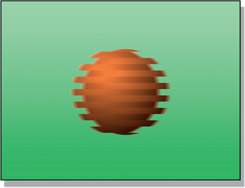
The next thing to look at is the effect of the interlace scan on motion. Starting with horizontal motion in Figure 15.6. The motion blur with a progressive scan or film is shown in Figure 15.7, which looks familiar and reasonable. That same motion with an interlaced scan would look like Figure 15.8, which looks strange and unreasonable.
WWW Interlace horz motion.mov – this is a little animation video that illustrates how interlaced video messes with horizontal motion.
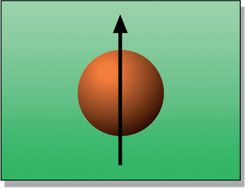
Figure 15.9
Object moving vertically
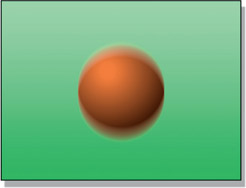
Figure 15.10
Progressive scan vertical motion blur
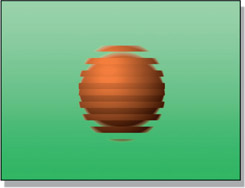
Interlaced vertical motion blur looks even weirder (Figure 15.11). Interlaced video like this cannot be rotoscoped, blurred, rotated, scaled, or any of a number of normal image-processing operations without making a useless mess of the image. It’s a nightmare for keying because the key cannot be processed with a dilate or blur operation. To work with interlaced video seriously it must be de-interlaced.
WWW Interlace vert motion.mov – this is a little animation video that illustrates how interlaced video messes with vertical motion.
De-interlacing video is a non-trivial task and there are two de-interlacing strategies that can be used. They differ in complexity and quality, and of course, the more complex gives the best quality. The nature of the source frames, the requirements of the job, and the capabilities of your software will determine the best approach. The reason for covering both the approaches is to give you more flexibility for coping with an interlaced clip.
This is the simplest, and yet can have surprisingly good quality for certain image content. The idea is to discard one field from each frame of video (field 2, for example), then interpolate the scan lines of the remaining field to fill in the missing scan lines.

Figure 15.12
De-interlacing with simple scan line interpolation
Figure 15.12 illustrates the sequence of operations for simple scan line interpolation. A single field is selected from each video frame (b), then the available scan lines are interpolated to fill in the blanks. The key to success here is which scan line interpolation method is selected. Professional compositing software will offer a choice of interpolation schemes like line duplication (awful) to line averaging (poor), to the impressive Mitchell-Netravali interpolation filter (pretty good) or something similar.
The interpolated scan lines example in Figure 15.12(c) looks particularly awful because simple scan line duplication was used instead of a nice interpolation algorithm to illustrate the degraded image that results (plus the painfully low resolution used for book illustration purposes). Good compositing software offers a choice of scan line interpolation algorithms, so a few tests are in order to determine which looks best with the particular content of the clip. This approach suffers from the simple fact that half of the picture information is thrown away and no amount of clever interpolation can put it back. A well-chosen interpolation can look pretty good, even satisfactory, but it is certainly not as good as the original video frame.
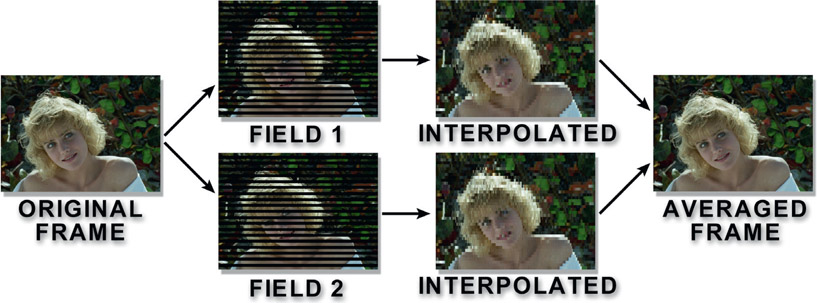
This next method retains more of the original picture quality for slowly moving images, but is a bit more complex. Figure 15.13 illustrates the sequence of operations for field
averaging. Starting at the left, the frame is separated into its two fields. Each field gets the scan line interpolation treatment shown above, making two full interpolated frames of video. These two frames are then averaged together to make the final frame.
While this looks better than the simple scan line interpolation method above it is still not as good as the original frame. Technically, all of the original picture information has been retained, but each field has been interpolated vertically then averaged back together, slightly muddling the original image. Static details will look sharper with this technique and it works well if the action is fairly slow, but fast action can have a “double exposure” look that might be objectionable, like the example in Figure 15.14 illustrating a moderately fast camera pan.
WWW Interlaced Frames – this folder contains 24 frames of the interlaced video illustrated in Figure 15.5 for you to try your de-interlace tools on.
Color subsampling is one of the dirty little secrets of video. It is a fundamental principle of image compression so is used in MPEG-2 and other compression schemes. The basic idea is that the human eye is much more sensitive to luminance (brightness) than it is to chrominance (color). This observation led to the notion of reducing the resolution of the color part of an image but retaining the luminance at full resolution as a way to compress the file size without noticeably degrading the visible image quality. Note the evasive words “visible image quality” because, as we shall see shortly, this type of compression is bad for keying.
What all video cameras do is take the RGB data from the imaging sensor and transcode it to YCbCr which remaps the RGB data to put the luminance in the Y channel at full resolution but the color in the two CbCr channels at half resolution – or less. The term “color subsampling” refers to this lower resolution of the CbCr color channels. Figure 15.15 illustrates an image being converted from RGB to YCbCr. So what do the Cb and Cr channels actually contain? The Cb channel carries the yellow/purple colors with their saturation information, while the Cr channel does the green/orange and their saturation. Next we will see how much subsampling is actually done.
OK, here we go – the story of how much color they can squeeze out of the picture. The reason you care about this is while the loss of the color information may not offend your eye, it will definitely offend your keyer. Keyers use this color information to calculate their keys and that is exactly the information that is squeezed out of the video. The problem is that the heavily subsampled formats still make a nice picture on the monitor, so amateurs that don’t know what they’re doing assume they are fine for keying and visual effects when they are not.
The YCbCr subsample numbering schemes are based on a block of 4 pixels. The first number, 4, means that there are 4 samples of Y (luminance) in those 4 pixels. The next two numbers are the Cb and Cr sampling rates, so 4:2:2 means 4 luminance samples with 2 for Cb and 2 for Cr. The various color-subsampling schemes are illustrated and graded for keying in Figure 15.16.
This being a book on compositing it is time for a few words on the effect of color sub-sampling on keying. The low color resolution of 4:2:2 video (not to mention 4:1:1 or 4:2:0) can cause serious problems when trying to pull a key. This section describes a nifty little preprocessing technique to sweeten the greenscreen for the keyer to help you pull better mattes from subsampled video.
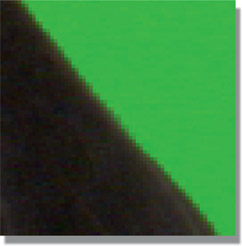
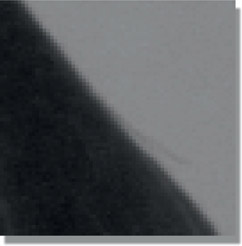
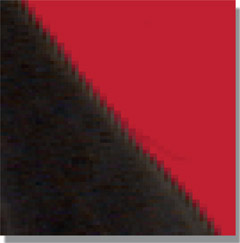
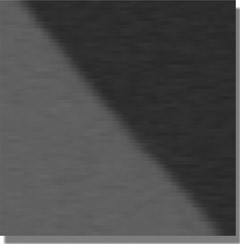
As we saw above, the 4:2:2 YCbCr format of video retains full resolution for luminance but only has half resolution for chrominance. When the YCbCr frame is converted to RGB for compositing, the RGB version inherits this deficiency in color detail. Figure 15.17 shows a close-up an RGB greenscreen edge produced by a 4:2:2 file. Figure 15.18 shows the Y channel that contains the full resolution luminance information while Figure 15.19 shows the half resolution Cb and Cr channels containing the chrominance information. Notice the chunky data steps.
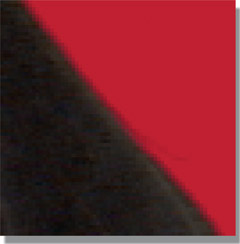
Using the greenscreen in Figure 15.17 for a composite over a red background we get the hideous results shown in Figure 15.20. In fact, the composite looks much worse than the original greenscreen because the keying process hardens edges (remember?). The fix is to apply a filter (blur) to just the CbCr channels before pulling the key. The filtered CbCr channels are shown in Figure 15.21 and the stunning improvement is shown in Figure 15.22.
The sequence of operation is shown in the flowgraph in Figure 15.23. The RGB green-screen is first converted to a YCbCr image, then only the CbCr channels are filtered. They are blurred by 2 pixels horizontally and not at all vertically. The loss of CbCr resolution is in the horizontal direction only and we do not want to blur them any more than is absolutely necessary. The filtered YCbCr image is then converted back to RGB to pull the key and do the comp.
Of course, this slick trick comes at a price. While the blur operation is gracefully smoothing out the edges of our comp it is simultaneously destroying fine edge detail. It must be done by the smallest amount possible to improve the overall composite. It’s all about balancing the tradeoffs.
WWW CbCr smoothing.png – here is a lovely 4:1:1 video frame for you to try the CbCr smoothing technique outlined above. Compare a key from the original to your filtered one.
HDTV supports a wide range of frame rates with several that are kept around for downward compatibility with the old NTSC and PAL standards.
24fps is, of course, the standard frame rate for film. There is an HD standard that is exactly 24fps to maintain exact frame-to-frame compatibility with film. No more 3:2 pull-down for movies required. 25fps is the PAL frame rate and the sensible Europeans kept it exact. The 30fps rate is for standard broadcast needs and the 60fps rate is for fast-action sports programming. One problem when working with video is that when someone says “30fps” they may not actually mean 30 frames per second. The true frame rates are often rounded off to the nearest integer, which creates ambiguity and confusion that in turn requires the annoying next paragraph.
29.97 – Early black-and-white television was clocked using the 110v 60-cycle house current to the home so the TV frame rate was 30fps, one half the 60 cycles. Europe had 220v 50-cycle power so their early TV was 25fps. When color TV came out the color signal was piggy-backed on top of the black and white signal in order to maintain downward compatibility with the black and white TVs of the day. But a destructive harmonic “beating” with the audio signal was discovered that had to be fixed. The fix was to simply “detune” the circuitry a tiny bit from the original 30fps to 29.97. This was a change of only 0.1%, which was well within the TV circuit’s 1% signal tolerance so it seemed like a good idea at the time.
23.98 – When we need to put film to video, somehow the 24fps of film must be mapped to the 29.97fps of video. To pull off this minor miracle the film must also be slowed by 0.1% to match the video signal, which takes the 24fps down to 23.98.
59.94 – As we have seen, ancient video actually ran at 29.97fps. But ancient video is actually made up of two interlaced fields, so the field rate is twice the 29.97 frame rate, or 59.94.
Professional video standards have a continuously running timecode embedded with the video images on a separate track in the format hours: minutes: seconds: frames. One problem you may have is that while your version of the video is digitized frames on disk that are numbered from one to whatever, the client will constantly be referring to the timecode.
It is possible to make a list of the timecode that was digitized as frame one of a shot, then do some messy math to figure out what frame they are talking about, but a better approach is to ask to be also given a “window burn” of the shot. The window burn is a video-tape dub that has the video timecode printed (burned) into the picture of each frame and it looks something like this:
03:17:04:00* typical video timecode
This reads as “hour 3, minute 17, second 04, frame 00” (yes, they number their frames from 0 to 29). There will also be a little “tik mark” (shown here as an asterisk) that varies from manufacturer to manufacturer to mark field one vs. field two.
A video clip can be delivered in one of several video file formats such as QuickTime Movie (.mov) or Windows Media Video (.wmv) rather than sequential images. This is a tidier package than the sequential images and solves the timecode problem of trying to map the client’s timecode to your sequential frames, but it introduces three exciting new problems that the sequential frames don’t have – gamma changes and codecs.
The gamma problem is that the video file formats (not naming names here) are “smart” and want to “help” you so they make assumptions about the gamma of your system, which may or may not be correct. You may read in a video file that looks fine on your monitor, but if you simply write it out to a new video file then import the new file back in the gamma may have shifted compared to the original! Or you have some lovely clip that you read in as sequential frames then rendered to disk as a video file, only to find that when you play it back the gamma is different than your original frames. The rules here are complex and nobody actually knows what they are anyway, so my advice is to do test renders and check that the output matches the input. If it doesn’t, make some wild guesses as to what settings to change and try it again. And again.
Codec is short for “coder-decoder’ which encodes and decodes the video stream and usually includes some kind of compression as well. The codec problem has two manifestations. One is that your machine might not have the codec that was used to encode the video so your system simply can’t play it. Game over. The second manifestation is that each codec has its own compression scheme that damages the video in some way and you need to figure out what codec is appropriate for whatever you are working on before writing your video to disk. Further, when the nice client hands you a QuickTime movie you will inherit the damaged frames from whatever codec he decided to use. Most of the folks that hand you video to work on do not know what codec was used or what it did to the video quality. My advice is to learn as much as you can about video codecs for your own self-defense and keep in mind that they are being constantly revised.
Contrary to the pronouncement of manufacturers of digital cameras, film is not dead so you may very well get a shot to do that was transferred from film to video in a process called “telecine” (tell-a-sinny).These video frames will be profoundly different than the video frames shot with a video camera. You need to understand how and why, so you can cope.
There is no getting around the fact that film runs at 24 frames per second and video runs at 30 frames per second (technically 29.97 frames per second). One second of film must become one second of video, which means that somehow 24 frames of film have to be “mapped” into 30 frames of video. The technique used to do this has historically been called the 3:2 pull-down. It is a clever pattern that distributes the film frames across a variable number of video fields until everything comes out even.
Seeking the lowest common denominator, we can divide both the 24fps of film and 30fps of video by six, which reduces the problem down to this – four frames of film have to be mapped into five frames of video. The way this is done is to take advantage of the video fields. In the five frames of video there are actually 10 fields, so what we really need to think about is how to distribute the four frames of film across 10 video fields.
The trick to putting a block of four frames of film into 10 video fields is done with the film shutter “pull-down”. When the film is transferred to video the film’s electronic “shutter” is pulled down for each video field (there is no actual shutter – it is just a helpful metaphor for us non-telecine operators). Referring to Figure 15.24, the telecine tradition is to name the block of four film frames A, B, C, and D, so starting with the A frame the shutter is pulled down twice, one for video field 1 and again for video field 2. The B frame, however, gets three shutter pull-downs so it will span three video fields. So far we have two film frames in five video fields. Next, the C frame gets two pull-downs then D gets three. We now have mapped four frames of film to 10 fields, or five frames of video.

Figure 15.24
The 3:2 pull-down pattern for transferring film to video
When working with a video clip that was telecined from 24fps film, the 3:2 pull-down will have to be removed before working with the clip. The reason becomes clear in Figure 15.24 by noting that the video frames are labeled “clean” and “mixed”. Video frames 1, 2 and 5 are clean frames because they have one frame of film in one frame of video. Video frames 3 and 4 are mixed frames because they have mixed two film frames into one video frame so have a different film frame in each field. This is a problem.
Recalling the interlaced video miseries from Section 15.1.4: Working with Interlaced Video above, these mixed frames are in fact interlaced so they suffer from the same image-processing limitations. Before working with a 3:2 pull-down video clip the pull-down must be backed out, restoring the clip to one frame of film in one frame of video. Removing the 3:2 pull-down is sensibly referred to as doing a 3:2 pull-up. Most professional compositing software has both a 3:2 pull-down and a 3:2 pull-up capability. If not, then we have trouble.
The problem that the 3:2 pull-up introduces is that the number of frames in the shot are reduced by 20%, which throws off any video timecode information you may have been given. A little arithmetic can correct the timing information, however, just by multiplying all times by 0.8 for the pull-up version of the shot. A further timing issue is that timecode for video is based on 30 frames per second, and when the shot is pulled up it once again becomes 24 frames per second. As a result, some video timecodes will land in the “cracks” between the film frames making the exact timing ambiguous.
When you go to use the 3:2 pull-up feature in your software the first thing it will want to know is the “cadence”. Referring to Figure 15.24, video frame 1 has film frame “AA” in it while video frame 4 has “CD” in it. The 3:2 pull-up feature needs to know which of these patterns the clip starts with so it can stay in sync over the length of the clip. You will know you have the right cadence when you can step through four sequential frames without seeing any mixed frames.
Watch out for the cadence changing when the video cuts to another scene. If the film was edited together first, then transferred to video continuously (like a movie) then the cadence will be constant. If the film was transferred to video then the video edited (like a commercial) then each scene will have its own cadence. Have fun.
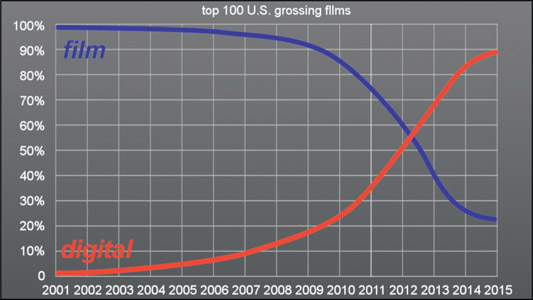
Figure 15.25
Plotting the industry transition to digital capture
In 1999 George Lucas set the filmmaking world on its ear when he used an HD camera for selected scenes in Star Wars: Episode I – The Phantom Menace. Just a few years later, in 2002, he photographed the entire movie Star Wars: Episode II – Attack of the Clones using a Sony F900 HD camera. That did it. If it was good enough for George Lucas it was good enough for everybody, so digital capture was off and running in the movie industry. In 2007 RED shipped its first camera and digital cinema capture really took off. Figure 15.25 tracks the trend since 2001.
While film is far from dead, its demise is being accelerated by a steady stream of ever-improving digital cinema cameras. Digital cinema cameras exceed HD video in every way – dynamic range, image resolution, frame rates, and price tags. Their target is to meet or exceed 35mm film in image quality while offering the many advantages of a digital capture. The main virtue of digital capture images for keying is how noise free they can be. The DP can certainly add a lot of unnecessary noise by using too little light and compensating by raising the gain on the sensor array, which also gains up the noise, but a competent cinematographer can consistently deliver better results than film as least as far a noise is concerned.
Table 15.1
Digital camera resolutions
| Blackmagic |
4000x2160 |
| RED Dragon |
6144x3160 |
| ARRI Alexa |
2880x2160 |
Digital cinema cameras are like video cameras on steroids. While video camera resolution is 1920 × 1080 because that is the rec709 spec, digital cinema cameras go up to 6k resolution – and climbing. Video cameras may have a dynamic range of 6 or 8 stops while the digital cinema cameras go up to 12 stops. Video cameras have a few choices of frame rates to conform to the rec709 specs, while digital cinema cameras can operate at virtually any frame rate.
One of the key advantages of the digital cameras is performance. Some of these cameras claim to have a greater dynamic range than film and almost all of them have greater resolution and less noise. The cross-over point has been reached to where digital cinema cameras outperform film. Looking at the technology trajectory, digital cameras being electronic are improving at a fantastic rate with no end in sight while film, a chemical technology, has far less potential for the range and tempo of improvement.
A second advantage is cost. 35mm film cameras can be cheaper to purchase, but with film you have to purchase rolls of film and pay for lab fees every time you use it. A 90-minute movie shot on 35mm film will have roughly $20,000 in film and lab fees. Today there are several high quality digital cinema cameras where you can purchase the entire camera for $20,000 (lenses not included) and over time the prices will continue to come down and the performance go up. And speaking of lenses, the digital camera manufacturers did something diabolical – they made their camera bodies compatible with standard film lenses – which often cost more than the camera. This made the transition from film to digital even easier.
The third key advantage for digital cameras is workflow. With digital cameras you can immediately view your shots without waiting to get the film back from the lab. But the biggest advantage is the entire digital post-production pipeline. The camera’s output can immediately be dumped into the digital editing system. The color-graded selects can immediately go to the digital visual effects department (that’s us!). The finished edited movie (commercial, or episodic TV show) goes directly to the DI suite for digital color correction, then finally delivered to a digital projector in the theater. Even if a movie is shot on film the first step is to digitize it so it can fit into today’s all-digital post-production pipeline. If you have any doubt as to the ascendancy of digital capture just review the graph in Figure 15.25 showing the percentage of movies shot on film vs. digital capture for the top 100 U.S. grossing films from 2001 to 2015.
For the folks that complain that digital capture does not have that “film look” it should be pointed out that with today’s image-processing capabilities the digital capture can be given any look whatsoever including matching a film stock in color response, softness, grain structure (yes, we even add grain!) and detail. There are even lens simulations out there to match the look of your favorite glass. While film stocks have definite “looks”, their look is baked into the film capture. With a digital capture we can replicate any look, plus there are unlimited vistas of new looks never before imagined and not based on a physical film stock.
I remember a location shoot one time when the DP started to attach a tobacco-colored filter to his lens. I stopped him and explained that cinematography is now a “data capture” operation and I can add a tobacco filter – or any filter – in post. By putting a filter in front of the lens all that he was doing was blocking data that I need for visual effects. He did not appreciate the observation, but he took off the filter.
Virtually all digital cinema cameras achieve the color capture in their imaging sensors using a Bayer array – an array of alternating filters of red, green, and blue (Figure 15.26). Each image sensor pixel gets its own colored square of the filter so the color capture for a 2 × 2 group of pixels will be 2 green pixels, one red and one blue. The reason for this particular balance of colors is because the luminance of an image is made up of roughly 60% green plus 30% red and 10% blue. The Bayer array starts with 50% green, 25% red and 25% blue, which is a close approximation of the luminance sample. Then, in a process called “de-Bayer” or “demosaic”, the pixels are juggled, filtered and blended by creative algorithms to render the actual RGB image from the raw Bayer capture.
We learned of video’s dirty little secret (color sub-sampling), so here is the digital cinema camera’s dirty little secret – when the camera salesman tells you that his camera has a resolution of 6k it is not true. The sensor array may be 6k resolution, but checking Figure 15.26 you can see that 50% of them don’t see any green (the reds and blues) and 75% of them don’t see any red and another 75% don’t see any blue. By creatively massaging the raw camera data they can synthesize the colored RGB image that you work with, but the actual effective optical resolution of the imaging system is really only about 60% of the resolution of the Bayer array. Of course, the output image can be sharpened to make up for the resolution shortfall but we all know where that can lead you if you are not careful.
This is another dirty little secret of digital cameras. They have a feature called “sensor crop” that allows the cinematographer to shoot, for example, a 4k image with a 6k sensor. The dirty little secret is that when the sensor crop is used it also alters the effective focal length of the lens as illustrated in Figure 15.27. In this example the camera had a 50mm lens but after a sensor crop the lens has effectively become an 80mm lens due to the reduced field of view. The problem that this creates for the confused compositor is that you will be told that this scene was shot with a 50mm lens when it was actually shot with an 80mm lens. Assuming that your software preserves the meta-data and allows you to read it you cannot be sure it is telling you the truth about the focal length of the lens – information we need for camera tracking.
The famous director Peter Jackson is enamored of High Frame Rate (HFR) movies so in 2012 he produced The Hobbit: An Unexpected Journey at 48fps. He felt that doubling the information from 24 to 48fps gave the show more reality and “presence”, especially for the stereo 3D version. I was at a special HFR screen of The Hobbit and must agree. However, it also gave the show a sharpness and clarity that reminded many of video – and in movieland video is a dirty word. What I really like about HFR, however, is that it doubles the number of frames requiring visual effects, which is good for me and my people.
The Hobbit was shot with a RED Epic at 5k resolution. Can you imagine the compositor keying a 48fps 5k resolution shot? It could happen to you, so I wanted to touch on this. Besides the gargantuan increase in the size of the database the impact on compositing is the motion blur. An HFR production will have half the shutter time so the motion blur will be cut in half. Then they will ask you to make the 24fps version for theaters that don’t have 48fps projectors, so you will have to increase the motion blur to avoid motion strobing. The cheap and lousy solution is to use frame averaging. Next up from that is a Retimer that uses motion analysis (optical flow) as discussed in Chapter 13, Section 13.6: Retiming Clips.
The Digital Cinema Initiative (DCI) sets the industry specs for movies being delivered for digital cinema projection. The DCI is to movies what rec709 is to video. It sets the resolution for a 2k format at 2048 × 1080, the same height as HD, but a bit wider, resulting in a 1.89 aspect ratio image. 4k is doubled in both dimensions to 4096 × 2160, and there is support for HFR, anamorphic, various compressions schemes, and stereoscopic 3D formats.
Your images will go into the DCP (the Digital Cinema Package), which is 12 bits per channel for images. If your shot is wider than 1.89, such as a 2.35 show, it will be letter-boxed. If it is narrower, such as 1.66, it will be pillar-boxed. Besides your shots, the DCP also contains the sound track and a data stream to control the digital projector.
As a visual effects compositor you must be prepared to work on a job that was captured with a 35mm film camera. Film has a long history and there are a number of arcane issues associated with it pertaining to apertures and aspect ratios that you will not encounter with any digital capture job. Then there is the grain. Lots and lots of grain.
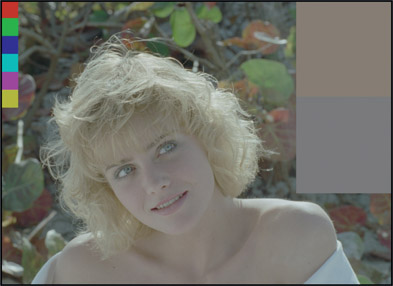
Figure 15.28 shows a film scan that might be delivered to you for keying. The first odd thing is that it is surrounded by a black border and the actual exposed image has rounded corners. It is also a 1.33 aspect ratio. If this shot goes back out to film then you would leave in the black borders. If it is destined for digital projection then it will need to be cropped to the job size and aspect ratio. Most movies you work on will actually go for both.
Normally a film scan will have much more grain than a digital capture. I say “normally” because there are fine-grained film stocks that, if expertly exposed, could actually have less grain than an underexposed, overly-gained digital capture. But for most cases expect more grain in a true film scan.

Figure 15.29
Comparison of film and digital cinema grain structures
Figure 15.29 shows an array of film grains compared to digital cinema grain/noise structures. The samples were taken from a variety of greenscreens then color-graded for a visual match for easier comparison using only simple color channel offset to avoid altering the grain structure. The top row shows a variety of film stocks with medium, fine and coarse grain structures. The bottom row displays a variety of digital cinema cameras. The point here is that across the board the digital cinema cameras have a finer grain/noise structure than film and are therefore a much better choice for keying.

Figure 15.30
The “safe-to” window
A film job will normally be shot and scanned full aperture resulting in more picture than you need for a shot, so you always want to be aware of the “safe-to” window. That means the work needs to be good only out to the safe-to window, but we don’t care about the rest of the frame. You could waste a lot of time doing rotos outside of the safe-to window or fussing over a bad comp edge when you didn’t have to. The work only needs to be good out to the safe-to window, so be sure to ask your comp super.
Film cameras have a metal plate called a “gate” with a rectangular opening that sits just in front of the film that blocks some of the incoming light to define the area of the negative that is to be exposed. The rectangular opening in the gate and the exposed region of the film are both referred to as the camera aperture. When the film is projected the film projector has a similar gate with another rectangular opening called the projection aperture. The projection aperture is slightly smaller than the camera aperture in order to provide a narrow “safety margin” around the edge of the exposed frame in case the projection aperture is not perfectly aligned. Of course, neither of these issues affect digital capture and digital projection. Figure 15.31 illustrates both a camera aperture and a projection aperture to illustrate the basic idea. The holes in the film stock along the edges are used to move the film through the camera and are referred to as “perfs” (perforations), and are a key part of film lore and naming conventions.
The projection aperture, then, is a window within the camera aperture where the action is to stay confined. There are some projection apertures that are a great deal smaller than the camera aperture so it can be ambiguous as to what area of the film you really care about and how to position elements within it. Not surprisingly, it is the camera aperture that is often digitized by film scanners and sent to a film recorder to film out, while the work may only need to be done in the projection aperture. There are a great many projection apertures, so the ones you are likely to encounter are detailed below in Section 15.3.5: Film Formats.
As we saw in the HD section above, video now only has one aspect ratio – 16:9. Film, on the other hand, has many different aspect ratios to deal with. The aspect ratio of a frame is a number that describes its shape – whether it is nearly square or more rectangular. The aspect ratio is calculated by dividing the width by the height like this:
| Equation 15.1 |
It does not matter what units of measure are used in the calculation. For example, the aspect ratio of an academy aperture in pixels is 1828 ÷ 1332 = 1.37. If you measured the film itself in inches, it would be 0.864 ÷ 0.630 = 1.37. An aspect ratio can also be expressed as an actual ratio, such as 4:3. This means that the item of interest is 4 “units” wide by 3 “units” tall. A 4:3 aspect ratio can also be expressed as a floating-point number by performing the arithmetic of dividing the 4 by the 3 (4 ÷ 3 = 1.33). I prefer the floating-point representation for two reasons. First, for many real world aspect ratios the ratio format is hard to visualize. Would you rather see an aspect ratio expressed as 61:33 or 1.85? Second, you frequently need to use the aspect ratio in calculations of image width or height and would have to convert the ratio format into a floating-point number anyway.
Figure 15.32 shows a series of aspect ratios to illustrate the pattern. An aspect ratio of 1.0 is a perfect square, and as the aspect ratio gets larger the shape of the image gets wider. For aspect ratios greater than 1.0, trimming the perimeter of an image by a uniform amount, say, 100 pixels all around, will increase the aspect ratio because it removes a greater percentage of the height compared to the width.
The aspect ratio is also essential to calculating image window heights and widths. For example, cropping a DCI compliant 1.89 window out of a full aperture frame. If the film scan is, for example, 3k (3072) pixels wide, then we need to calculate the height of a 1.89 window. Slinging a little algebra, we can solve Equation 15.1 for height and width like so:
| Equation 15.2 |
| Equation 15.3 |
We want to figure the height, so using Equation 15.2 we would calculate:
height = 3072 ÷ 1.89 = 1625 pixels high
So the 3k version of the DCI compliant window is 3072 × 1625. The next step is to resize it to 2k resulting in 2048 × 1080, the standard 2k DCI format.
There are a number of film formats for 35mm film so it can get a bit confusing at times. In this section we will examine the full aperture with its variations, the academy, plus Cinemascope and VistaVision. The standard 65mm format and its IMAX variant are also discussed. Image sizes are given for the resolution you are most likely to be working in for that format. Cinemascope has a number of unique issues due to its anamorphic format so we will give is special attention.
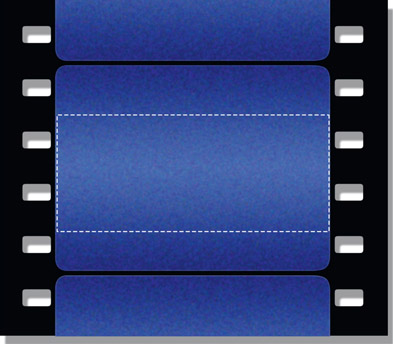
Full aperture, sometimes referred to as “super 35”, is a 1.33 aspect ratio image that covers the film from perf-to-perf left and right. Vertically it spans four perfs (perforations – the little holes in the side of the frame) and is so tall that it only leaves a thin frame line between frames (see Figure 15.33). This format exposes the most film area of all formats and since the entire negative area is exposed there is no room for a sound track. As a result this format cannot be projected in theaters so it is a capture-only format. 2k full ap scans are 2048 × 1556.
If the full ap frame cannot be projected in a theater, what is it doing on your monitor getting an effects shot? DPs like to shoot full ap in order to get the most picture on the negative to increase detail and lower the presence of grain. The entire full aperture frame will normally be scanned but you may have to crop it down to the show format. See your comp super.

Figure 15.34
Academy aperture with sound track and full aperture outline
The academy aperture is a 1.37 aspect ratio image that is smaller and shifted to the right relative to the full aperture to make room for a sound track. Of course, none of your film scans will have a sound track because it goes on the print for theatrical projection, not the original camera negative. Figure 15.34 has a dotted outline of the full aperture to illustrate how the academy aperture fits within it. It also shows how the academy center (black cross) is shifted to the right of the full ap center (light gray cross). Any reference to the academy center, then, refers to this “off-center” center. A 2k scan of the academy aperture is 1828 × 1332.
Many movies are filmed in super 35 (2048 × 1556) then reformatted in post to the final projection format. The standard U.S. widescreen format is 1.85 and a 1.85 window cropped out of a super 35 frame would look like Figure 15.35. The European widescreen format is 1.66 while the DCI standard is 1.89. The special case of the Cinemascope format is discussed in the section below.
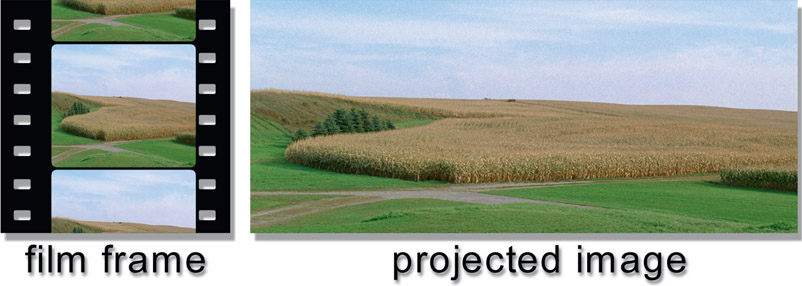
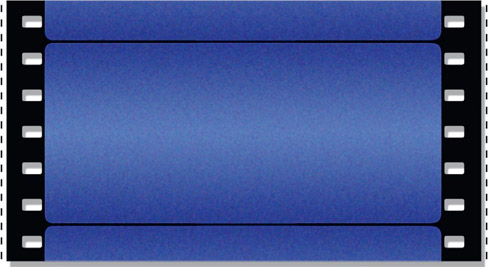
Cinemascope (Cscope) is a 2.35 aspect ratio “wide screen” format with the image on the film squeezed horizontally by a factor of two. At projection time a special “anamorphic” (one-axis) lens stretches the image horizontally by a factor of two to restore the proper perspective to the picture. When an anamorphic image is unsqueezed it is referred to as “flat”. This 2:1 relationship between the squeezed film frame and the flat projection frame is illustrated in Figure 15.36.
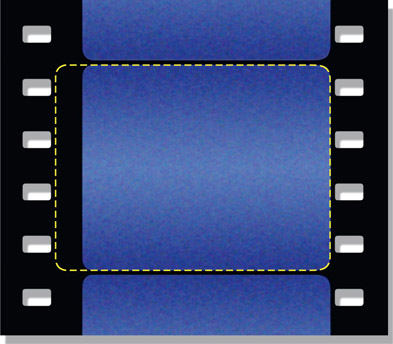
Figure 15.37
Cinemascope frame with full aperture reference outline
To get the squeezed image on the film in the first place it was initially photographed with an anamorphic lens that squeezed it horizontally by 0.5. An anamorphic lens is much more complex, heavier, more expensive, and loses more light than a regular spherical lens so they are less popular to work with. The real advantage of shooting Cscope is that much more film area is used for the picture. This can be seen in the Cinemascope film aperture illustration in Figure 15.37. The Cscope frame has an academy width but a full aperture height.
HISTORY NOTE: Cscope originally had a 2.35 aspect ratio image and is frequently referred to as simply “2.35”. Unfortunately, the splices between scenes kept showing up when projected, so in 1970 SMPTE changed the standard to 2.39 to leave more room for the splice. However, many folks still refer to Cscope as “2.35” even though it has been 2.39 since 1970. For the sake of tradition we are using 2.35 in this book.
There is a second way of producing a Cscope film and that is to photograph it in super 35 (full aperture) then crop a 2.35 window out of the frame like the illustration in Figure 15.38. Compared to a true Cinemas-cope frame it uses less negative area but modern film stocks have much less grain so this is a very popular way to produce a Cscope film because it has the great advantage of not having to use the cumbersome and expensive Cscope lenses.
Cscope, or any anamorphic format, is a prickly format with which to work. To work with anamorphic images properly your compositing software needs to support variable pixel aspect ratios. A Cscope anamorphic image has a pixel aspect ratio of 0.5, other anamorphic images such as the one in Section 15.1.2: Anamorphic Video will have a different pixel aspect ratio. With a variable pixel aspect ratio system you can view the anamorphic image in the viewer “stretched” to look right, and also safely scale and rotate anamorphic images without flattening them first because the software compensates for the non-square pixels automatically. If your software does not support variable pixel aspect ratios then you will have to flatten the anamorphic image, do your business, then squeeze it at the end of the comp. This will, of course, double the number of pixels, affecting rendering time, as well as filter the image which softens it. You could try to compensate with a bit of horizontal sharpening, but it is much better if you can work in anamorphic.
The problem is that an anamorphically squeezed image cannot be blurred, rotated or scaled without introducing serious distortions. If you scale an anamorphic image by, say, 10%, when it is later flattened during projection it will appear scaled 10% vertically but 20% horizontally. Not good. If you attempt to rotate an anamorphic image it will end up being skewed. The rotational distortions are harder to visualize, so Figure 15.39 is offered as a case in point. The original image was squeezed 50% horizontally like Cscope, rotated 10 degrees then flattened back to original size. As you can see, the unsqueezed image took a serious hit during the anamorphic rotation.

Figure 15.39
Distortions from rotating an anamorphically squeezed image
All of the film formats described so far are referred to as “4-perf” in that they use a length of film that has four perfs (perforations) per frame. However, there is also an obscure format called “3-perf” that has only three perfs per frame. I bring it up because it is becoming not so obscure anymore due to the advent of the Digital Intermediate process (described below).

Figure 15.40
3-perf film
The advantage of 3-perf film is that it is cheaper to use because it saves film stock and lab expenses. Since the film is advanced only three perfs per frame rather than four it uses 25% less film for the same length of shot. Less exposed film also means less lab fees. It does, however, require a special 3-perf camera for filming.
A 3-perf scan is 2048 × 1168 and has an aspect ratio of 1.75. This aspect ratio is very close to the aspect ratio of HD video (1.78), so it maps very nicely to HD. In addition to that, the 1.75 aspect ratio can be mapped into the standard USA theatrical widescreen format of 1.85 by just trimming a little off the top and bottom of the frame. You could very well receive 3-perf film scans for digital effects shots.
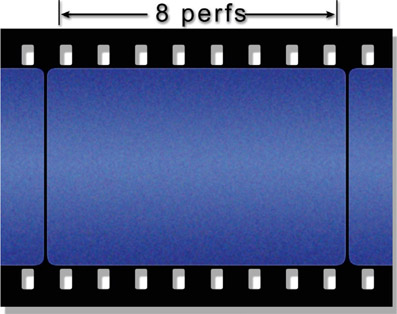
Figure 15.41
Vista frame
Vista is a super-high resolution film format made for us visual effects folks. It is a 35mm format with a 1.5 aspect ratio that is frequently used for photographing background plates for effects shots. By starting with an ultra-high resolution element there is far less visible degradation by the end of the effects process, plus the grain is very small in what is often a held frame. Vista, sometimes referred to as “8-perf”, uses far more negative than any other 35mm format by turning the film sideways so that the image spans eight perfs rather than the usual four. This means that the vista negative area is twice as big as the usual 4-perf full aperture. Transporting the film sideways obviously requires special cameras and projectors, but it uses the same film stock and lab processing as the rest of the 35mm world.
Vista scans are 3096 × 2048, with a file size to match. You are unlikely to ever actually do an effects shot in Vista, but you could be given a vista element to include in a more normally formatted shot. One common application is to load up a regular 35mm photographer’s camera with movie film stock and shoot stills to be used as background plates. Regular 35mm stills are also an 8-perf 1.5 aspect ratio format which fits nicely on your neighborhood film scanner. You end up with beautiful vista plates without a film crew or anything more than a photographer and a still camera. The extra size of the vista plate also comes in handy when you need an oversized background plate in order to give it an overriding move or to push in (scale up). Of course, the grain will not match the rest of the shot but we know how to deal with that.
65mm camera negative is a 5-perf format with an aspect ratio of 2.2, and is often referred to as “5-perf 70”. It is actually the release prints that are 70mm, with the extra 5mm on the outside of the sprocket holes for some additional sound track channels, illustrated by the dotted lines in Figure 15.42. Scans of 5-perf 65mm are a whopping 4096 × 1840.
IMAX, the mother of all film formats, is a 15-perf 70mm format with a 1.37 aspect ratio, often referred to as “15/70”. The negative, of course, is standard 65mm film. The film is laid on its side like the vista format. This is a special-venue format for the IMAX theaters. A scan of an IMAX frame is a staggering 5616 × 4096.

Figure 15.43
IMAX frame with below-center action “sweet spot”
IMAX has a truly huge frame with over 10 times the negative area of a regular 35mm academy frame. In addition to its enormous projected size, the IMAX theaters are designed so that the audience seats are much closer to the screen relative to its size. It’s somewhat like having the entire audience sit in the first five rows of a regular theater. The screen covers so much of the field of view that the action must be specially composed as shown in Figure 15.43.
The concept behind the IMAX format is visual “immersion”, therefore much of the screen is intended to be literally peripheral. The action and any titles should stay in the action “sweet spot”, below the center of the frame. Composing an IMAX film shot like ordinary 35mm films with the action in the center will cause the entire audience to crane their necks upwards for the length of the show. Keeping the action low and using the rest of the huge screen to fill the peripheral vision of the viewer results in the “immersion” experience.
It is particularly difficult to work with the IMAX format, not just because of the huge frame sizes but also because of the hugely different audience-to-screen relationship. IMAX frames on video or your monitor look odd with the action and titles all huddled down into the little “sweet spot” area. The instinct is to raise things up and make them bigger – until you screen the shot in an IMAX theater. Then suddenly everything is way too big and overhead. To get some idea of what the image on your monitor will look like when projected, move your nose down low and to within about three inches of your monitor. Seriously.
A few years ago the only log images were Cineon film scans. Today every digital cinema camera outputs log images. This section answers the burning questions – what are log images and why do we need them? It turns out that log images are actually a file storage format, not a workspace. In fact, you really should not operate on log images for any reason as the image-processing and color-grading math will be all wrong.
The short answer is that the data in log image files are the log exponents of the pixel values, not the pixel values themselves. “Log” is short for “logarithmic” which refers to raising one number to the “power” of a second number, such as 102. It means to take the base number (10 in this case) and multiply by itself the number of times in the exponent (2 in this case) so 102 becomes 10 × 10 while 103 would be 10 × 10 × 10. Mathematicians use log numbers for expressing very large numbers. For example, would you rather see 1,000,000,000,000 or 1013?
Further, logs do not have to be integers or greater than 1. For example 102.5 would be 316.227 and 100.5 would be 3.16227. So logs are convenient for representing very large and very small numbers. Another thing to know about logs is that they can be manipulated mathematically – if you know the rules. For example, if you want to multiply two log numbers you actually have to add them.
Example: 102 × 103 = 105.
If you don’t believe me do the math: 102 (100) × 103 (1,000) = 105 (100,000).
One more rule: any number raised to the power of zero equals one (100 = 1, 20 = 1, etc.).
Figure 15.44 shows what happens if we graph the base 10 log exponents against the image brightness values that it represents. The log exponents are on the vertical axis on the left edge and the brightness values they represent are on the horizontal axis below. This curve illustrates logs using base 10 as they are more familiar for telling the story of log. However, digital images will be log base 2, but the same relationships still apply between the log exponents and image brightness.
The important issue here is the slope of the log curve between the darks and the brights. In the darks (on the left) the slope of the line is very steep, which means that a large change in the log exponent produces a small change in the image brightness while in the brights (on the right) the small change in the log data produces a large change in brightness. We can clarify with an example.
Starting with the darks on the left side, the height of the white rectangle outlines 0.1 log units vertically between log exponents 1.0 and 1.1. The “2.6” above it is the difference in image brightness between log 1.0 and 1.1. However, in the brights the black rectangle also outlines a rectangle of 0.1 log units vertically between log 2.3 and 2.4, but due to the slope of the line in this region the brightness difference is now 51.7, much greater. The point is that with log units a small difference of 0.1 in the darks resulted in a small difference in brightness (2.6), but the same small difference of 0.1 in the brights resulted in a large difference in brightness (51.7). Restated, with log units a small difference in the darks is a small difference in brightness, but that same small difference in the brights results in a big difference in brightness. This means that log images have very fine detail in the darks and much lower detail in the brights – which is exactly what we want. But why do we want this?
There are two reasons we need log images: the non-linear nature of our vision, and data compression. Let’s do the vision thing first.
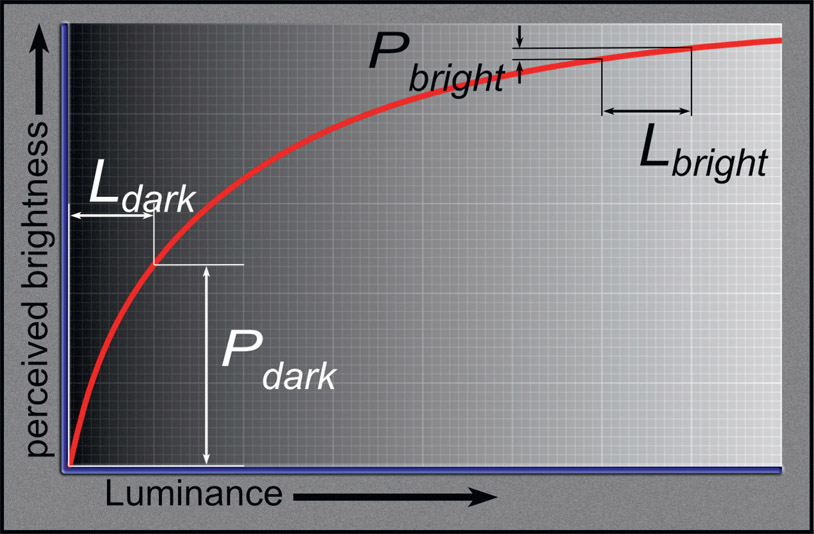
Our vision gets more sensitive in the darks and less sensitive in the brights. This is quite fortunate because if it didn’t work that way we could not see into shadows to spot a hidden tiger or, at the other end, would be blinded by the midday Sun. Having this variable adaptive vision gives us humans a huge dynamic range for brightness-adapted vision of around 1,000,000:1 – yes, a million to one! Compared to the human eye, a topof-the-line digital cinema camera, the RED Dragon, has a paltry dynamic range of only 65,000:1. The eyes have it.
Figure 15.45 graphs the non-linear relationship between (P), our perceived brightness (the vertical axis), and (L), scene luminance (the horizontal axis). It shows how in the darks a small increase in scene luminance (Ldark) results in a big increase in perceived brightness (Pdark), but in the brights the same increase in luminance (Lbright) results in a small increase in perceived brightness (Pbright). The conclusion here is that in the darks, very small changes in luminance are well seen, but in the brights very large changes in luminance are hardly noticed.
Does this sound familiar? You bet it does. In the log image explanation above (Figure 15.44) we established a similar relationship between log data and scene brightness. So storing image data in a log format works well with the human visual system by putting more details in the darks where we need them and less in the brights where we don’t see them.
Data compression is the other reason for log files. It is a perceptual compression scheme, which means it is based on human perception – our vision, in this case. Another example of a perceptual compression scheme is 4:2:2 video subsampling. Another one is jpeg for pictures. Another is Dolby for audio.
To summarize – log images are an efficient storage format for images because they reduce the file size and put the data where the eye needs it without wasting code values. The log file contains the exponents of the pixel values so when a log image is read into a compositing program it needs to be immediately converted to linear in order to produce the actual pixel values of the image.
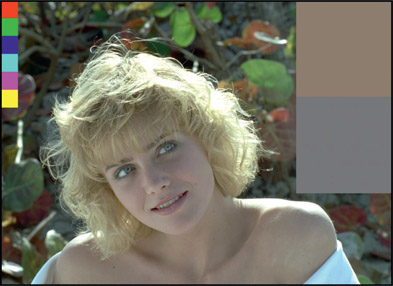
If a log image is displayed on a monitor it has that flat washed-out look that you see in Figure 15.46 and indeed, that is how you can tell you are looking at a log image. Now review the log graph in Figure 15.44 and you can see how that log curve explains the look of the log image. The blacks and midtones are lifted way up and the entire image loses contrast compared to Figure 15.47 where the same image has been converted to sRGB. In this section we will look at the workflow of working with log images and how that is implemented in a visual effects color pipeline.
Starting with a log image like Figure 15.46, it has to be linearized before any work can be done. To linearize it the log curve that is baked into the pixels has to be backed out to restore the image data to the original scene illumination. To be absolutely correct here, simply reversing the log curve only restores the linear data to a close approximation of the original scene illumination simply because we have not also corrected for the camera characteristics that captured the original scene. That missing piece of the story is one of the things that ACES addressed in Chapter 12: Digital Color. But it is close enough and works well enough to do Star Wars so it’s good enough for us until the whole world goes ACES.
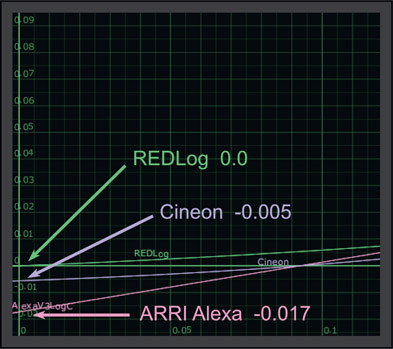
To back out the log curve we saw in Figure 15.44 we have to apply an inverse log LUT. Unfortunately, each camera manufacturer has its own custom log LUT so each needs its own custom inverse log LUT. Figure 15.48 shows a few common inverse log LUTs captured from my favorite compositing app, Nuke. For the compositor, the first question is which LUT to use. Most modern camera data contains metadata that will tell you which camera was used and what format the data is in, so that is one place to look. Failing that, check with your comp super.
There is an extremely important issue about log data when we look deep into the blacks, which is revealed in the close-up of the zero crossing points for those LUTs in Figure 15.49. Some log data will contain negative code values after being linearized. Some, like REDLog, do not go below zero, but many do. In a Cineon log file code value zero will linearize to code value –0.005 while code value zero in an ARRI Alexa Log C file will linearize to code value –0.017. You must be careful to retain these negative code values as there are many image-processing operations that would like to clip them to zero, which would be bad.
So what are these negative code values there for? They are there to leave “footroom” to retain the grain (or noise) in the blacks. If you define black to be code value zero when the image data is linearized, then some of the grain pixels must go negative. Should those blacks later be lifted during color correction the noise better be there or the blacks will be clipped flat.
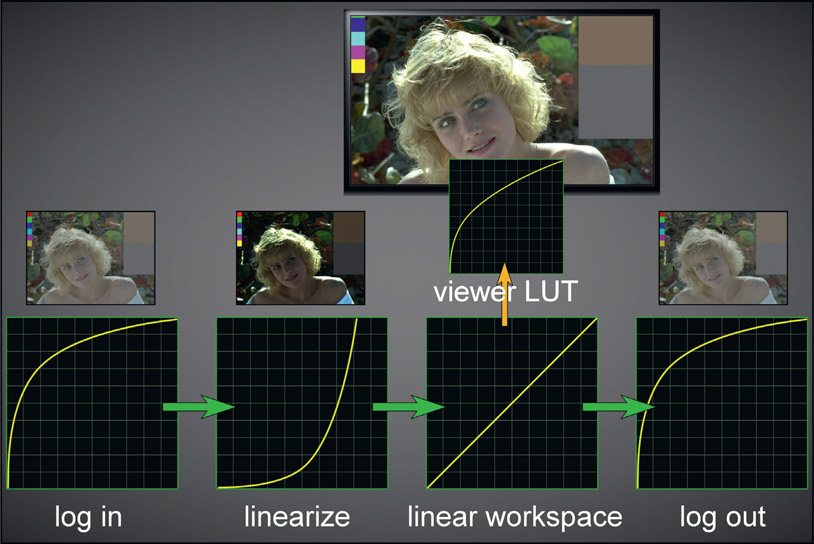
We now have all the pieces required to understand the visual effects color pipeline illustrated in Figure 15.50. Starting at the left, the log data is first read into the compositing app then is immediately linearized. All image processing, compositing and color correction is done in the linear workspace. As we have seen, linear data is way too dark for viewing so it is passed through a viewer LUT on its way to the monitor (typically sRGB) so that the picture will look nice for the artist. At the final stage of the composite the linear data is put through the original log LUT to restore it to the original log format as it is written to disk. The saved image on disk now has the same log LUT baked into it that the original log image had. In a properly set up color pipeline the incoming log image can be linearized then “re-logged” and saved to disk, and the saved image will be identical to the original.
For a feature film the input images will usually be log data from a digital cinema camera and the typical vfx pipeline is set up to return the finished shots in the same format as were delivered to the vfx studio. In other words, RED Dragon in, RED Dragon out. It is the exact same workflow even when working with sRGB or rec709 clips. The only thing that changes is the shape of the linearizing LUTs. The viewer LUT is unchanged as it is the bridge between the linear data – regardless of source – to the display monitor. If you are mixing RED Dragon with CGI, for example, the CGI will likely be in either an EXR file, which is already linear, or a tif or TARGA file, which is an sRGB image. The sRGB inverse LUT is used when it is read in so that all the action occurs in linear space.
The brilliance of converting all inputs to linear – besides it being the correct workspace for image-processing operations – is that we can now mix a variety of image sources in the same shot. You could be working on a shot that has an ARRI background plate, a greenscreen shot in HD, CGI delivered in a linear EXR file, and a digital matte painting in sRGB. By linearizing them all, they play nice together and the results are technically and visually correct.
Again, if you are working in an all-video environment the footage will be in rec709 and probably not linearized. We know this is a bit wrong because rec709 is a gamma-corrected linear space, not a true linear space. But it is close enough, and all of the tools are designed to work in rec709, so it all comes out fairly OK in the end. You would also be working in the limited dynamic range of HD and not the unlimited high dynamic range of feature film, so that puts a lot less strain on you and the images.
Light field cinematography is a completely different way of capturing a scene that has huge implications for the future of visual effects. The basic idea is to capture the scene with a huge array of cameras, each seeing the scene from a slightly different viewpoint. Capturing that much light from the scene from a variety of different POVs captures so many rays of light that it is referred to as capturing the “light field”. It is a quantum leap in the quantity of scene information compared to modern digital cinema cameras. By way of example, ARRI, the leader in feature-film cinematography – as measured by the number of academy award films in 2015 that used its equipment – captures a 6-megapixel frame. A light field camera captures more like a 1,000-megapixel frame!
All of that data is combined computationally to render the final image. Because the rendered image is computed from a great many perspectives, from slightly different POVs a whole new world of options opens up because we have vastly more information about the scene than ever before. One can, for instance, render the scene with any desired depth of field within the camera’s refocusable range. The POV can be repositioned from one side of the huge image array to the other, as if moving your head from side to side. The scene renders can also provide a vast array of AOVs that are currently available only with CGI renders but will now be available with live action. These AOVs change everything.
Directors of Photography are excited about light field cinematography because of the creative freedom it gives them in post for redefining the depth of field, the composition, and even the viewing angle. We, of course, are most excited about its astonishing capabilities applied to visual effects. In this section we will see how light field cameras work and how this vast increase in scene information will be used to revolutionize visual effects.
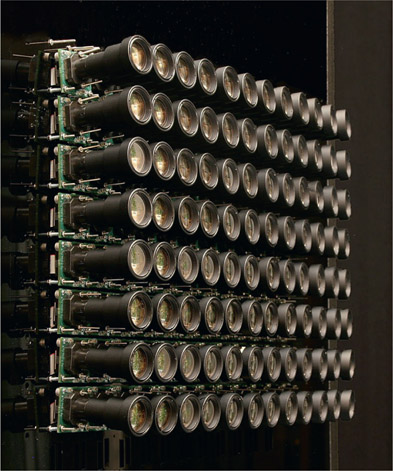
As mentioned above, the idea is to capture the scene with multiple cameras at once. Figure 15.51 shows an early camera array developed at Stanford in 2005 to test the basic concept. The actual output is computed from all the different images from each camera, so this is an example of computational photography. Because the scene is viewed from a great many angles, the depth to various objects in the scene can be calculated using depth-estimation techniques. Viewing an object from several slightly different points of view also allows us to “see around the corners” somewhat, which provides extra edge information. However, using an array of individual cameras like this introduces a number of technical problems such as variations in the shutter timing, variations in the image sensors, misaligned lenses, variations in lens distortion, not to mention the ridiculous size of the thing, and on and on. What is really needed is a compact and integrated design.
Enter the modern light field (LF) camera that incorporates a micro-lens array instead of a monstrous array of separate cameras. While the Stanford array above was an 8 × 12 array with 96 cameras and three-feet across, a micro-lens array has millions of microscopic “cameras” and is contained within a single camera body. The inset in Figure 15.52 depicts a single micro-lens that would sit over an area of the imaging sensor covering an area of pixels that can number in the dozens to hundreds. Millions of these micro-lenses are integrated together to create a single imaging sensor, of which just a small section is depicted in Figure 15.52.
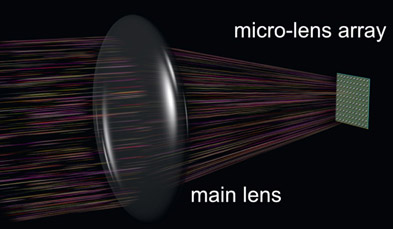
The micro-lens array forms the imaging sensor of the LF camera that is aligned to a main lens as illustrated in Figure 15.53. The one main lens is all that is needed for an LF camera as all lens effects (depth of field, focal point, etc.) are achieved computationally at render time. This arrangement of millions of integrated “cameras” behind a single lens solves all of the problems cited above for the original clunky camera arrays like in Figure 15.51. However, all light field cameras introduce a new challenge – the deluge of data.
One daunting issue with LF cameras is the enormous amount of data they generate. If we assume a DCI-compliant camera (2048 × 1080), that means there are theoretically over two million micro-lenses in the lens array (over-simplifying to assume only one micro lens per rendered pixel) and if each micro-lens had, say, 100 pixels we would be looking at a 200-megapixel frame. Adding in the bit depth of each pixel, it is starting to tip the scales at over 300MB per frame. But I said this was about LF cinematography, so now we have to multiply this by 24 to 120 or more frames per second. That’s about one Library of Congress every 5–10 minutes (for reference, the Library of Congress is estimated to contain roughly 20TB of data). The good news is that the march of technology is continuously in the direction of faster networks, larger and faster disk drives, cheaper storage, and more powerful computers. In other words, time and technology are on the side of light field cinematography. It’s going to happen.
The impact of LF cinematography on visual effects will be huge. To demonstrate that, in this section we will run down some of the potential capabilities that can be derived from LF images. But the future holds even more potential from new capabilities that we don’t yet know today as this awesome technology matures.
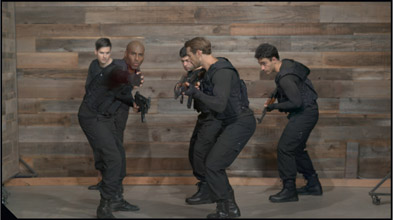
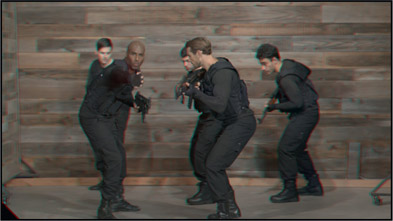
In Chapter 7 we saw the awesome power of deep images and deep compositing. Today, the only deep images available are CGI renders. But soon LF cinematography will deliver deep images for live action. The implications are awesome. Figure 15.54 shows a live action scene that was actually “filmed” with the first Lytro Cinema system. Remember, the camera does not directly generate an output image. Output images like this are rendered from the millions of images captured each frame and the final appearance is controlled by the settings at render time. So what might be done with all that light field data and a beefy computer?
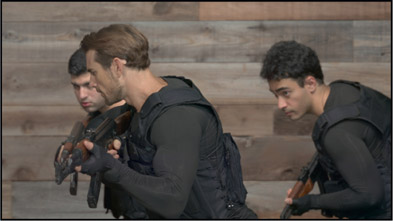
Take a close look at Figure 15.55 and Figure 15.56. These are the same frame from the clip in Figure 15.54 but were rendered with different depth of field settings. Figure 15.55 was rendered with a moderately deep depth of field with the back wall in reasonable focus, while Figure 15.56 has a very shallow depth of field. Not only can you choose what depth of field you want, but even one so deep that every pixel is in perfect focus within the refocusable range. Beyond that, you can set how deep the depth of field is separate from how close or far it is from the camera. You can even make up wild depth of field scenarios and optical properties that are not even possible with real lenses.
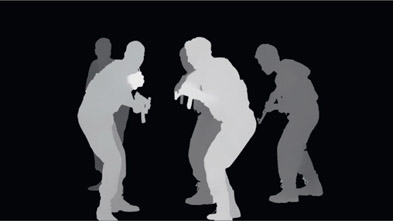
Figure 15.57 is the depth Z map from the live action clip, all generated algorithmically by the light field rendering process. That loud “thud” you just heard is the entire stereo conversion community fainting dead away, realizing that all those rotos and gradients they spent weeks and months drawing will no longer be necessary. All depth-based visual effects like atmospheric hazing can be quickly and inexpensively done using the depth Z maps produced by LF imagery. But it turns out that with LF cinematography we will never need to convert a flat movie to stereo again. Want to know why?
Put on your red and blue anaglyph glasses and check out the stereo frame in Figure 15.58. Light field cinematography can computationally produce stereo from a single camera. This is because arbitrary viewpoints may be rendered anywhere within the entrance pupil of the main lens and can produce stereoscopic images with a single lens. This will revolutionize stereo cinematography because it solves the long list of problems introduced by the need to use two cameras – camera misalignment, lens differences, exposure differences, shutter differences – and the list goes on. It also removes a long list of post-production problems due to the need to correct two different scene captures for every shot – color correction, frame alignment, composition differences, matching visual effects – and that list goes on and on too.
The one camera, one lens and one capture approach avoids all of these issues. Beyond the removal of principal photography and post-production problems, creating stereo from LF data offers a whole new range of creative controls. Completely arbitrary stereo separation and depth allocation, along with independent control over depth of field will provide the stereographer with unprecedented creative control over the final output. Further, the stereo settings should really be optimized for the intended theatrical screening environment – IMAX screens, regular screens, home viewing, etc. This will be trivial for light field as you will be able to just specify the required stereo parameters and render separate versions of the movie for each screen size.
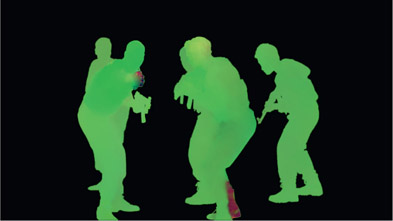
Volumetric optical flow (Figure 15.59) provides the speed and direction of the surfaces for each pixel in the frame and has many uses such as adding motion blur, tracking images, or paint fixes on complex moving surfaces like cloth. And of course, it can be rendered with your light field sequence – just render out the AOV. And this is no ordinary optical flow. It produces uvw (xyz) velocities in all three axes per pixel, in both forward and backward modes for optimal temporal operations.
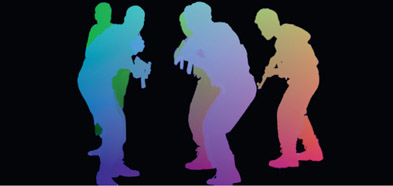
Figure 15.60
Position pass
We are used to getting a position pass with our CGI renders but a position pass for live action? Such are the impossible wishes granted to light field visual effects artists. The position pass contains the xyz location of each pixel for every object in the shot. And of course, one of the most spectacular things we can do with a position pass is to produce a point cloud of the scene and all of the objects in it.
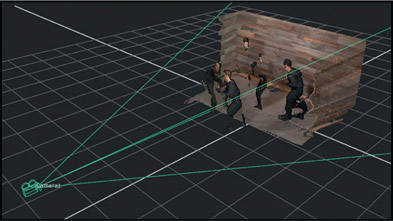
Given the position pass and the solved camera, plus some smart software that knows what to do with it, a high density 3D point cloud of the scene can be generated like Figure 15.61. Again, point clouds like this are normally only possible with CGI renders that contain the position pass and the camera, but light field cinematography can do it for live action. Such scene point clouds are incredibly useful for positioning 3D objects into the live action scene. The 3D object can literally be positioned in the point cloud and rendered with the scene camera, then composited in the original live action. But to do that we would need to have a matte for the characters. How might that be done?
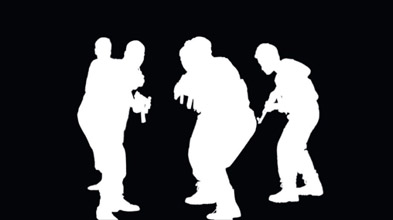
How this might be done is shown in Figure 15.62 where high quality mattes have been generated through artist identification and computational processing for all the characters in the light field scene. Since we have the xyz position pass for every pixel in the scene, volumetric clipping could be used to isolate any one character to generate a separate matte just for him. One can envision a smart light field roto tool where the object of interest is selected with a mouse click, and a matte is automatically generated for the length of the shot.
Just when you thought light field for visual effects could not get any more exciting, I offer you the normals pass (Figure 15.63) along with normals relighting. The split frame in Figure 15.64 shows a close-up of the talent with the original lighting on the left and the relight on the right. A green spotlight was added to demonstrate the effect, and note that because it is a true normals relight the falloff and reflected light intensity are completely correct for the angle of the surface and distance to the light source. Again, no hand-drawn rotos here. As you may know, to do a normals relight you need a normals pass, a position pass (which we saw earlier) and the solved camera. Oh yes – light field cinematography can also deliver the solved camera for the shot.

Figure 15.65
Solved camera
We have all spent hours doing our camera tracking to get a camera solve, and struggled with the trackers and the occlusions and twiddling the camera models and tracking parameters only to get a lousy camera solve. No more. Light field cinematography recovers the camera move with great precision along with the lens attributes – automatically! The solve is embedded in the massive data collected by the LF camera and the rendering software, and if so ordered, can produce the 3D camera solve with the push of a button. Some may have the solve generated by default just in case you need it. Why not? It’s practically free.
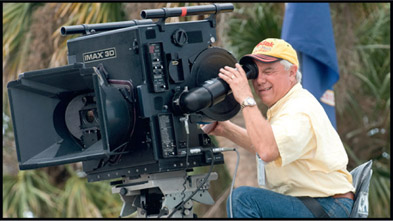
Figure 15.66
Perhaps the future production version of the LF camera will be about the size of this IMAX camera
Answer – soon, and a lot. As of this writing (2017), a light field cinema camera system has been built by Lytro, Inc. in Mountain View, California. All of the light field images in this section are from that camera. The next stage is to develop the production version, which I expect will take a number of years, so we can look for the production version to debut in the not-too-distant future. At the outset this exotic beast is best suited for specialty situations such as visual effects and movies intended for stereo release. Over the years its design will be further refined and industry acceptance will increase to where we might expect most movies to be filmed with a light field camera. I would predict that transition to take a decade or so.
As for how much will it cost, a light field camera is immensely more complex than a “simple” digital cinema camera like an ARRI or a RED. The custom imaging sensor is the size of Utah and the custom lens assembly rivals spy satellites in precision, size, complexity and cost. The IMAX camera shown in Figure 15.66 gives you some idea of my projections for estimated size of the production version. It’s big, and it’s complicated, so it will probably be expensive, but completely worth it.
Light field cinematography is coming to our industry. As we have seen, it has an enormous number of applications for our work, from the mundane of redefining the depth of field, to the exotic of relighting a live action scene on the fly. The wealth of AOVs that can be produced from the light field data supports a vast array of visual effects opportunities, plus the inevitable discoveries and evolution that will expand the capabilities beyond what we can foresee today. This technology portends a very bright future for visual effects. It may be a few years before you get the chance to work with light field data but this section gives you a heads up on this revolutionary change coming to our industry.
We have arrived at the end of our journey together. I hope you have enjoyed the reading and most importantly, found it informative and helpful for creating better comps faster. It is through training and production experience that we improve our skill and productivity in visual effects. From the techniques and procedures presented in this book I hope you will be able to make better keys, cleaner despills, and greater photorealism for all your comps.
May all your comps be hero!
Steve Wright
For all your visual effects compositing training needs visit me at www.fxecademy.com


