Chapter 12
Brain Energy Metabolism
All the processes described in this textbook require energy. Ample clinical evidence indicates that the brain is exquisitely sensitive to perturbations of energy metabolism. This chapter covers the topics of energy delivery, production, and utilization by the brain. Careful consideration of the basic mechanisms of brain energy metabolism is an essential prerequisite to a full understanding of the physiology and pathophysiology of brain function. Abnormalities in brain energy metabolism are observed in a variety of pathological conditions such as, for example, neurodegenerative diseases, stroke, epilepsy, and migraine. The chapter reviews the features of brain energy metabolism at the global, regional, and cellular levels and extensively describes recent advances in the understanding of neuro-glial metabolic cooperation. A particular focus is the cellular and molecular mechanisms that tightly couple neuronal activity to energy consumption. This tight coupling is at the basis of functional brain-imaging techniques, such as positron emission tomography (PET) and functional magnetic resonance imaging (fMRI).
Energy Metabolism of the Brain as a Whole Organ
Glucose Is the Main Energy Substrate for the Brain
The human brain constitutes only 2% of the body weight, yet the energy-consuming processes that ensure proper brain function account for approximately 25% of total body glucose utilization. With a few exceptions that will be reviewed later, glucose is the obligatory energy substrate of the brain. In any tissue, glucose can follow various metabolic pathways; in the brain, glucose is almost entirely oxidized to CO2 and water through its sequential processing by glycolysis (Fig. 12.1), the tricarboxylic acid (TCA) cycle also referred to as the Krebs cycle (Fig. 12.2), and the associated oxidative phosphorylation, which yield, on a molar basis, between 30 and 36 ATPs per glucose, depending on the coupling efficiency of oxidative phosphorylation. Indeed, the oxygen consumption of the brain, which accounts for almost 20% of the oxygen consumption of the whole organism, is 160 mmol per 100 g of brain weight per minute and roughly corresponds to the value determined for CO2 production. This O2/CO2 relation corresponds to what is known in metabolic physiology as a respiratory quotient of nearly 1 and demonstrates that carbohydrates, and glucose in particular, are the exclusive substrates for oxidative metabolism.
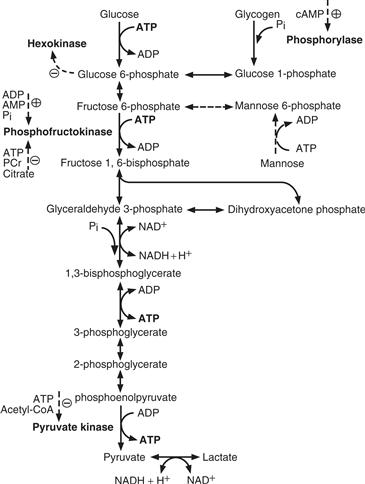
Figure 12.1 Glycolysis (Embden-Meyerhof pathway). Glucose phosphorylation is regulated by hexokinase, an enzyme inhibited by glucose 6-phosphate. Glucose must be phosphorylated to glucose 6-phosphate to enter glycolysis or to be stored as glycogen. Two other important steps in the regulation of glycolysis are catalyzed by phosphofructokinase and pyruvate kinase. Their activities are controlled by the levels of high-energy phosphates, as well as of citrate and acetyl-CoA. Pyruvate, through lactate dehydrogenase, is in dynamic equilibrium with lactate. This reaction is essential to regenerate NAD+ residues necessary to sustain glycolysis downstream of glyceraldehyde 3-phosphate. PCr, phosphocreatine.
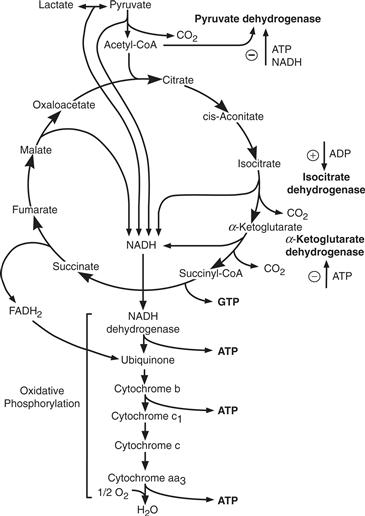
Figure 12.2 Tricarboxylic acid cycle (TCA cycle) and oxidative phosphorylation. Pyruvate entry into the cycle is controlled by pyruvate dehydrogenase activity that is inhibited by ATP and NADH. Two other important regulatory steps in the cycle are controlled by isocitrate and α-ketoglutarate dehydrogenases, whose activities are controlled by the levels of high-energy phosphates.
This rather detailed information of whole brain energy metabolism was obtained using an experimental approach in which the concentration of a given substrate in the arterial blood entering the brain through the carotid artery is compared with that present in the venous blood draining the brain through the jugular vein. If the substrate is utilized by the brain, the arteriovenous (A-V) difference is positive; in certain cases, the A-V difference may be negative, indicating that metabolic pathways resulting in the production of the substrate predominate. In addition, when the rate of cerebral blood flow (CBF) is known, the steady-state rate of utilization of the substrate can be determined per unit time and normalized per unit brain weight according to the following relation: CMR = CBF (A-V), where CMR is the cerebral metabolic rate of a given substrate.
This approach was pioneered by Seymour Kety and C. F. Schmidt in the late 1940s and was further developed in the 1950s and 1960s. In normal adults, CBF is approximately 57 ml per 100 g of brain weight per minute, and the calculated glucose utilization by the brain is 31 mmol per 100 g of brain weight per minute, as determined with the A-V difference method. This value is slightly higher than that predicted from the rate of oxygen consumption of the brain. Thus, in an organ such as the brain with a respiratory quotient of 1, the stoichiometry would predict that 6 mmol of oxygen are needed to fully oxidize 1 mmol of the six-carbon molecule of glucose; given an oxygen consumption rate of 160 mmol per 100 g of brain weight per minute, the predicted glucose utilization would be 26.6 mmol per 100 g of brain weight per minute (160:6), yet the actual measured rate is 31 mmol. What then is the fate of the excess 4.4 mmol? First, glucose metabolism may proceed, to a very limited extent, only through glycolysis, resulting in the production of lactate without oxygen consumption (Fig. 12.1); glucose can also be incorporated into glycogen (Fig. 12.1). Second, glucose is an essential constituent of macromolecules such as glycolipids and glycoproteins present in neural cells. Finally, glucose enters the metabolic pathways that result in the synthesis of three key neurotransmitters of the brain: glutamate, GABA, and acetylcholine (see Chapter 6).
Ketone Bodies Become Energy Substrates for the Brain under Particular Circumstances
Under particular circumstances, substrates other than glucose can be utilized by the brain. For example, breastfed neonates have the capacity to utilize the ketone bodies acetoacetate (AcAc) and D-3-hydroxybutyrate (3-HB) or free fatty acids, in addition to glucose, as energy substrates for the brain. This capacity is an interesting example of a developmentally regulated adaptive mechanism because maternal milk is highly enriched in lipids, resulting in a lipid-to-carbohydrate ratio much higher than that present in postweaning nutrients. Indeed, lipids account for approximately 55% of the total calories contained in human milk, in contrast with 30–35% for a balanced postweaning diet. Acetoacetate, 3-HB, and free fatty acids can all be processed to acetyl-CoA, thus providing ATP through the TCA cycle (Fig. 12.3).
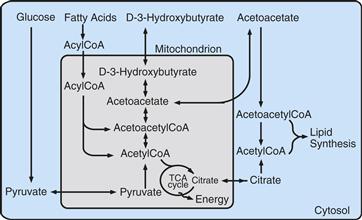
Figure 12.3 Relationship between lipid metabolism and the TCA cycle. Under particular dietary conditions, such as lactation in newborns or fasting in adults, the ketone bodies acetoacetate and D-3-hydroxybutyrate and circulating fatty acids can provide substrates to the TCA cycle after conversion to acetyl-CoA. Carbon atoms for lipid synthesis can be provided by glucose through citrate produced in the TCA cycle, a particularly relevant process for the developing brain.
Another consideration regarding the lipid-rich diet provided during the suckling period relates to its contribution to the process of myelination. Evidence shows that brain lipids can be synthesized from blood-borne precursors such as ketone bodies. In addition, when suckling rats are fed a diet low in ketones, carbon atoms for lipogenesis can also be provided by glucose (Fig. 12.3). To summarize, ketone bodies are energy substrates, as well as precursors for lipogenesis during the suckling period; however, the developing brain appears to be metabolically quite flexible because glucose, in addition to its energetic function, can be metabolized to generate substrates for lipid synthesis.
Starvation and diabetes are two situations in which the availability of glucose to tissues is inadequate and in which plasma ketone bodies are elevated because of enhanced lipid catabolism. Under these conditions, the adaptive mechanisms described for breast-fed neonates become operative in the brain, allowing it to utilize AcAc or 3-HB as energy substrates.
Lactate and Pyruvate Serve as Instructive Cases
In addition to ketone bodies, lactate and pyruvate represent energy substrates alternative to glucose for neural cells. These two monocarboxylates can readily enter the cells through specialized monocarboxylate transporters (MCTs) and can be metabolized in the mitochondria through the TCA cycle and the oxidative phosphorylation to produce energy in the form of ATP (Fig. 12.2). In vitro and ex vivo data have provided extensive demonstration that lactate and pyruvate can sustain neuronal function—that is—synaptic activity, even in the absence of glucose (Schurr, 2006). In line with this, both monocarboxylates can protect neurons from cell damage/death in conditions of energy deprivation such as in hypoglycaemia.
It was initially thought that the permeability of the blood-brain barrier to monocarboxylates was limited, suggesting that circulating lactate or pyruvate could not represent significant alternative substrates to glucose for the brain in vivo. The demonstration of the expression of MCTs on intraparenchymal brain capillaries along with magnetic resonance spectroscopy (MRS) experiments have led to the reevaluation of the importance of circulating monocarboxylates, and in particular lactate, for brain energy metabolism. It is now estimated that plasma lactate (≈1.0 mM) is taken up by the human brain, where it is fully oxidized accounting for up to 8 to 10% of its energy requirements. This contribution may even be greater at supraphysiological lactate concentrations (i.e., following intravenous lactate infusion) with a near linear relationship. Increases in blood lactate concentration are observed in different physiological conditions such as during physical exercise, implying that lactate can readily be used by the brain as an alternative energy substrate in such specific conditions. In particular, during moderate-to-vigorous exercises, which results in blood lactate concentration up to 10 mM, the human brain takes up and oxidizes lactate to a considerably larger extent than under normal conditions (which could cover up to 20 to 25% of the total brain energy demand); this increase in lactate oxidation occurs at the expense of blood glucose utilization. Overall these data demonstrate that plasma lactate can be an energy substrate for the human brain. In addition, if formed within the brain parenchyma from glucose that has crossed the blood-brain barrier, lactate and pyruvate may in fact become the preferential energy substrates for activated neurons (see below).
Summary
Glucose is the obligatory energy substrate for brain, and it is almost entirely oxidized to CO2 and H2O. This simple statement summarizes, with few exceptions, over five decades of careful studies of brain energy metabolism at organ and regional levels. Under ketogenic conditions, such as starvation and diabetes and during breastfeeding, ketone bodies may provide an energy source for the brain. Lactate, formed from glucose within the brain parenchyma or imported from the circulation, is an adequate energy substrate as well.
Tight Coupling of Neuronal Activity, Blood Flow, and Energy Metabolism
A striking characteristic of the brain is its high degree of structural and functional specialization. Thus, when we move an arm, motor areas and their related pathways are activated selectively (see Chapter 27); intuitively, one can predict that as “brain work” increases locally (e.g., in motor areas), the energy requirements of the activated regions will increase in a temporally and spatially coordinated manner. Because energy substrates are provided through the circulation, blood flow should increase in the modality-specific activated area. In agreement with this prediction, a fascinating and robust feature of brain energy metabolism is the existence of such a tight coupling between energy demand and supply. Indeed, task-dependent increases in cerebral activity are invariably accompanied by changes in local cerebral blood flow and glucose utilization—these processes being referred to as neurovascular- and neurometabolic-coupling, respectively (Fig. 12.4A and Box 12.1).
Box 12.1 Positron Emission Tomography (PET) and Functional Magnetic Resonance Imaging (fMRI)
We have seen that neuronal activity is tightly coupled to blood flow and metabolism. With the advent of sophisticated imaging procedures such as positron emission tomography (PET) and functional magnetic resonance imaging (fMRI), it is now possible to detect the signals generated by the metabolic processes associated with neuronal activity, thus providing a unique opportunity to see the “brain at work.” Indeed, local changes in blood flow, glucose utilization, and oxygen consumption can be monitored noninvasively under basal and activated conditions in human subjects. How is this possible?
For PET, a solution containing slightly radioactive molecules is injected into the circulation, and its sites of brain uptake can be visualized. The molecule is labeled radioactively with an unstable radionuclide possessing an excess number of protons; as a consequence of normal radioactive decay, the excess proton is converted to a neutron. In this process, a positron (a positively charged electron) is emitted and collides with an electron, releasing energy in the form of two photons with opposite trajectories. The photons are sensed by specialized detectors placed around the head; when two photons simultaneously reach two detectors positioned at 180 degrees of each other, the origin of the positron–electron collision can be localized with a millimeter resolution. Commonly used positron-emitting radionuclides are oxygen-15 (15O), carbon-11 (11C), and fluorine-18 (18F). Blood flow is monitored with 15O-labeled water and glucose utilization with 18F-2-deoxyglucose. Oxygen consumption is visualized directly with 15O. With the use of sophisticated algorithms to process data, the localization of activity to specific brain areas during a given task (sensory, motor, cognitive) can be achieved. Thus, the activity of neuronal ensembles, and of the associated glia, coupled to increased blood flow and glucose utilization results in a localized signal due to the augmented concentration of 15O-labeled water (monitoring blood flow) and 18F-2-deoxyglucose (assessing glucose utilization) in the activated area (see Fig. 12.4A).
PET is one of the ways in which brain work can be visualized. A now popular technique, fMRI relies on the magnetic signals detected in an activated brain region in relation to its degree of oxygenation. Depending on the degree to which it is saturated by oxygen, hemoglobin (by acting as a paramagnetic contrast agent) can alter the magnetic signal detected in a tissue exposed to the magnetic fields used for structural MRI. In other words, different MRI signals can be obtained depending on the oxyhemoglobin/deoxyhemoglobin ratio in a given brain area. Local activation of a brain area results in increased blood flow (see Fig. 12.4A). Although the precise mechanisms for the fMRI signals are still being discussed, it is currently thought that this phenomenon, by leading to a localized enrichment in oxyhemoglobin, alters the oxyhemoglobin/deoxyhemoglobin ratio, providing the blood-oxygen-level-dependent (BOLD) signal for fMRI. Functional MRI is a remarkably convenient and powerful technique: the signal acquisition time is extremely rapid (in the order of seconds), and the resolution equals that of PET (i.e., a few millimeters). In addition, fMRI is totally noninvasive and can thus be repeated frequently on the same subject, who can then serve as its own control. The model of neurometabolic coupling provided by the ANLS can account for the unexpected increases in oxyhemoglobin during activation, which is at the basis of the BOLD signal. Indeed, the Astrocyte-Neuron Lactate Shuttle (ANLS) predicts that a transient nonoxidative use of glucose occurs during the initial phases (1 to 2 seconds) of activation, resulting in lactate production by astrocytes. Since activity-dependent increase in CBF (neurovascular coupling) brings to the activated area oxygen-enriched (arterial) blood, while oxygen consumption does not increase commensurately because of the transient nonoxidative use of glucose in astrocytes (see Fig. 12.4A), it follows that the activated region will contain a higher ratio of oxy/deoxy hemoglobin at the basis of the BOLD signal. Recoupling with oxidative processing of lactate/pyruvate in neurons reestablishes the oxy/deoxyhemoglobin ratio, consistent with the transient nature of the kinetics for the BOLD signal.
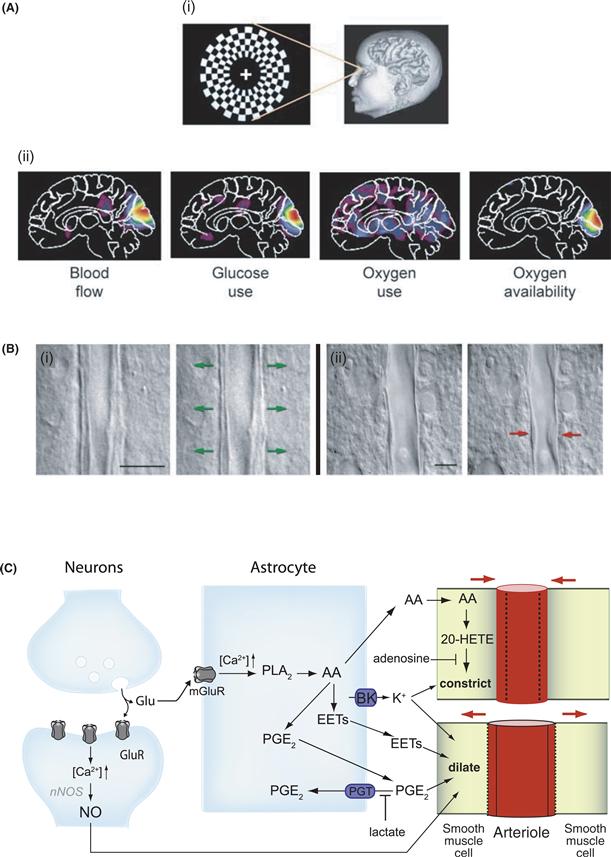
Figure 12.4 Neurovascular and neurometabolic coupling. (A) Differential regulation of CBF, CMRO2, and CMRglc during brain activation in humans. Stimulation of the human visual cortex was performed experimentally by presenting a visual stimulus in the form of a reversing annular checkerboard (i), and CBF, CMRO2, and CMRglc were determined by PET (ii) (see Box 12.1). When compared with viewing a blank screen, visual stimulation produces marked changes in activity in visual areas of the brain, as shown in PET images using pseudo colors (from small increase, blue, to major increase, red). Increases in both blood flow and glucose use in the visual cortex could be observed that are unaccompanied by similar increases in oxygen use, suggesting that the metabolic needs associated with brain activation are met by glycolysis. As a result, the local availability of oxygen increases because the increased supply of oxygen by increased (arterial) blood flow exceeds the increased local demand for oxygen. Such an effect may account for the blood-oxygen-level-dependent (BOLD) signal of functional magnetic resonance imaging (fMRI). Reproduced with permission from Raichle and Mintun (2006). (B) Dynamic regulation of vascular tone. Single interneuron stimulation is sufficient to either dilate (i) or constrict (ii) neighboring microvessels in acute rat cortical slices. In (i) and (ii), images of blood vessels before (left) and after (right) electrical stimulation of the interneurons are shown. Scale bars, 10 μm. Reproduced with permission from Cauli et al. (2004). (C) Glutamate-dependent regulation of CBF. Neuronal activity-dependent glutamate release raises [Ca2+]i in astrocytes by activating metabotropic glutamate receptors (mGluR). Ca2+ transients in astrocytes activate cytosolic phospholipase A2 (PLA2), thus producing arachidonic acid (AA). AA can generate different types of vasodilatory metabolites in astrocytes such as prostaglandins (PG), in particular PGE2, and epoxyeicosatrienoic acids (EETs). In parallel, AA can diffuse to arteriolar smooth muscle cells, where it is converted to 20-hydroxyeicosatetraenoic acid (20-HETE) by ω-hydroxylase, which exerts a vasoconstricting effect. During brain activation, vasodilation is promoted by the increases in extracellular lactate and adenosine concentrations. Indeed, lactate favors PGE2 accumulation in the extracellular space and thus vasodilation by decreasing the efficacy of the prostaglandin transporter (PGT) in astrocytes, whereas adenosine has an inhibitory effect on 20-HETE-mediated arteriolar constriction. In parallel to this, Ca2+ induces K+ release from astrocytes through the activation of calcium-dependent potassium channels (BK), which in turn can promote either vasodilation or vasoconstriction, depending on the level of extracellular K+. In postsynaptic neurons, glutamate activates ionotropic receptors, which trigger Ca2+ elevations, activation of the neuronal nitric oxide synthase (nNOS) and the release of the vasodilating nitric oxide (NO). Additional mechanisms are known to participate in CBF regulation but are not included in the present figure for clarity. A detailed description of all these mechanisms can be found elsewhere (see, for example, Attwell et al., 2010; Petzold & Murthy, 2011).
Modified with permission from Bélanger et al. (2011).
Which Mechanisms Couple Neuronal Activity to Blood Flow?
More than a century ago, the British neurophysiologist Charles Sherrington showed, in experimental animals, increases in blood flow localized to the parietal cortex in response to sensory stimulation. He postulated that “the brain possesses intrinsic mechanisms by which its vascular supply can be varied locally in correspondence with local variations of functional activity.” With remarkable insight, he also proposed that “chemical products of cerebral metabolism” produced in the course of neuronal activation could provide the mechanism to couple activity with increased CBF (also known as functional hyperemia).
Since Sherrington’s seminal work, a variety of vasoactive agents, including H+, K+, neurotransmitters (such as noradrenaline, serotonin, or vasoactive intestinal peptide [VIP]), adenosine, lactate, arachidonic acid metabolites, and nitric oxide (NO), released from different cellular compartments (i.e., neurons, astrocytes, pericytes, and smooth muscle cells) have been implicated in the activity-dependent increase in CBF. In conjunction with this, evidence suggests that the vascular tone is dynamically regulated, since both dilation and constriction of microvessels can be elicited in ex vivo preparations (Fig. 12.4B) (Attwell et al., 2010; Cauli et al., 2004; Petzold & Murthy, 2011). Although the exact physiological mechanisms underlying regulation of the vascular tone, and in particular functional hyperemia, are still incompletely understood, the importance played by neuron-to-astrocyte and glutamate signaling in this process is now widely demonstrated (Fig. 12.4C).
Nitric oxide has been recognized for a long time as an essential mediator for coupling neuronal activity to blood flow. NO is mainly formed locally by neurons under the action of glutamate (Fig. 12.4C), the principal excitatory neurotransmitter. Nitric oxide is a diffusible and potent vasodilator whose short half-life spatially and temporally restricts its domain of action. However, in several experimental models in which the activity of NO synthase, the enzyme responsible for NO synthesis, was inhibited, a certain degree of coupling was still observed, indicating that NO is only one of the regulators of local blood flow acting in synergy with others.
More recent in vitro and in vivo experiments have provided evidence that astrocytes may play a key role in neurovascular coupling. Indeed, as will be elaborated in greater detail in the section(s) devoted to neurometabolic coupling (e.g., see Fig. 12.11), astrocytes occupy a strategic position between capillaries and the neuropil. Through receptors and reuptake sites for neurotransmitters, notably glutamate, they can sense synaptic activity and couple it to vascular response. In particular, calcium transients in astrocytes resulting from metabotropic glutamate receptor activation have been shown to induce the production and release of vasoactive agents from astrocytes which are associated with both dilation or constriction of blood vessels (Fig. 12.4C). These vasoactive agents include products of arachidonic acid (AA) metabolism such as (1) the two vasodilators epoxyeicosatrienoic acids (EETs) and prostaglandin E2 (PGE2) formed within astrocytes, and (2) the vasoconstrictor 20-hydroxyeicosatetraenoic acid (20-HETE) that is produced in smooth muscle cells from AA released by astrocytes (Fig. 12.4C) (Attwell et al., 2010; Petzold & Murthy, 2011).
Interestingly, Gordon and collaborators demonstrated in rat brain slices that the balance between vasoconstriction and vasodilation may be dictated by brain metabolism. They observed that neuronal activation leads to arteriolar dilatation under low-oxygen conditions, whereas in high-oxygen conditions the same stimulus induces the constriction of arterioles (see Attwell et al., 2010; Petzold & Murthy, 2011). The authors also demonstrated that the vasodilating effect observed in lower-oxygen conditions is mediated by the activation of glycolysis and an elevation of extracellular lactate and adenosine concentrations, which interfere with PGE2 and 20-HETE metabolisms, respectively (Fig. 12.4C). This set of observations suggests that under resting conditions, when oxygen is not being rapidly consumed, astrocytic Ca2+ signals would induce a constricting tone, keeping cerebral blood flow at an appropriately lower level. In contrast, during activation, the drop in pO2 due to oxygen consumption (see Attwell et al., 2010) and the rise in extracellular lactate and adenosine levels would promote astrocyte-mediated vasodilation. Another important vasoactive agent released by astrocytes, which is also coupled to elevation of calcium levels, is K+. Indeed, activation of calcium-sensitive potassium (BK) channels leads to K+ release into the extracellular space which triggers vasodilation, through hyperpolarization of smooth muscle cells (see Petzold & Murthy, 2011) (Fig. 12.4C). Interestingly, overactivation of BK channels produces supraphysiologic elevation of external [K+] (similar to those found in pathological conditions such as ischemia or spreading depression), which shifts vasodilation to vasoconstriction, suggesting that the ambient level of extracellular K+ dictates the vascular tone.
In summary, several products of activity-dependent neuronal and glial metabolism such as NO, lactate, adenosine, prostanoids, and K+ exert vasoactive effects and are thought to be major (but not exclusive when taken individually) mediators of hyperemia. Importantly, these mediators appear to act in concert to dynamically regulate, both spatially and temporally, the vascular tone to adapt energy demand and supply. Nitric oxide is undoubtedly a key element in coupling, particularly in view of the fact that glutamate, the principal excitatory neurotransmitter, triggers a receptor-mediated NO formation in neurons. In conjunction to this, astrocytes have emerged as essential intermediary processors in neurovascular coupling. Nevetheless, the complex mechanisms involved in the coupling of neuronal activation and increased CBF are not yet fully elucidated and still await firm functional confirmation in vivo.
Through the activity-linked increase in blood flow, more substrates—namely, glucose and oxygen—necessary to meet the additional energy demands are delivered to the activated area per unit time. The cellular and molecular mechanisms involved in oxygen consumption and glucose utilization are treated in later sections.
Blood Flow and Energy Metabolism Can Be Visualized in Humans
Modern functional brain-imaging techniques enable the in vivo monitoring of human blood flow and the two indices of energy metabolism: glucose utilization and oxygen consumption (Fig. 12.4A and Box 12.1) (Raichle & Mintun, 2006). For instance, with the use of PET and appropriate positron-emitting isotopes such as 18F and 15O, basal rates, as well as activity-related changes in local blood flow or oxygen consumption, can be studied using 15O-labeled water or 15O2, respectively (Fig. 12.4A). Local rates of glucose utilization [also defined as local cerebral metabolic rates for glucose (LCMRglu)] can be determined with 18F-labeled 2-deoxyglucose (2-DG) (Fig. 12.4A). The use of 2-DG as a marker of LCMRglu was pioneered by Louis Sokoloff and associates at the National Institutes of Health, first in laboratory animals. The method is based on the fact that 2-DG crosses the blood-brain barrier, is taken up by brain cells, and is phosphorylated by hexokinase with kinetics similar to that for glucose; however, unlike glucose 6-phosphate, 2-deoxyglucose 6-phosphate cannot be metabolized further and therefore accumulates intracellularly (Fig. 12.5).
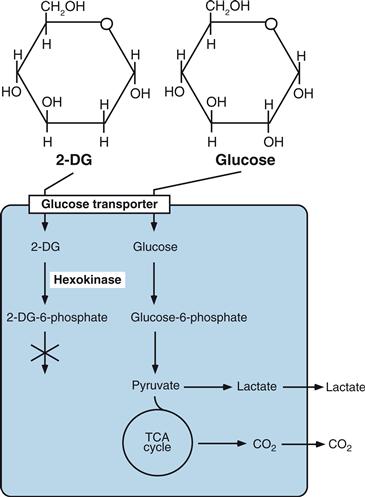
Figure 12.5 Structure and metabolism of glucose and 2-deoxyglucose (2-DG). 2-DG is transported into cells through glucose transporters and phosphorylated by hexokinase to 2-DG-6-phosphate without significant further processing or dephosphorylation back to glucose. Therefore, when labeled radioactively, 2-DG used in tracer concentrations is a valuable marker of glucose uptake and phosphorylation, which directly indicates glucose utilization.
For studies in laboratory animals, tracer amounts of radioactive 2-DG are injected intravenously; the animal is subjected to the behavioral paradigms of interest and sacrificed at the end of the experiment. Serial thin sections of the brain are prepared and processed for autoradiography. This autoradiographic method provides, after appropriate corrections, an accurate measurement of LCMRglu with a spatial resolution of a few millimeters. Using this method, researchers have determined LCMRglu in virtually all structurally and functionally defined brain structures in various physiological and pathological states, including sleep, seizures, and dehydration, and after a variety of pharmacological treatments. Furthermore, glucose utilization increases in the pertinent brain areas during motor tasks or activation of pathways subserving specific modalities, such as visual, auditory, olfactory, or somatosensory stimulation. For example, in mice, sustained stimulation of the whiskers results in marked increases in LCMRglu in discrete areas of the primary sensory cortex called the barrel fields, where each whisker is represented with an extreme degree of topographical specificity (see Chapter 24). Basal glucose utilization of the gray matter as determined by 2-DG autoradiography varies, depending on the brain structure, between 50 and 150 mmol per 100 g of wet weight per minute in the rat.
In humans, LCMRglu determined by PET with the use of 18F-2-DG is approximately 50% lower than that in rodents, and physiological activation of specific modalities increases LCMRglu in discrete areas of the brain that can be visualized with a spatial resolution of a few millimeters. For example, visual stimulations presented to subjects as checkerboard patterns reversing at frequencies ranging from 2 to 10 Hz selectively increase LCMRglu in the primary visual cortex and a few connected cortical areas. With the use of this stimulation paradigm, the combined PET analysis of local cerebral blood flow (LCBF) and local oxygen consumption (LCMRO2), in addition to LCMRglu, has revealed a unique and unexpected feature of human brain energy metabolism regulation (Fig. 12.4A). The canonical view was that the three metabolic parameters were tightly coupled, implying that, if, for example, CBF increased locally during physiological activation, LCMRglu and LCMRO2 would increase in parallel. In what is now referred to as the phenomenon of “uncoupling,” physiological stimulation of the visual system increases LCBF and LCMRglu (both by 30 to 40%) in the primary visual cortex without a commensurate increase in LCMRO2 (which increases only ≈5%) (Raichle & Mintun, 2006) (Fig. 12.4A), indicating that the additional glucose utilized during neuronal activation can be processed through glycolysis rather than through the TCA cycle and oxidative phosphorylation. The phenomenon of uncoupling has been confirmed in other cortical areas, although its magnitude may differ depending on the modality, and may actually be absent in certain cases. A glance at the metabolic pathways reveals that if glucose does not enter the TCA cycle to be oxidized, then lactate will be produced (Figs. 12.1 and 12.2).
Lactate, like several other metabolically relevant molecules, can be determined with the technique of magnetic resonance imaging (MRI) spectroscopy for 1H, which provides a means of unequivocally identifying in living tissues the presence of molecules that bear the naturally occurring isotope 1H. Consistent with the prediction that if during activation glucose is predominantly processed glycolytically, then lactate should be produced locally in the activated region, an activity-dependent transient increase in the lactate signal could be detected with 1H MRI spectroscopy in different brain areas (Figley & Stroman, 2011, and references therein). Interestingly, recent evidence obtained in human visual cortex demonstrates that while ATP production positively correlates with LCMRO2, task-induced CBF increase positively correlates with lactate production but negatively correlates with LCMRO2 (see Figley & Stroman, 2011). This suggests that while energy demand is met through oxidative metabolism, CBF response is mediated by factors other than oxygen demand (see section above). These observations support the view that to face the local increases in energy demands linked to neuronal activation, the brain transiently resorts to an integrated sequence of glycolysis and oxidative phosphorylation (Magistretti & Pellerin, 1999). This transient uncoupling may vary in amplitude depending on the modalities of activation (Frackowiak et al., 2001) and is likely to occur in different cellular compartments—that is, astrocytes versus neurons (Figley & Stroman, 2011; Pellerin & Magistretti, 1994).
Summary
Studies at the whole organ level, based on the A-V differences of metabolic substrates, have revealed a great deal about the global energy metabolism of the brain. They have indicated that, under normal conditions, glucose is virtually the sole energy substrate for the brain and that it is entirely oxidized. New techniques that allow imaging of the three fundamental parameters of brain energy metabolism—namely, blood flow, oxygen consumption, and glucose utilization—provide a more refined level of spatial resolution and demonstrate that brain energy metabolism is regionally heterogeneous and is coupled tightly to the functional activation of specific neuronal pathways.
Energy-Producing and Energy-Consuming Processes in the Brain
What are the cellular and molecular mechanisms that underlie the regulation of brain energy metabolism revealed by the foregoing studies at global and regional levels? In particular, what are the metabolic events taking place in the cell types that make up the brain parenchyma? How is it possible to reconcile whole organ studies indicating complete oxidation of glucose with transient activation-induced glycolysis at the regional level? These and other related questions will be addressed here and in the next sections.
Glucose Metabolism Produces Energy in the Form of ATP and Reducing Equivalents
Before we move on to an analysis of the cell-specific mechanisms of brain energy metabolism, it seems appropriate to briefly review some basic aspects of the energy balance of the brain. Because glucose, in normal circumstances, is the main energy substrate of the brain, the overview will be restricted to its metabolic pathways. Glucose metabolism in the brain is similar to that in other tissues and includes three principal metabolic pathways: (1) glycolysis occurring in the cytosol and associated with the pentose phosphate pathway and glucose storage in the form of glycogen (the latter only in astrocytes, see below), and (2) the TCA cycle and oxidative phosphorylation, which take place to the mitochondria. Because of the global similarities with other tissues, these pathways are simply summarized in Figures 12.1, 12.2, and 12.6, and only a few aspects specific to the nervous tissue will be discussed.
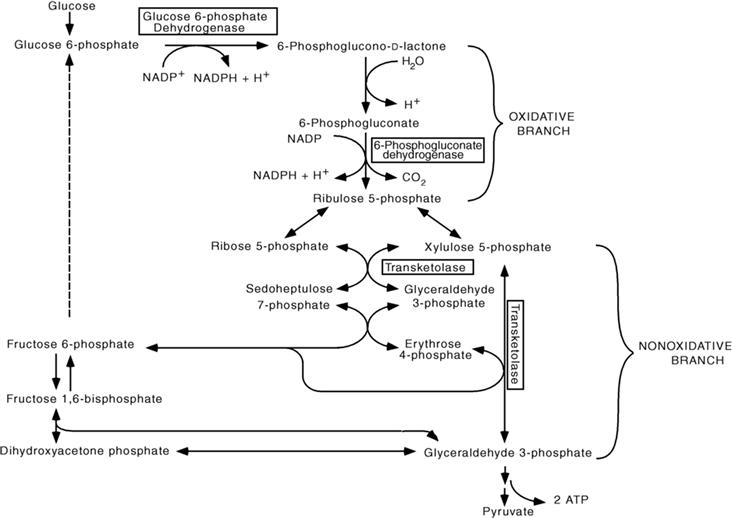
Figure 12.6 The pentose phosphate pathway. In the oxidative branch of the pentose phosphate pathway, two NADPH are generated per glucose 6-phosphate. The first rate-limiting reaction of the pathway is catalyzed by glucose 6-phosphate dehydrogenase; the second NADPH is generated through the oxidative decarboxylation of 6-phosphogluconate, a reaction catalyzed by 6-phosphogluconate dehydrogenase. The nonoxidative branch of the pentose phosphate pathway provides a reversible link with glycolysis by regenerating the two glycolytic intermediates glyceraldehyde 3-phosphate and fructose 6-phosphate. This regeneration is achieved through three sequential reactions. In the first, catalyzed by transketolase, xylulose 5-phosphate, and ribose 5-phosphate (which originate from ribulose 5-phosphate, the end product of the oxidative branch) yield glyceraldehyde 3-phosphate and sedoheptulose 7-phosphate. Under the action of transaldolase, these two intermediates yield fructose 6-phosphate and erythrose 4-phosphate. This latter intermediate combines with xylulose 5-phosphate, in a reaction catalyzed by transketolase, to yield fructose 6-phosphate and glyceraldehyde 3-phosphate. Thus, through the nonoxidative branch of the pentose phosphate pathway, two hexoses (fructose 6-phosphate) and one triose (glyceraldehyde 3-phosphate) of the glycolytic pathway are regenerated from three pentoses (ribulose 5-phosphate).
Glycolysis
Glycolysis (Embden-Meyerhof pathway) is the metabolism of glucose to pyruvate (Fig. 12.1). It results in the net production of only two molecules of ATP per glucose molecule; indeed, four ATPs are formed in the processing of glucose to pyruvate, whereas two ATPs are consumed to phosphorylate glucose to glucose 6-phosphate and fructose 6-phosphate to fructose 1,6-bisphosphate, respectively (Fig. 12.1). Under anaerobic conditions (meaning in the absence of oxygen), pyruvate is converted to lactate, allowing the regeneration of nicotinamide adenine dinucleotide (NAD+), which is essential to maintain a continued glycolytic flux. Indeed, if NAD+ were not regenerated, glycolysis could not proceed beyond glyceraldehyde 3-phosphate (Fig. 12.1). Another situation in which the end-product of glycolysis is lactate rather than pyruvate is when oxygen consumption does not match glucose utilization, implying that the rate of pyruvate production through glycolysis exceeds pyruvate oxidation by the TCA cycle (Fig. 12.2). This condition has been well described in skeletal muscle during intense exercise and in tumoral tissues, where it is referred to as the “Warburg effect”. The occurrence of aerobic glycolysis in the nervous system is consistent with the transient uncoupling observed between glucose utilization and oxygen consumption that has been described in the human cerebral cortex during activation with the use of PET (Raichle & Mintun, 2006).
Tricarboxylic Acid Cycle
Under aerobic conditions, pyruvate is oxidatively decarboxylated to yield acetyl-CoA in a reaction catalyzed by the enzyme pyruvate dehydrogenase (PDH). Acetyl-coenzyme A condenses with oxaloacetate to produce citrate (Fig. 12.2). This is the first step of the TCA cycle, in which three pairs of electrons are transferred from NAD+ to NADH—and one pair from flavin adenine dinucleotide (FAD) to its reduced form (FADH2)—through four oxidation-reduction steps (Fig. 12.2). During the process of pyruvate oxidation, carbon atoms leave the TCA cycle in the form of CO2. NADH and FADH2 transfer their electrons to molecular O2 through the mitochondrial electron transfer chain to produce 28-34 ATPs and H2O in the process of oxidative phosphorylation. Thus, under aerobic conditions (i.e., when glucose is fully oxidized through the TCA cycle to CO2 and H2O), NAD+ is regenerated enabling the TCA cycle to proceed further to generate ATP.
Pentose Phosphate Pathway
Although glycolysis, the TCA cycle, and oxidative phosphorylation are coordinated pathways that produce ATP, using glucose as a fuel, ATP is not the only form of metabolic energy. Indeed, for several biosynthetic reactions (anabolic reactions) in which the precursors are in a more oxidized state than the products, metabolic energy in the form of reducing power is needed in addition to ATP. This is the case for the reductive synthesis of free fatty acids from acetyl-CoA, which are components of myelin and of other structural elements of neural cells, such as the plasma membrane. In brain cells, as in other organs, the reducing power for anabolic reactions is provided by NADPH (the reduced form of nicotinamide adenine dinucleotide phosphate, NADP+) which is mainly produced by glucose processing through the pentose phosphate pathway (PPP) (Fig. 12.6). The NADP/NADPH ratio is the single most important factor regulating the entry of glucose 6-phosphate into the PPP. Thus, when high reducing power is mobilized (see also below), NADPH levels decrease, and the pentose phosphate pathway is activated to generate new reducing equivalents. The pentose phosphate pathway is also tightly connected to glycolysis through two enzymes—transketolase and transaldolase—which recycle PPP metabolites to fructose 6-phosphate and glyceraldehyde 3-phosphate, two intermediates of glycolysis (Fig. 12.6).
Glucose Metabolism, Reactive Oxygen Species, and the Protective Role of Glutathione
In addition to anabolic reactions, NADPH is needed for the scavenging of reactive oxygen species (ROS). The superoxide radical anion (O2-.), hydrogen peroxide (H2O2), and the hydroxy radical (HO.) are three ROS, generated by the transfer of single electrons to molecular oxygen as by-products of several physiological cellular processes. A considerable contribution to the generation of ROS is the oxidative metabolism of glucose taking place in the mitochondrial electron transfer chain associated with oxidative phosphorylation. Other ROS-generating reactions include the activities of monoamine oxidase, tyrosine hydroxylase, nitric oxide synthase, and the eicosanoid-forming enzymes lipoxygenases and cyclooxygenases. Reactive oxygen species are highly damaging to cells because they can cause DNA disruption and mutations, as well as activation of enzymatic cascades, including proteases and lipases that can eventually lead to cell death.
The coordinated activity of two molecules is essential in protecting cells against ROS-mediated damage, or oxidative stress: NADPH and glutathione. As we have seen, NADPH is produced through a particular arm of glucose metabolism, the PPP. Interestingly, therefore, glucose metabolism provides two forms of energy: high energy phosphates such as ATP and reducing power such as NAD(P)H, the latter contributing to the neutralization of ROS, the harmful by-products of the process (oxidative phosphorylation) that produces the former. It is, however, through its combined action with glutathione that NADPH contributes to ROS scavenging. Scavenging of ROS is ensured by the sequential action of superoxide dismutase (SOD) and glutathione peroxidase (Fig. 12.7). Thus, two superoxide anions formed by the aforementioned cellular processes are converted by SOD into H2O2, still a ROS. Glutathione peroxidase converts H2O2 into H2O and O2 at the expense of reduced glutathione (GSH), which is regenerated by glutathione reductase in the presence of NADPH (Fig. 12.7).
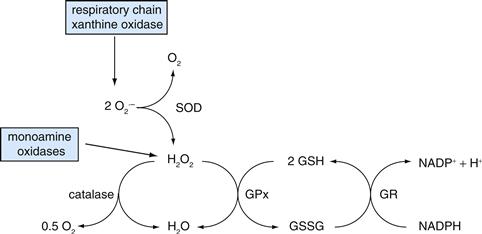
Figure 12.7 Enzymatic reactions for scavenging reactive oxygen species (ROS). The toxic superoxide anion (O2· –) formed by a variety of physiological reactions, including oxidative phosphorylation (i.e., respiratory chain), is scavenged by superoxide dismutase (SOD), which converts the superoxide anion to hydrogen peroxide (H2O2) and molecular oxygen. Glutathione peroxidase (GPx) converts the still toxic hydrogen peroxide to water; reduced glutathione (GSH) is required for this reaction, in which it is converted to its oxidized form (GSSG). GSH is regenerated through the action of glutathione reductase (GR), a reaction requiring NADPH.
Glutathione is a tripeptide (GSH; γ-L-glutamyl-L-cysteinylglycine) synthesized through the concerted action of two enzymes: γGluCys synthase, which combines glutamate and cysteine to yield the dipeptide γGluCys, and glutathione synthase, which adds a glycine to the dipeptide to yield GSH (Fig. 12.8). The glutathione content and reducing potential are considerably higher in astrocytes compared to neurons; this fact, combined with the much higher oxidative activity of neurons versus astrocytes, makes neurons more vulnerable to oxidative stress as well as highly dependent on astrocytes for their protection. Indeed, among the numerous metabolic cooperations that exist between astrocytes and neurons (which will be developed in more detail in the next section), an important one with regard to oxidative stress defense mechanisms involves glutathione metabolism through the shuttling of GSH from astrocytes to neurons. Astrocytes release large amounts of GSH into the extracellular space; GSH is cleaved by the sequential action of ectoenzymes to Cys and Gly (Fig. 12.8). Cys and Gly are transported into neurons (note that neurons cannot take up GSH), providing two precursors for GSH synthesis. Glutamate, the third precursor of GSH, is also provided by astrocytes to neurons under the form of glutamine, from which glutamate is produced through the action of glutaminase, through the so-called glutamate-glutamine shuttle which will be described in the next section (Figs. 12.8 and 12.10).
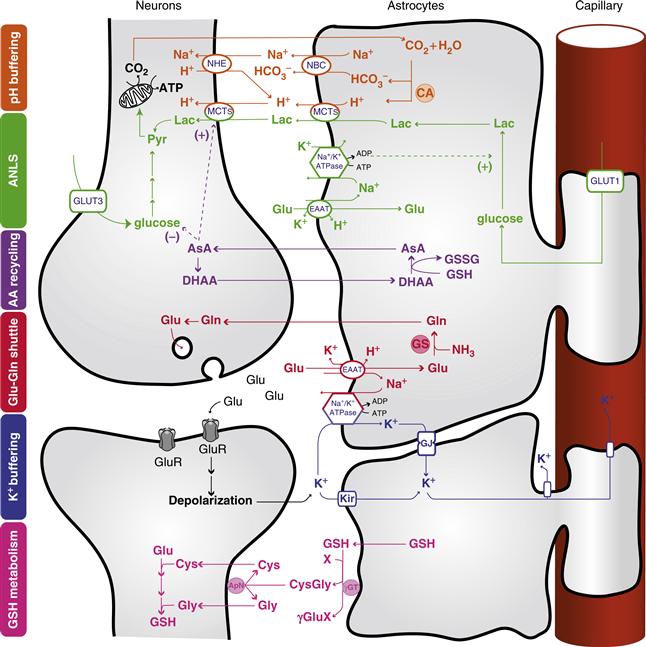
Figure 12.8 Central role of astrocytes in brain homeostasis. Orange: pH buffering. Abundant carbonic anhydrase (CA) in astrocytes converts CO2 to H+ and HCO3−. Two HCO3− are transported into the extracellular space along with one Na+ via the Na+-HCO3− cotransporter (NBC), thereby increasing the extracellular buffering power. Protons left in the glial compartment may drive the transport of lactate (Lac) outside of astrocytes and into neurons through monocarboxylate transporters (MCTs). Excess H+ in neurons is extruded via sodium-hydrogen exchange (NHE). Green: Astrocyte-neuron lactate shuttle (ANLS). Glutamate (Glu) uptake by astrocytes is accompanied by Na+ entry, which is extruded by the action of the Na+/K+ ATPase. This triggers anaerobic glucose utilization in astrocytes and glucose uptake from the circulation through the glucose transporter GLUT1. The lactate produced is shuttled to neurons through MCTs, where it can be used as an energy substrate after its conversion to pyruvate (Pyr). Neurons can also take up glucose via the neuronal glucose transporter 3 (GLUT3). Purple: Ascorbic acid recycling. Astrocytes recycle oxidized ascorbic acid (dehydroascorbic acid; DHAA) back to ascorbic acid (AsA) using reduced glutathione (GSH) and forming oxidized glutathione (GSSG). AsA can be used directly in astrocytes or released and taken up by neurons for reactive oxygen species (ROS) scavenging. AsA may also act as a metabolic switch by inhibiting glucose consumption and stimulating lactate uptake in neurons. Red: Glutamate-glutamine cycle. Glutamate released into the synaptic cleft activates ionotropic glutamatergic receptor (GluR), producing a postsynaptic depolarization. Astrocytic excitatory amino acid transporters (EAATs) are responsible for the uptake of a large fraction of glutamate at the synapse. Glutamate is converted into glutamine (Gln) by glutamine synthase (GS) and shuttled back to neurons for glutamate resynthesis. Blue: K+ buffering. Astrocytes buffer excess K+ released into the extracellular space as a result of neuronal activity (for example, through inwardly rectifying K+ channels, Kir). K+ diffuses through the astrocytic network via gap junctions (GJ) down its concentration gradient and is released in sites of lower concentration. Pink: Glutathione metabolism. Astrocytes release glutathione (GSH) in the extracellular space, where it is cleaved by the astrocytic ectoenzyme γ-glutamyl transpeptidase (γGT). The resulting dipeptide CysGly is cleaved by the neuronal ectopeptidase aminopeptidase N (ApN), forming Cysteine (Cys) and Glycine (Gly), which serve as precursors for neuronal GSH synthesis. X represents an acceptor for the γ-glutamyl moiety (γGlu) in the reaction catalyzed by γGT. A detailed description of these neuron-astrocyte metabolic cooperations can be found elsewhere (see, for example, Bélanger & Magistretti, 2009, and references therein).
Reproduced with permission from Allaman et al. (2011).
Processes Linked to Neuronal Function Consume Energy
The main energy-consuming process of the brain is the maintenance of ionic gradients across the plasma membrane, a condition that is crucial for excitability. Indeed, neuronal signaling is based on the rapid flow of charges—carried by ions such as sodium, potassium, and calcium—across the membranes of the axon, dendrites, and soma. This is not expected to cost much per se, as the flow of ions follows favorable electrochemical gradients; however, reestablishing these constantly dissipated gradients, through the activity of ATP-consuming pumps such as the Na+/K+-ATPase, does indeed cost energy. As extensively reviewed in Chapters 5 and 10, two principal processes operate the signaling between neurons: the action potentials (AP) mainly carrying signals along the axon from the soma to the synapse (some APs, defined as backpropagating, are also generated in dendrites) and postsynaptic potentials (PSP), generated by synaptically released neurotransmitters acting at specific receptors present on dendrites and soma. Which of the AP and the PSP is more energetically costly? This question has been at the center of a long-standing debate in neuroscience. Early estimates in 1980s suggested that the energetic cost of signaling in the brain was dominated by PSPs. More recently, bottom-up energy budgets, in which the costs of each step of signaling were estimated, have proposed that APs and PSPs equally contribute to the energy consumption associated with neuronal activity in rodents (Attwell & Iadecola, 2002).
This is not just a question that excites neurophysiology aficionados: it has direct relevance for the interpretation of functional brain imaging signals because of the tight coupling between neuronal signaling and energy utilization. Experiments in which neuronal activity has been recorded while acquiring imaging data suggest that local field potentials, which reflect PSPs, best correlate with the imaging signal. In a series of elegant studies carried out in the rat hippocampus, Alle and colleagues have shown that the relative kinetic properties of sodium and potassium channels present on axons optimize the energy utilization necessary for APs generation. As described in Chapter 5, APs are produced by the sequential opening of voltage-sensitive sodium channels, resulting in a depolarization by allowing positive charges to flow from the extracellular space across the neuronal membrane; this is followed by the delayed opening of potassium channels (hence their name “delayed rectifiers”) that elicits the exit of positive charges and contributes to the repolarization of the membrane. If the temporal overlap between the entry of sodium and the outflow of potassium is high, the system will be relatively inefficient, because a larger number of positive charges—that is, sodium ions—will have to enter the cell in order to achieve a given depolarization. This is because, in terms of positive charges, the exit of potassium will partially counterbalance the entry of sodium. On the contrary, a low temporal overlap will optimize conditions to achieve depolarization. Calculations based on the biophysical properties of neuronal membranes predict a minimum positive charge transfer (carried by sodium) per propagating action potential of 121 nanoCoulombs/cm2.
In their classical modeling of the AP in the squid giant axon, Hodgkin and Huxley estimated that this minimum was to be 4 times higher in order to charge the membrane capacitance and elicit depolarization. In axons of the rat hippocampus, the sodium channel rapid activation and fast decay relative to the delayed onset of potassium currents result in optimal charge separation (i.e., minimal overlap of the inward and outward currents). Under these circumstances, charging the membrane capacitance requires 153 nanoCoulombs/cm2, representing only 1.3 times the theoretical minimum. In previous energy budget estimates, a factor of 4 was used to approximate the sodium charge transfer per propagating AP (see Attwell & Iadecola, 2002), resulting in an overestimation of the actual number of picomoles of sodium ions flowing across the axonal membrane per surface unit per action potential. Since reestablishing intracellular sodium homeostasis is operated by the energy-consuming sodium-potassium ATPase, an overestimation of sodium transfer will result in an overestimation of the energy cost of APs by a factor of approximately 3 (4:1.3).
Comparison of the charge transfer due to excitatory PSPs mediated by the glutamate receptor activation indicates that the charge transfer involved in AP is about 6 times lower than that underlying PSPs—15 versus 96 picoCoulombs, respectively—with marginal contributions by backpropagating APs (3 pC) and depolarization of presynaptic terminals (1 pC). Translated into energy costs, these measurements indicate that PSPs dominate the energy requirements for neuronal signaling. Since glutamate synapses represent at least 80% of cortical synapses, these data support previous experimental results in vivo and in vitro, suggesting that glutamatergic neurotransmission is the major determinant of energy utilization by the brain (Hyder et al., 2006). As will be discussed in subsequent sections, coupling of glutamatergic transmission to local energy (glucose) delivery is mediated by glutamate signaling on astrocytes via glutamate transporters. This astrocyte-based coupling mechanism and the associated process of glutamate recycling represent only approximately 15% of the overall energy cost of glutamatergic neurotransmission (Hyder et al., 2006).
In addition to the maintenance of ionic gradients that are disrupted during activity, other energy-consuming processes exist in neurons. Thus, the permanent synthesis of molecules needed for communications, such as neurotransmitters, or for general cellular purposes consumes energy. Axonal transport of molecules synthesized in the nucleus to their final destination along the axon or at the axon terminal is yet another process fueled by cellular energy metabolism.
Summary
Exactly as in other tissues, the metabolism of glucose, the main energy substrate of the brain, produces two forms of energy: ATP and NADPH. Glycolysis and the TCA cycle produce ATP, whereas energy in the form of reducing equivalents stored in the NADPH molecule is produced predominantly through the pentose phosphate pathway. Reduced glutathione provides a major defense against oxidative stress. It is mainly synthetized in astrocytes, implying that neurons rely on astrocytes to provide them with GSH (through the shuttling of GSH) for protection against oxidative stress insults. Maintenance of the electrochemical gradients, particularly for Na+ and K+, mainly dissipated by glutamate-mediated postsynaptic potentials is the principal energy-consuming process of neural cells.
Glutamate Metabolism: A Coordinated Shuttle Between Astrocytes and Neurons
Astrocytes are known to play a major role in numerous functions of the central nervous system, including glutamate, ion and water homeostasis, defense against oxidative stress, energy storage in the form of glycogen, scar formation and tissue repair, modulation of synaptic activity via the release of gliotransmitters, and synapse formation and remodeling. Importantly, essential astrocytic functions involve strong metabolic cooperations with neighboring neurons. Such a metabolic interaction has been reviewed earlier in this chapter for GSH metabolism but is also operative for K+ and pH buffering, ascorbic acid recycling, energy substrate delivery, and glutamate metabolism in the so-called glutamate-glutamine shuttle (Allaman et al., 2011; Bélanger & Magistretti, 2009) (Fig. 12. 8). The latter represents a key function of astrocytes, which play a critical role in the regulation of glutamate neurotransmission.
Indeed, synaptically released glutamate is removed rapidly from the extracellular space by a transporter-mediated reuptake system that is particularly efficient in astrocytes. This mechanism contributes in a crucial manner to the fidelity of glutamate-mediated neurotransmission. Indeed, glutamate levels in the extracellular space are low (<3 μM), allowing for optimal glutamate-mediated signaling after depolarization while preventing overactivation of glutamate receptors, which could eventually result in excitotoxic neuronal damage.
Five glutamate transporter subtypes have been cloned in various species, including humans. The excitatory amino acid transporter 1 (EAAT 1) and EAAT 2 subtypes (respectively GLAST and GLT-1 in rodents) are localized exclusively in astrocytes, whereas the EAAT 3 and 4 are predominantly localized in neurons, with a widespread distribution for EAAT 3 and a localized distribution to Purkinje neurons for EAAT 4. EAAT 5 is localized in rod photoreceptors and in bipolar cells of the retina. The density of EAAT 1 and 2 is particularly high on astrocytes that surround axon terminals and dendritic spines, consistent with the prominent role of these transporters in the reuptake of synaptically released glutamate. The driving force for glutamate uptake through the specific transporters is the transmembrane Na+ gradient; indeed, glutamate is cotransported with Na+ with a stoichiometry of one glutamate for three Na+ ions. The selective loss of EAAT 2, the astrocyte-selective glutamate transporter, has been demonstrated in the motor cortex and spinal cord of patients who died of Amyotrophic Lateral Sclerosis, a neurodegenerative disease affecting motor neurons.
One may wonder how astrocytes dispose of the glutamate that they take up, because, unlike carbohydrates or lipids, amino acids cannot be stored. The predominant pathway in peripheral tissues for disposing of amino acids is the transfer of their α amino group to a corresponding α-keto acid; this reaction is catalyzed by aminotransferases (Fig. 12.9). In astrocytes, the α amino group of glutamate can be transferred to oxaloacetate to yield α-ketoglutarate (α-KG) and aspartate in a reaction catalyzed by aspartate amino transferase (AAT). The α-KG generated is an intermediate of the TCA cycle and is therefore oxidized further. Another transamination reaction catalyzed by alanine amino transferase (ALAT) transfers the α amino group of glutamate to pyruvate, resulting in the formation of alanine and α-KG.
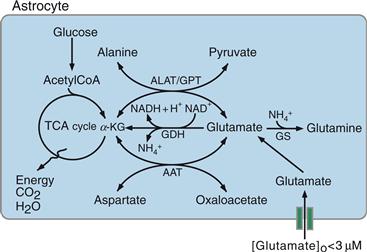
Figure 12.9 Metabolic fate of glutamate taken up by astrocytes. ALAT, alanine aminotransferase; GDH, glutamate dehydrogenase; GS, glutamine synthase; AAT, aspartate aminotransferase; GPT, glutamate dehydrogenase; α-KG, α-ketoglutarate.
Two other pathways exist in astrocytes to metabolize glutamate. First, glutamate can be converted directly into α-KG through an NAD-requiring oxidative deamination catalyzed by glutamate dehydrogenase (GDH) (Fig. 12.9). Glutamate, by entering the TCA cycle indirectly (through AAT or ALAT) or directly (through GDH), is an energy substrate for astrocytes. Second, the quantitatively predominant metabolic pathway of glutamate in astrocytes is its amination to glutamine, an ATP-requiring reaction in which an ammonium ion is fixed on glutamate (Figs. 12.9 and 12.10). This reaction is catalyzed by glutamine synthase (GS), an enzyme almost exclusively localized in astrocytes, and provides an efficient means of disposing not only of glutamate but also of ammonium (see Box 12.2). Glutamine is released by astrocytes and is taken up by neurons, where it is hydrolyzed back to glutamate by the phosphate-dependent enzyme glutaminase. This metabolic pathway is often referred to as the glutamate-glutamine shuttle (Figs. 12.8 and 12.10). It allows the removal of potentially toxic excess glutamate from the extracellular space, while returning to the neuron a synaptically inert (glutamine does not affect neurotransmission) precursor with which to regenerate the neuronal pool of glutamate.
Box 12.2 Hepatic Encephalopathy
Hepatic encephalopathy is observed in patients with severe liver failure. The disease can be in one of two forms: an acute form, called fulminant hepatic failure, and a chronic form, called portosystemic encephalopathy. The neuropsychiatric symptoms of fulminant hepatic failure are delirium, coma, and seizures associated with acute toxic or viral hepatic failure. Patients having portosystemic encephalopathy may present personality changes, episodic confusion, or stupor and, in the most severe cases, coma. The current view on the pathophysiology of hepatic encephalopathy is that, due to liver failure, “toxic” substances that affect brain function accumulate in the circulation.
One of the substances thought to be responsible for neuropsychiatric “toxicity” is ammonia. The neuropathological findings are rather striking: astrocytes are the brain cells that appear to be principally affected. In the acute form, astrocyte swelling is prominent and likely to be the cause of the observed acute brain edema. In portosystemic encephalopathy, astrocytes adopt characteristic morphological features: in these cells, the nucleus is pale and enlarged, chromatin is marginated, and a prominent nucleolus is often observed. Lipofuscin deposits may be present, and the amount of the astrocyte-specific protein glial fibrillary acidic protein is decreased. Neurons appear structurally normal. All the foregoing histopathological changes have been reproduced in vitro by acutely or chronically applying ammonium chloride to primary astrocyte cultures. As mentioned earlier, detoxification of ammonium is an ATP-requiring, astrocyte-specific reaction catalyzed by glutamine synthase (see Figs. 12.9 and 12.10). It is therefore not surprising that excess ammonia perturbs energy metabolism; indeed, ammonia stimulates glycolysis, whereas it inhibits TCA cycle activity and decreases the glycogen content of astrocytes markedly. In addition, astrocytic accumulation of the osmotically active glutamine as a result of ammonia detoxification is thought to contribute at least partially to the swelling of astrocytes in hyperamonemic conditions.
In summary, while the precise pathophysiological mechanisms of the neuropsychiatric syndrome in hepatic encephalopathy are still unknown, this clinical condition provides a striking illustration of the fundamental importance of neuron–astrocyte metabolic interactions because structural and functional alterations apparently restricted to astrocytes result in severe behavioral perturbations.
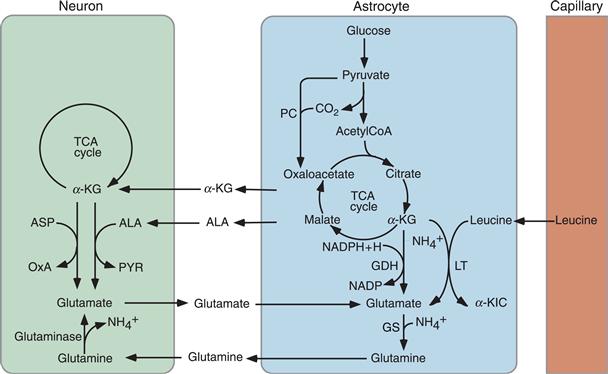
Figure 12.10 Metabolic intermediates are released by astrocytes to regenerate the glutamate neurotransmitter pool in neurons. Glutamine, formed from glutamate in a reaction catalyzed by glutamine synthase (GS), is released by astrocytes and taken up by neurons, which convert it into glutamate under the action of glutaminase. GS is an enzyme selectively localized in astrocytes. This metabolic cycle is referred to as the glutamate-glutamine shuttle. Other quantitatively less important sources of neuronal glutamate are alanine (ALA) and α-ketoglutarate (α-KG). In astrocytes, glutamate is synthesized de novo from α-KG through two different reactions catalyzed i) by glutamate dehydrogenase (GDH) and ii) by leucine transaminase (LT) producing glutamate and α-ketoisocaproate (α-KIC), in a transamination reaction in which leucine provides the amino group. Carbons “lost” from the TCA cycle as α-KG is converted to glutamate are replenished by oxaloacetate (OxA) formed from pyruvate (PYR) in a reaction catalyzed by pyruvate carboxylase (PC), another astrocyte-specific enzyme (anaplerotic cycle). ASP, aspartate.
However, not all glutamate is regenerated through the glutamate-glutamine shuttle because some of the glutamate released by neurons enters at the α-KG level, the TCA cycle in astrocytes; therefore, de novo synthesis is required to maintain the neuronal glutamate pool. Different pathways exist to synthesize glutamate both in astrocytes and neurons. In astrocytes, glutamate can be synthesized through amination of α-KG by two different pathways: GDH and leucine transaminase (LT) using leucine as a nitrogen donor (Fig. 12.10). Since these reactions take place in astrocytes, to replenish the neuronal pool, the astrocytes export glutamate as glutamine. Alternatively, neurons can take up α-KG and alanine from the extracellular space and convert them to glutamate and pyruvate in a transamination reaction catalyzed by ALAT (Fig. 12.10). In this case, as for the glutamate-glutamine shuttle, astrocytes provide the substrate(s) necessary for glutamate synthesis in neurons, since they are known to release significant amount of alanine an α-KG.
Note that because α-KG is used for glutamate synthesis, metabolic intermediates downstream of α-KG must be available to maintain a sustained flux through the TCA cycle in astrocytes (Fig. 12.10). This need is met by the activity of the enzyme pyruvate carboxylase (PC), which fixes CO2 on pyruvate to generate oxaloacetate, which, by condensing with acetyl-CoA, maintains the flux through the TCA cycle. The carboxylation of pyruvate to oxaloacetate is referred to as an anaplerotic (Greek for “fill up”) reaction. Interestingly, like glutamine synthase, PC is selectively localized in astrocytes. The fact that these two enzymes are localized in astrocytes in conjunction with the existence of a glutamate-glutamine shuttle stresses the essential role of astrocytes for maintaining the neuronal glutamate pool used for neurotransmission (Fig. 12.10).
Summary
A key function of astrocytes is to remove synaptically released glutamate. A large proportion of glutamate is transformed to glutamine through an energy-requiring process that also allows for the detoxification of ammonium. Glutamine released by astrocytes regenerates the neuronal glutamate pool. Some of the glutamate is also regenerated from astrocytic-derived metabolites either in astrocytes or neurons providing another indication of the crucial function that astrocytes play in maintaining the neuronal glutamate pool at levels that ensure the maintenance of synaptic transmission.
Brain Energy Metabolism at the Cellular Level
Glia and Vascular Endothelial Cells, in Addition to Neurons, Contribute to Brain Energy Metabolism
Neurons exist in a variety of sizes and shapes and express a large spectrum of firing properties (see Chapter 3). These differences are likely to imply specific energy demands; for example, large pyramidal cells in the primary motor cortex, which must maintain energy-consuming processes such as ion pumping over a large membrane surface or axonal transport along several centimeters, are likely to have considerably larger energy requirements than local interneurons. However, it is now clear that other cell types of the nervous system—glia and vascular endothelial cells—not only consume energy but also play a crucial role in the flux of energy substrates to neurons. Arguments for such an active role for nonneuronal cells—in particular, glia—are both quantitative and qualitative. Glial cells make up approximately half of the brain volume. A conservative figure is a 1:1 ratio between the number of astrocytes, one of the predominant glial cell types (see Chapters 1 and 3), and neurons. Higher ratios have been described, depending on the regions, developmental ages, or species. Indeed, the astrocyte-to-neuron ratio increases with the size of the brain and is thus high in humans. It is therefore clear that glucose reaching the brain parenchyma provides energy substrates to a variety of cell types, only some of which are neurons.
Even more compelling for the realization of the key role that astrocytes play in providing energy substrates to active neurons are the cytological relations that exist among brain capillaries, astrocytes, and neurons. These relations, which are illustrated in Figure 12.11, are as follows. First, through specialized processes, called end feet, astrocytes surround brain capillaries. This implies that astrocytes contribute to the first cellular barrier that glucose entering the brain parenchyma encounters and make them a likely site of prevalent glucose uptake and energy substrate distribution. More than a century ago, the Italian histologist Camillo Golgi and his pupil Luigi Sala sketched such a principle. In addition to perivascular end feet, astrocytes bear processes that ensheathe synaptic contacts and express receptors and uptake sites with which neurotransmitters released during synaptic activity can interact (in particular glutamate, see previous sections) (Chapters 6 and 7). These features endow astrocytes with an exquisite sensitivity to detect increases in synaptic activity. In addition to this, and as previously described, astrocytes establish with neurons numerous metabolic cooperations that play a central role in brain homeostasis (Fig. 12.8). In summary, because of the foregoing structural and functional characteristics, astrocytes are ideally suited to couple local changes in neuronal activity with coordinated adaptations in energy metabolism (Fig. 12.11).
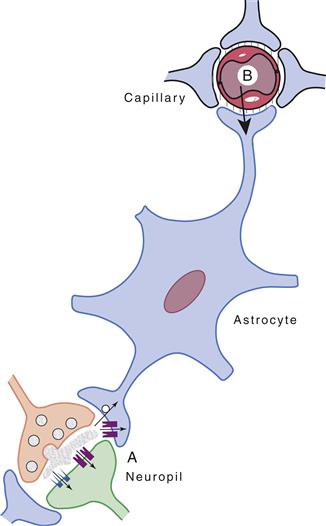
Figure 12.11 Schematic representation of cytological relations existing among intraparenchymal capillaries, astrocytes, and the neuropil. Astrocyte processes surround capillaries (end feet) and ensheathe synapses. In addition, receptors and uptake sites for neurotransmitters are present on astrocytes. These features make astrocytes ideally suited to sense synaptic activity (A) and to couple it with uptake and metabolism of energy substrates originating from the circulation (B).
A Tightly Regulated Glucose Metabolism Occurs in All Cell Types of the Brain, Neuronal and Nonneuronal
Given the high degree of cellular heterogeneity of the brain, understanding the relative role played by each cell type in the flux of energy substrates has largely depended on the availability of purified preparations, such as primary cultures enriched in neurons, astrocytes, or vascular endothelial cells. Such preparations have some drawbacks because they may not necessarily express all the properties of the cells in situ. In addition, one of the parameters of energy metabolism in vivo—namely, blood flow—cannot be examined in cultures. Despite these limitations, in vitro studies in primary cultures have proved very useful in identifying the cellular sites of glucose uptake and its subsequent metabolic fate—particularly, glycolysis and oxidative phosphorylation—thus providing illuminating correlations of two parameters of brain energy metabolism that are monitored in vivo: glucose utilization and oxygen consumption.
Glucose Transporters in the Brain
Glucose is a highly hydrophilic molecule that enters cells through a facilitated transport mediated by specific transporters. Twelve genes, encoding glucose transporter proteins, have been identified and cloned so far; these are designated GLUT1 to GLUT12. Glucose transporters belong to a family of rather homologous glycosylated membrane proteins with 12 transmembrane-spanning domains, and both amino and carboxyl terminals are exposed to the cytoplasmic surface of the membrane. In the brain, seven transporters are expressed predominantly in a cell-specific manner: GLUT1 (two isoforms), GLUT2-5, and GLUT8 (Fig. 12.12).
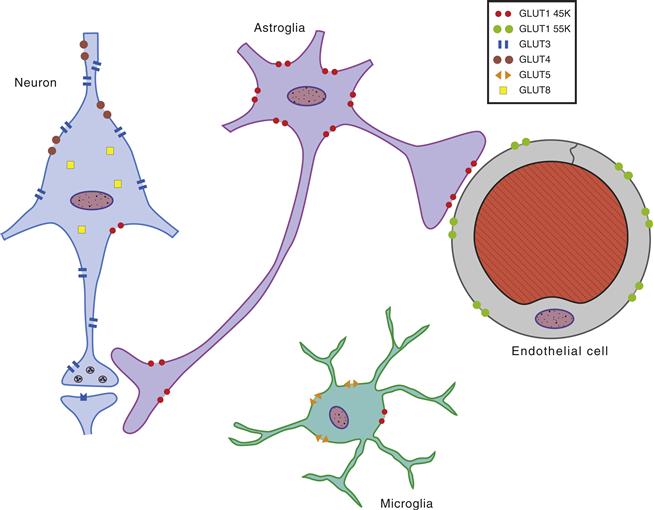
Figure 12.12 Cellular distribution of the principal glucose transporters in the nervous system. The 55-kDa form of GLUT1 is localized in brain microvessels, choroid plexus, and ependymal cells, whereas the 45-KDa form is localized predominantly in astrocytes. GLUT3 is specifically expressed in neurons. GLUT 4 and 8 are expressed in a subset of neurons, where their expression appears to predominate on the cell body and proximal dendrites. GLUT5 (which presents a higher affinity for fructose than glucose) is localized selectively to microglial cells. Another glucose transporter, GLUT2, has been localized selectively in astrocytes of discrete brain areas, such as certain hypothalamic and brainstem nuclei, which participate in the regulation of feeding behavior and in the central control of insulin release (not shown).
GLUT 1 and 3 represent the two major cerebral GLUTs. Two isoforms of GLUT1 with molecular masses of 55 and 45 kDa, respectively, are detected in the brain, depending on their degree of glycosylation. The 55-kDa form of GLUT1 is essentially localized in brain microvessels, choroid plexus, and ependymal cells. In the brain in situ, the 45-kDa form of GLUT1 is localized predominantly in astrocytes. Under culture conditions, all neural cells, including neurons and other glial cells, can express GLUT1; however, this phenomenon appears to be due to the capacity of GLUT1 to be induced by cellular stress. As opposed to GLUT1, the glucose transporter specific for neurons is GLUT3; it is widely expressed across the different neuronal types. Its cellular distribution appears to predominate in the neuropil.
It is clear that glucose uptake into the brain parenchyma is a highly specified process regulated in a cell-specific manner by glucose transporter subtypes. Figure 12.12 summarizes this process: Glucose enters the brain through 55-kDa GLUT1 transporters localized on endothelial cells of the blood-brain barrier, thus representing the first barrier for the transport of circulating glucose into the brain parenchyma. Uptake into astrocytes is mediated by 45-kDa GLUT1 transporters, whereas GLUT3 transporters mediate this process in neurons.
Cell-Specific Glucose Uptake and Metabolism
With respect to their different physiological roles, astrocytes and neurons express different metabolic phenotypes (Fig. 12.8). As previously reviewed, specific functions of astrocytes, in particular with regard to astrocyte-neuron metabolic interactions, rely on the selective expression of key proteins (e.g., PC, EAAT1 and 2 or GS). Such differences in metabolic profiles also operate for glucose metabolism. Indeed, cell type–specific expression patterns of key genes regulating energy metabolism have been shown (see, for example, Bélanger et al., 2011, and references therein) for glucose (see above) and MCTs, for genes involved in the regulation of the transfer of NADH into the mitochondria (i.e., malate-aspartate shuttle and glycerol phosphate shuttle), and for metabolic fluxes of glucose, including mitochondrial activity, of glycogen synthesis or glycolysis. For example, glucose storage in the form of glycogen is exclusively found in astrocytes (see below), in part because the glycogen synthesis machinery is kept inactive in neurons through proteasomal-dependent mechanisms (see Bélanger et al., 2011). Adaptation of energy metabolism to increased energy demand also presents differences between the two cell types. For instance, in a series of elegant studies Moncada, Bolanos, and their collaborators observed that, in contrast to astrocytes, neurons are unable to prevent nitrosative stress damages through upregulation of glycolysis due to the virtual absence of a key regulator of glycolysis in this cell type. Further stressing the specificity in their metabolic profile, manipulations that drive neurons to increase glucose utilization or to synthetize glycogen affect their survival (see Bélanger et al., 2011). In summary, neurons and astrocytes preferentially use different (but complementary) metabolic pathways with regard to glucose metabolism under physiological conditions.
As we have seen, glucose utilization can be assessed with radioactively labeled 2-DG. To determine the cellular site of basal and activity-related glucose utilization, this technique has been applied to homogeneous cultures of astrocytes or neurons. For quantitative purposes and to allow comparisons with in vivo studies, these in vitro experiments, in which radioactive 2-DG is used as a tracer, must be conducted in a medium containing a concentration of glucose near that measured in vivo in the extracellular space of the brain (0.5 to 2 mM). The basal rate of glucose utilization is higher in astrocytes than in neurons, with values of about 20 and 6 nmol per milligram of protein per minute, respectively (Magistretti & Pellerin, 1999). These values are of the same order as those determined in vivo for cortical gray matter (10–20 nmol mg–1 min–1) with the 2-DG autoradiographic technique. In view of this difference and of the quantitative preponderance of astrocytes compared with neurons in the gray matter, these data reveal a significant contribution by astrocytes to basal glucose utilization as determined by 2-DG autoradiography or PET in vivo. High-resolution microautoradiographic imaging has indicated an approximately even distribution of 2-DG in neurons and astrocytes.
The contribution of astrocytes to glucose utilization during activation appears to be even more striking. In vitro, activation can be mimicked by exposure of the cells to glutamate, the principal excitatory neurotransmitter (Chapter 6), because, during activation of a given cortical area, the concentration of glutamate in the extracellular space increases considerably due to its release from the axon terminals of activated pathways. L-glutamate stimulates 2-DG uptake and phosphorylation by astrocytes in a concentration-dependent manner, with an EC50 of 60 to 80 μM (Pellerin & Magistretti, 1994). Unlike other actions of glutamate, stimulation of glucose utilization in astrocytes is mediated not by specific glutamate receptors, but by glutamate transporters as well. As previously described, glutamate uptake into astrocytes is mediated by cell specific transporters using transmembrane Na+ gradient as a driving force (Fig. 12.8).
Glutamate-Stimulated Uptake of Glucose by Astrocytes Is a Source of Insight into the Cellular Bases of 18F–2–DG PET in Vivo
The glutamate-stimulated uptake of glucose by astrocytes is a source of insight into the cellular bases of the activation-induced local increase in glucose utilization visualized with 18F-2-DG PET in vivo. As we have seen, focal physiological activation of specific brain areas is accompanied by increases in glucose utilization; because glutamate is released from excitatory synapses when neuronal pathways subserving specific modalities are activated, the stimulation by glutamate of glucose utilization in astrocytes provides a direct mechanism for coupling neuronal activity to glucose utilization in the brain (Fig. 12.13). The intracellular molecular mechanism of this coupling requires Na+, K+-ATPase because ouabain completely inhibits the glutamate-evoked 2-DG uptake by astrocytes (Pellerin & Magistretti, 1994). The astrocytic Na+, K+-ATPase responds predominantly to increases in intracellular Na+ (Na+i), for which it shows a Km of about 10 mM. In astrocytes, the Na+i concentration ranges between 10 and 20 mM, so Na+, K+-ATPase is set to be activated readily when Na+i rises concomitantly with glutamate uptake (Magistretti & Chatton, 2005) (Fig. 12.14). These observations indicate that a major determinant of glucose utilization is the activity of Na+, K+-ATPase. In this context, one should note that, in vivo, the main mechanism that accounts for activation-induced 2-DG uptake is the activity of Na+, K+-ATPase. It is important here to briefly consider the relative participation of the neuronal and astrocytic Na+, K+-ATPases in glucose utilization. When glutamate is released from depolarized neuronal terminals, it is taken up predominantly into astrocytes. The stoichiometry of glutamate reuptake being one molecule of glutamate cotransported with three Na+ ions, the increase in intracellular astrocytic Na+ concentration associated with glutamate reuptake massively activates the pump. Thus, although the tonic activity of the Na+, K+-ATPase is needed to maintain the transmembrane neuronal and glial ionic gradients and accounts for basal glucose utilization, on a short-term temporal scale (from milliseconds to seconds), when glutamate is released from depolarized axon terminals of modality-specific afferents, the astrocytic Na+, K+-ATPase is briskly activated, due to the massive increase (by at least 10 mM) in intracellular Na+ associated with glutamate reuptake, providing the signal for the activation-dependent glucose utilization.
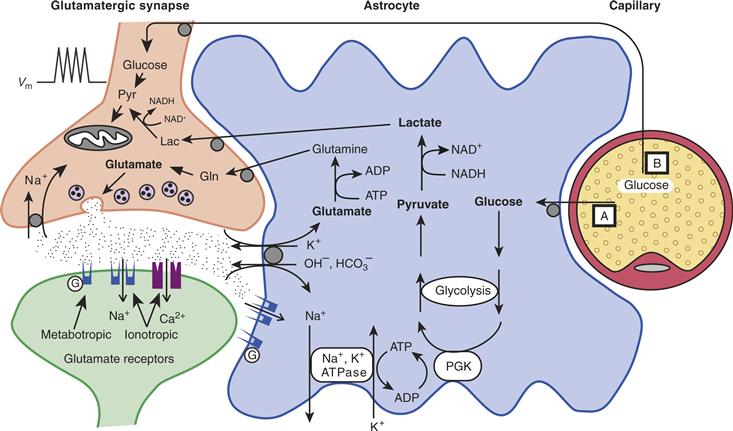
Figure 12.13 Schematic representation of the mechanism for glutamate-induced glycolysis in astrocytes during physiological activation. At glutamatergic synapses, presynaptically released glutamate depolarizes postsynaptic neurons by acting at specific receptor subtypes. The action of glutamate is terminated by an efficient glutamate uptake system located primarily in astrocytes. In fact, glutamate is taken up predominantly into astrocytes. Glutamate is cotransported with Na+, resulting in an increase in the intra-astrocytic concentration of Na+, leading to an activation of the astrocytic Na+,K+-ATPase. Activation of Na+,K+-ATPase stimulates glycolysis (i.e., glucose utilization and lactate production). The stoichiometry of this process is such that for one glutamate molecule taken up with three Na+ ions, one glucose molecule enters astrocytes, two ATP molecules are produced through glycolysis, and two lactate molecules are released. Within the astrocyte, one ATP fuels one “turn of the pump,” while the other provides the energy needed to convert glutamate to glutamine by glutamine synthase (see Fig. 12.10). Once released by astrocytes, lactate can be taken up by neurons and serve as an energy substrate (For graphic clarity, only lactate uptake into presynaptic terminals is indicated. However, this process could also take place at the postsynaptic neuron). This model, which summarizes in vitro experimental evidence indicating glutamate-induced glycolysis, is taken to show cellular and molecular events occurring during activation of a given cortical area (arrow labeled A, activation). Direct glucose uptake into neurons under basal conditions is also shown (arrow labeled B, basal conditions). Pyr, pyruvate; Lac, lactate; Gln, glutamine; G, G protein; PGK, phosphoglycerate kinase.
Modified with permission from Pellerin and Magistretti (1994).
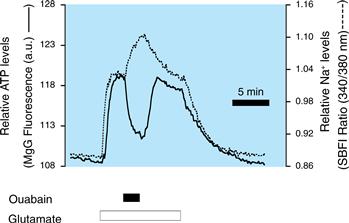
Figure 12.14 Temporal coincidence in the increase in sodium concentration and ATP consumption triggered by glutamate in astrocytes. These processes, which are dependent on the activity of the Na+,K+-ATPase as they are ouabain-sensitive, are the effectors of the glutamate-stimulated glycolysis in astrocytes (see also Fig. 12.13).
Modified with permission from Magistretti and Chatton (2005).
How does activation of Na+, K+-ATPase cause increased glucose utilization? The mechanism was explained by pioneering studies on erythrocytes by Joseph Hoffmann and colleagues at Yale University, which have been confirmed in a number of other cell systems, including brain and vascular smooth muscle. The increase in pump activity consumes ATP (Fig. 12.14), which is a negative modulator of phosphofructokinase, the principal rate-limiting enzyme of glycolysis (Fig. 12.1). Thus, when ATP concentration is low, phosphofructokinase activity is stimulated, resulting in increased glucose utilization. The activity of hexokinase, the enzyme responsible for glucose and 2-DG phosphorylation (Fig. 12.5), is also increased under these conditions. This explains why the increase in glucose utilization, associated with the stimulation of Na+,K+-ATPase, can be monitored with 2-DG, which is not processed beyond the hexokinase step.
A compartmentalization of glucose uptake during activation has also been unequivocably found by Marco Tsacopoulos and colleagues in the honeybee drone retina (Tsacopoulos & Magistretti, 1996). In this highly organized, crystal-like nervous tissue preparation, photoreceptor cells form rosette-like structures that are surrounded by glial cells. In addition, mitochondria are exclusively present in the photoreceptor neurons. Light activation reveals an increase in radioactive 2-DG uptake in the glial cells surrounding the rosettes but not in the photoreceptor neurons. An increase in O2 consumption is nevertheless measured in photoreceptor neurons. After activation of photoreceptors by light, glucose is probably taken up predominantly by glial cells, which then release a metabolic substrate to be oxidized by photoreceptor neurons.
In summary, as indicated in the operational model described in Figure 12.13, upon activation of a particular brain area, glutamate released from excitatory terminals is taken up by a Na+-dependent transporter located on astrocytes. The ensuing local increase in intracellular Na+ concentration activates Na+, K+-ATPase, which in turn stimulates glucose uptake by astrocytes. The key role of glial glutamate transporters in activity-dependent glucose uptake by the brain has been demonstrated in vivo (see Bélanger et al., 2011, and references therein). This model delineates a simple mechanism for coupling synaptic activity to glucose utilization; in addition, it is consistent with the notion that the signals detected during physiological activation in humans with 18F-2-DG PET and autoradiography in laboratory animals may predominantly reflect uptake of the tracer into astrocytes. Recently, in the well-studied whisker-to-barrel somatosensory pathway, Buzsaki and colleagues have demonstrated a selective increase in glucose uptake into astrocytes during activation. The model originally proposed by Pellerin and Magistretti (1994) does not question the validity of the 2-DG-based techniques; rather, it provides a cellular and molecular basis for these functional brain-imaging techniques (Magistretti & Pellerin, 1999).
Lactate Released by Astrocytes Is a Metabolic Substrate for Neurons
The fact that the increase in glucose uptake during activation can be ascribed predominantly, if not exclusively, to astrocytes indicates that energy substrates must be released by astrocytes to meet the energy demands of neurons. As indicated earlier, lactate and pyruvate are adequate substrates for brain tissue in vitro (Schurr, 2006). In fact, synaptic activity can be maintained in vitro in cerebral cortical slices with only lactate or pyruvate as a substrate. Lactate is quantitatively the main metabolic intermediate released by cultured astrocytes at a rate of 15 to 30 nmol per milligram of protein per minute. For lactate (or pyruvate) to be a metabolic substrate for neurons, particularly during activation, two additional conditions must be fulfilled: (1) that indeed during activation lactate release by astrocytes increases, and (2) lactate uptake by neurons must be demonstrated. Both mechanisms have been indeed demonstrated. Mimicking activation in vitro by exposing cultured astrocytes to glutamate results in a marked release of lactate and, to a lesser degree, pyruvate (Pellerin & Magistretti, 1994). This glutamate-evoked lactate release shows the same pharmacology and time course as glutamate-evoked glucose utilization and indicates that glutamate stimulates the processing of glucose through glycolysis. In vivo 1H MRI studies in humans that show a transient lactate peak in different brain areas during physiological stimulation (Figley & Stroman, 2011, and references therein) are consistent with the notion of activation-induced transient glycolysis. Finally, MCTs have been demonstrated on neurons and astrocytes in addition to capillaries.
Thus, a metabolic compartmentation whereby glucose taken up by astrocytes and metabolized glycolytically to lactate is then released in the extracellular space to be utilized by neurons is consistent with biochemical and electrophysiological observations (Bélanger et al., 2011; Hyder et al., 2006; Tsacopoulos & Magistretti, 1996). This array of in vitro and in vivo experimental evidence, known as the Astrocyte-Neuron Lactate Shuttle (ANLS), is summarized in the model of cell-specific metabolic regulation illustrated in Figure 12.13.
Studies of the well-compartmentalized honeybee drone retina and of isolated preparations of guinea pig retina containing photoreceptors attached to Mueller (glial) cells corroborate the existence of such metabolic fluxes between glia and neurons. In addition to the glial localization of glucose uptake during activation, glycolytic products have been shown to be released. In particular, during activation, glial cells in the honeybee drone retina release alanine produced from pyruvate by transamination; the released alanine is taken up by photoreceptor neurons and, after reconversion into pyruvate, can enter the TCA cycle to yield ATP through oxidative phosphorylation (Fig. 12.2). In the guinea pig retina, lactate, formed glycolytically from glucose, is released by Mueller cells to fuel photoreceptor neurons (Tsacopoulos & Magistretti, 1996).
In addition to plasma lactate, which is imported into the brain to a limited extent or during specific conditions (see above), lactate formed within the brain parenchyma (e.g., through glutamate-activated glycolysis in astrocytes) can thus fulfill the energetic needs of neurons. Lactate, after conversion into pyruvate by a reaction catalyzed by lactate dehydrogenase (LDH), can provide, on a molar basis, 14 to 17 ATPs through oxidative phosphorylation. Conversion of lactate to pyruvate does not require ATP, and, in this regard, lactate is energetically more favorable than the first obligatory step of glycolysis in which glucose is phosphorylated to glucose 6-phosphate at the expense of one molecule of ATP (Fig. 12.1). In addition, lactate may contribute to the redox potential of neurons, since through its conversion to pyruvate, it generates NADH, hence providing energy in the form of reducing equivalents useful for a variety of metabolic reactions but also for ROS scavenging after its conversion to NADPH (Fig. 12.7). Another metabolic fate for lactate has been shown in vitro and in vivo by MRS. Thus, once converted to pyruvate in neurons, lactate may enzymatically yield glutamate and thus be a substrate for the replenishment of the neuronal pool of glutamate. Because this reaction is not associated with oxygen consumption, part of the uncoupling between glucose utilization and oxygen consumption described in certain paradigms of activation may be explained by the processing of glucose-derived lactate into the glutamate neuronal pool; another reason for such an uncoupling may be the use of glucose for non-energy-yielding processes such as its incorporation into certain macromolecules (glycoproteins and glycolipids).
Very recent evidence demonstrates that in addition to its role as an energy substrate, astrocytic-derived lactate also participates in the control of neuronal activity. For instance, effects of lactate on neuronal excitability have been observed for glucose-sensing and orexin neurons in the hypothalamus, as well as GABAergic neurons in the subfornical organ (see Bélanger et al., 2011, and references therein). Although the mechanism(s) of action of lactate in this context are not yet fully characterized, they appear to critically involve ATP-sensitive K+ channels (KATP) (see Bélanger et al., 2011, and references therein). In this case, increased ATP concentration, produced by lactate oxidation, would trigger the closure of KATP channels leading to membrane depolarization and neuronal activation, providing a mechanism that links lactate release by astrocytes, lactate utilization by neurons, and modulation of neuronal excitability (see Chapter 5). These observations add another level of interaction between astrocytes and neurons with regards to energy metabolism.
Glycogen, the Storage Form of Glucose, Is Localized in Astrocytes
Glycogen is the single largest energy reserve of the brain; it is mainly localized in astrocytes, although ependymal and choroid plexus cells, as well as certain large neurons in the brainstem, contain glycogen. When compared to the contents in liver and muscle, the glycogen concentration in the brain is exceedingly small, about 100 and 10 times inferior, respectively.
Glycogen Metabolism Is Coupled to Neuronal Activity
Glycogen turnover in the brain is extremely rapid, and glycogen levels are finely coordinated with synaptic activity. For example, during general anesthesia, a condition in which synaptic activity is markedly attenuated, glycogen levels rise sharply. Interestingly, however, the glycogen content of cultures containing exclusively astrocytes is not increased by general anesthetics; this observation indicates that the in vivo action of general anesthetics on astrocyte glycogen is due to the inhibition of neuronal activity, stressing the existence of a tight coupling between synaptic activity and astrocyte glycogen. Accordingly, reactive astrocytes, which develop in areas where neuronal activity is decreased or absent as a consequence of injury, contain high amounts of glycogen.
Certain Neurotransmitters Regulate Glycogen Metabolism in Astrocytes
Glycogen levels in astrocytes are tightly regulated by various neurotransmitters. Several monoamine neurotransmitters—namely, noradrenaline, serotonin, and histamine—are glycogenolytic in the brain, in addition to certain peptides, such as VIP and pituitary adenylate cyclase activating peptide (PACAP), and adenosine and ATP. The effects of all these neurotransmitters are mediated by their cogent specific receptors coupled to second messenger pathways that are under the control of adenylate cyclase or phospholipase C. These observations show that neuronal signals (e.g., certain neurotransmitters) can exert receptor-mediated metabolic effects on astrocytes in a manner similar to peripheral hormones on their target cells. However, the action of this type of neurotransmitter is temporally specified and spatially restricted to activated areas. Indeed, brain glycogenolysis in laboratory animals has also been demonstrated in vivo after physiological activation of modality-specific pathways (see Bélanger et al., 2011, and references therein). These observations indicate that the physiological activation of specific neuronal circuits results in the mobilization of glial glycogen store.
The initial rate of glycogenolysis activated by VIP and noradrenaline measured in in vitro or ex vivo preparations is between 5 and 10 nmol per milligram of protein per minute, a value that is remarkably close to glucose utilization of the gray matter, as determined by the 2-DG auto-radiographic method. This correlation indicates that glycosyl units mobilized in response to glycogenolytic neurotransmitters can provide quantitatively adequate substrates for the energy demands of the brain parenchyma. While glycogen mobilization may also fulfill the astrocytes’ own metabolic needs, glycogen breakdown typically results in lactate production and release in the extracellular space. Consistent with its role as a neuronal energy substrate, glycogen-derived lactate was demonstrated to preserve axonal function in conditions of energy deprivation. It was also observed that astrocytic glycogen mobilization is required to sustain neuronal activity during intense stimulation in a mouse optic nerve preparation (see Bélanger et al., 2011, and references therein). Furthermore, recent data indicate a critical role of glycogen metabolism in higher brain functions. Thus, glycogen-derived lactate, and its transfer to neurons, is necessary for the establishment of long-term memory formation and for the maintenance of long-term potentiation (LTP) in vivo (see Bélanger et al., 2011).
Summary
Under basal conditions, glucose uptake and metabolism occur in every brain cell type. Glucose uptake is mediated by specific transporters that are distributed in a cell-specific manner. Astrocytes play a critical role in the utilization of glucose coupled to excitatory synaptic transmission. The molecular mechanisms of this coupling are stoichiometrically directed: for each synaptically released glutamate molecule taken up with three Na+ ions by an astrocyte, one glucose molecule enters the same astrocyte, two ATP molecules are produced through glycolysis, and two lactate molecules are released and consumed by neurons to yield 14-17 ATPs through oxidative phosphorylation. Neuronal signals—for example, certain neurotransmitters—can exert receptor-mediated glycogenolysis in astrocytes in a manner similar to peripheral hormones on their target cells. However, this type of effect by neurotransmitters is temporally specified and spatially restricted within activated areas, possibly to provide additional energy substrates (i.e., lactate) in register with local increases in neuronal activity. This glycogen-derived lactate is critical for the expression of synaptic plasticity.
The Astrocyte-Neuron Metabolic Unit
From a strictly energetic viewpoint, the brain can be seen as an almost exclusive glucose-processing machine producing H2O and CO2. However, the metabolism of glucose in the brain is specified temporally, spatially, and functionally. Thus, glucose metabolism increases with exquisite spatiotemporal precision in register with neuronal activity. The site of this increase is not the neuronal cell body; rather, it is the neuropil, where presynaptic terminals, postsynaptic elements, and astrocytes ensheathing synaptic contacts are localized. This cytological relation between astrocytes and neurons is also manifested by a functional metabolic partnership that operates as one of the major elements at the basis of neurovascular and neurometabolic coupling (Fig. 12.15). In response to a neuronal signal (glutamate), glucose is taken up by perivascular astrocytes (neurometabolic coupling) through a glutamate transporter-mediated mechanism and released as a glucose-derived metabolic substrate for neurons (lactate), and vasoactive agents are released by astrocytes and neurons to increase CBF (neurovascular coupling) involving receptor-mediated mechanisms (Fig. 12.15).
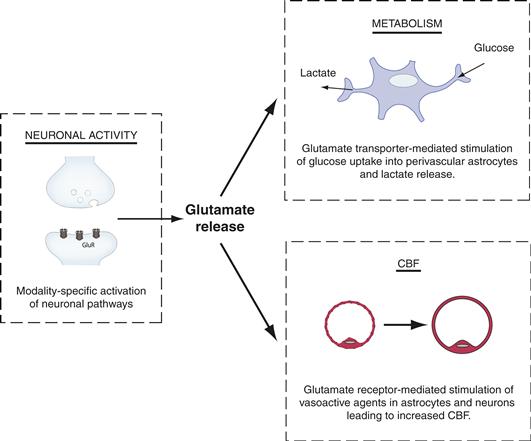
Figure 12.15 Coupling “in-parallel” of neuronal activity with CBF and energy metabolism (i.e., glucose use). See text for discussion. GluR: Glutamate receptor.
Modified from Magistretti and Pellerin (1999).
Glucose also provides the carbon backbone for regeneration of the neuronal pool of glutamate. This process results from a close astrocyte-neuron cooperation. Indeed, the selective localization of PC in astrocytes, indicating the need to replenish the TCA cycle with carbon backbones, strongly suggests that glucose-derived metabolic intermediates are used for glutamate (and other amino acid) synthesis. The newly synthesized glutamate is not provided as such by astrocytes to neurons; rather, it is converted to glutamine by GS, another enzyme localized selectively in astrocytes. Glutamate, taken up by astrocytes during synaptic activity, undergoes the same metabolic process, also being released as glutamine (the glutamate-glutamine shuttle).
Summary
In conclusion, the axon terminal of glutamatergic neurons, which are the main communication lines in the nervous system, and the astrocytic processes that surround them should be viewed as a metabolic unit in which the neuron furnishes the activation signal (glutamate) to the astrocyte and the astrocyte provides not only the precursors needed to maintain the neurotransmitter pool (i.e., mainly glutamine), but also the energy substrate (lactate) (Fig. 12.16). The efficacy of the predominant excitatory synapse in the brain, the glutamatergic synapse, cannot be maintained without a close astrocyte-neuron interaction. Furthermore, evidence is accumulating that indicates that dysfunctions of this neuron-astrocyte metabolic cooperation are likely to be involved in pathological conditions, in particular neurodegeneration (Allaman et al., 2011; Bélanger & Magistretti, 2009).
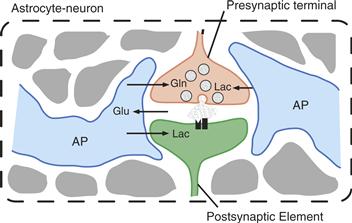
Figure 12.16 The astrocyte-neuron metabolic unit. Glutamatergic terminals and the astrocytic processes that surround them can be viewed as a highly specialized metabolic unit in which the activation signal (glutamate, Glu) is provided by the neuron to the astrocyte, whereas the astrocyte provides the precursors needed to maintain the neurotransmitter pool (i.e., mainly glutamine, Gln), as well as the energy substrate (lactate, Lac). AP, astrocyte process.
References
1. Allaman I, Bélanger M, Magistretti PJ. Astrocyte-neuron metabolic relationships: For better and for worse. Trends in Neuroscience. 2011;34:76–87.
2. Attwell D, Buchan AM, Charpak S, Lauritzen M, MacVicar BA, Newman EA. Glial and neuronal control of brain blood flow. Nature. 2010;468:232–243.
3. Attwell D, Iadecola C. The neural basis of functional brain imaging signals. Trends in Neuroscience. 2002;25:621–625.
4. Bélanger M, Allaman I, Magistretti PJ. Brain energy metabolism: Focus on astrocyte-neuron metabolic cooperation. Cell Metabolism. 2011;14:724–738.
5. Bélanger M, Magistretti PJ. The role of astroglia in neuroprotection. Dialogues in Clinical Neuroscience. 2009;11:281–295.
6. Cauli B, Tong XK, Rancillac A, et al. Cortical GABA interneurons in neurovascular coupling: Relays for subcortical vasoactive pathways. Journal of Neuroscience. 2004;24:8940–8949.
7. Figley CR, Stroman PW. The role(s) of astrocytes and astrocyte activity in neurometabolism, neurovascular coupling, and the production of functional neuroimaging signals. European Journal Neuroscience. 2011;33:577–588.
8. Frackowiak RSJ, Magistretti PJ, Shulman RG, Adams M. Neuroenergetics: Relevance for functional brain imaging Strasbourg: HFSP; 2001.
9. Hyder F, Patel AB, Gjedde A, Rothman DL, Behar KL, Shulman RG. Neuronal-glial glucose oxidation and glutamatergic-GABAergic function. Journal of Cerebral Blood Flow & Metabolism. 2006;26:865–877.
10. Magistretti PJ, Chatton JY. Relationship between L-glutamate-regulated intracellular Na(+) dynamics and ATP hydrolysis in astrocytes. Journal of Neural Transmission. 2005;112:77–85.
11. Magistretti PJ, Pellerin L. Cellular mechanisms of brain energy metabolism and their relevance to functional brain imaging. Philosophical Transactions of the Royal Society of London Series B, Biological Sciences. 1999;354:1155–1163.
12. Pellerin L, Magistretti PJ. Glutamate uptake into astrocytes stimulates aerobic glycolysis: A mechanism coupling neuronal activity to glucose utilization. Proceedings of the National Academy of Sciences of the United States of America. 1994;91:10625–10629.
13. Petzold GC, Murthy VN. Role of astrocytes in neurovascular coupling. Neuron. 2011;71:782–797.
14. Raichle ME, Mintun MA. Brain work and brain imaging. Annual Review of Neuroscience. 2006;29:449–476.
15. Schurr A. Lactate: The ultimate cerebral oxidative energy substrate?. Journal of Cerebral Blood Flow and Metabolism. 2006;26:142–152.
16. Tsacopoulos M, Magistretti PJ. Metabolic coupling between glia and neurons. Journal of Neuroscience. 1996;16:877–885.