Chapter 10
Postsynaptic Potentials and Synaptic Integration
The study of synaptic transmission in the central nervous system (CNS) provides an opportunity to learn more about the diversity and richness of mechanisms underlying this process and to learn how some of the fundamental signaling properties of the nervous system, such as action potentials and synaptic potentials, work together to process information and generate behavior.
Postsynaptic potentials (PSPs) in the CNS can be divided into two broad classes on the basis of mechanisms and, generally, duration of these potentials. One class is based on the direct binding of a transmitter molecule(s) with a receptor-channel complex; these receptors are ionotropic. The structure of these receptors is discussed in detail in Chapter 8. The resulting PSPs are generally short-lasting and thus sometimes are called fast PSPs; they have also been referred to as “classical” because they were the first synaptic potentials to be recorded in the CNS (Eccles, 1964; Spencer, 1977). The duration of a typical fast PSP is about 20 ms.
The other class of PSPs is based on the indirect effect of a transmitter molecule(s) binding with a receptor. The receptors that produce these PSPs are metabotropic. As discussed in Chapter 8, the receptors activate G proteins (G-protein-coupled receptors; GPCRs) that affect the channel either directly or through additional steps in which the level of a second messenger is altered. The changes in membrane potential produced by metabotropic receptors can be long-lasting and therefore are called slow PSPs. The mechanisms for fast PSPs mediated by ionotropic receptors are considered first.
Ionotropic Receptors: Mediators of Fast Excitatory and Inhibitory Synaptic Potentials
The Stretch Reflex Is Useful to Examine the Properties and Functional Consequences of Ionotropic PSPs
The stretch reflex, one of the simpler behaviors mediated by the central nervous system, is a useful example with which to examine the properties and functional consequences of ionotropic PSPs. The tap of a neurologist’s hammer to a ligament elicits a reflex extension of the leg, as illustrated in Figure 10.1. The brief stretch of the ligament is transmitted to the extensor muscle and is detected by specific receptors in the muscle and ligament (Chapter 28). Action potentials initiated in the stretch receptors are propagated to the spinal cord by afferent fibers (Chapter 28). The receptors are specialized regions of sensory neurons with somata located in the dorsal root ganglia just outside the spinal column. Axons of the afferents enter the spinal cord and make excitatory synaptic connections with at least two types of postsynaptic neurons. First, a synaptic connection is made to the extensor motor neuron. As the result of its synaptic activation, the motor neuron fires action potentials that propagate out of the spinal cord and ultimately invade the terminal regions of the motor axon at neuromuscular junctions. There, acetylcholine (ACh) is released, nicotinic ACh receptors are activated, an end plate potential (EPP) is produced, an action potential is initiated in the muscle cell, and the muscle cell is contracted, producing the reflex extension of the leg. Second, a synaptic connection is made to another group of neurons called interneurons (nerve cells interposed between one type of neuron and another). The particular interneurons activated by the afferents are inhibitory interneurons because activation of these interneurons leads to the release of a chemical transmitter substance that inhibits the flexor motor neuron. This inhibition tends to prevent an uncoordinated (counteracting) movement (i.e., flexion) from occurring. The reflex system illustrated in Figure 10.1 also is known as the monosynaptic stretch reflex because this reflex is mediated by a single (“mono”) excitatory synapse in the central nervous system. Spinal reflexes are described in greater detail in Chapter 28. Box 10.1 on optogenetics describes new techniques that can identify neuronal circuits.

Figure 10.1 Features of the vertebrate stretch reflex. Stretch of an extensor muscle leads to the initiation of action potentials in the afferent terminals of specialized stretch receptors. The action potentials propagate to the spinal cord through afferent fibers (sensory neurons). The afferents make excitatory connections with extensor motor neurons (E). Action potentials initiated in the extensor motor neurons propagate to the periphery and lead to the activation and subsequent contraction of the extensor muscle. The afferent fibers also activate interneurons that inhibit the flexor motor neurons (F).
Box 10.1 Optogenetics
The brain’s complexity is evident in its hundreds (at least) of neuronal cell types, each with different cellular morphologies, gene expression profiles, patterns of synaptic connectivity, and electrophysiological properties. Understanding how neural activity underlies the sophisticated computations and behavior produced by a brain—and how it is impaired in disease states—requires the ability to dissect the brain’s complexity with the appropriate level of precision. The advent of optogenetics (light-activated genetically encoded proteins to manipulate cellular function) enables the nervous system to be dissected at an unparalleled level of specificity. This technology has ushered in a new era of neuroscience research, shedding light on aspects of brain function that less than a decade ago were wholly inaccessible.
One of the most powerful optogenetic technologies is the expanding set of single-component optogenetic tools developed from naturally occurring microbial rhodopsins. Like the rhodopsin underlying vision in the retina, the microbial rhodopsins are trans-membrane proteins which bind to the light-sensitive molecule retinal. Retinal undergoes a significant conformational change in the presence of light, which in turn catalyzes conformational changes in rhodopsin. Unlike rhodopsin in the eye, which is a G-protein-coupled receptor, many microbial rhodopsins are channels or pumps. The significance of this fact for neuroscience is that a single opsin protein (along with its bound organic co-factor retinal) fluxes ions in response to light, enabling the required functionality to be encoded in a single gene (i.e., a single-component tool).
The diverse optogenetic toolbox now enables powerful experimental control over neural activity. Channelrhodopsin-2 (ChR2) which is naturally found in the green algae Chlamydomonas reinhardtii was the first single-component optogenetic tool to be expressed in neurons, and exemplifies optogenetic capabilities. ChR2 is a non-selective cation channel that opens within microseconds following brief exposure to blue light (~470 nm). When expressed in neurons and activated by light, the flux of positive ions into the cell rapidly and reliably produces an action potential. Thus, using ChR2, an experimenter can elicit a particular desired pattern of neural firing simply by delivering the corresponding pattern of light. Such high-fidelity and temporally precise control over the neural code is unprecedented. A diverse set of optogenetic tools with complementary capabilities have arisen from multiple lines of research, including from genomic searches for novel naturally occuring microbial opsins, experimentation with chimeric proteins constructed from multiple rhodopsins, and rationally designed mutations of specific amino acids in wildtype (WT) rhodopsins. Today a wide variety of optogenetic tools exist which are faster, more reliable, more potent, and more light sensitive than WT ChR2 (e.g., ChR2-H134R, ChETA, C1V1); some of these new tools can even produce stable, long-lasting depolarizing currents for up to tens of minutes after a single brief light flash, and can be precisely activated or inactivated with different wavelengths of light (e.g., SFO, SSFO). Rhodopsins have also been produced that are sensitive to different wavelengths of light (e.g., blue, green, red), enabling simultaneous independent optogenetic control of different neural populations (e.g., VChR1, C1V1). Microbial opsins which hyperpolarize cells and inhibit action potentials such as the chloride pump halorhodopsin (NpHR) found in the halobacterium Natronomonas pharaonis have been discovered and methodically enhanced, thus enabling bidirectional control of neural activity (e.g., eNpHR3.0, eArch). Finally, there are tools which enable the optical control of intracellular signaling through G-protein-mediated molecular cascades (optoXRs). Given how rapidly these tools have been described and elaborated upon by a number of productive laboratories, the growing capabilities of optogenetic proteins will likely continue to expand.
It is important to remember that the power of optogenetics is limited by the degree to which these proteins can be selectively expressed and activated in specific neuronal cell types in vitro and in vivo. However, since the opsins are genetically encoded proteins, scientists have an arsenal of gene therapy and molecular biology techniques available to achieve selective expression in neural tissues. These include in vitro cell culture transfection, in utero electroporation, knock-in, knock-out and transgenic animals, promoter/enhancer manipulations, viral vectors, and inducible expression tools such as those involving Cre recombinase, many of which can be used in combination. Experiments in vitro can involve light delivery from mercury arc lamps, lasers, or light-emitting diodes (LEDs), and 2-photon optogenetic activation of neurons has also been achieved. In addition, both anesthetized and awake animals can be optogenetically manipulated; for in vivo stimulation laser light is typically delivered through <1 mm optical fibers, which are stereotaxically targeted to specific brain regions. Using these various gene therapy and optical approaches, neuroscientists have used optogenetic technologies in a variety of tissues and awake behaving organisms, including Caenorhabditis elegans, Drosophila, zebrafish, mouse, rat, macaque monkey in vivo, and in vitro human tissue. The era of optogenetic neuroscience research has already made a significant impact, but as the development and application of optogenetics continues additional merits of this technology are likely to be realized.
Ryan Fox Squire and Karl Deisseroth
Further Reading
1. Deisseroth, K. (2010). Optogenetics: Controlling the brain with light [Extended Version]: Scientific American. Scientific American (web exclusive). http://www.scientificamerican.com/article.cfm?id=optogenetics-controlling.
2. Fenno L, Yizhar O, Deisseroth K. The development and application of optogenetics. Annual Review of Neuroscience. 2011;34:389–412.
3. Luo L, Callaway EM, Svoboda K. Genetic dissection of neural circuits. Neuron. 2008;57(5):634–660.
Figure 10.2 illustrates procedures that can be used to experimentally examine some of the components of synaptic transmission in the reflex pathway for the stretch reflex. Intracellular recordings are made from one of the sensory neurons, the extensor and flexor motor neurons, and an inhibitory interneuron. Normally, the sensory neuron is activated by stretch to the muscle, but this step can be bypassed by simply injecting a pulse of depolarizing current of sufficient magnitude into the sensory neuron to elicit an action potential. The action potential in the sensory neuron leads to a potential change in the motor neuron known as an excitatory postsynaptic potential (EPSP; Fig. 10.2).
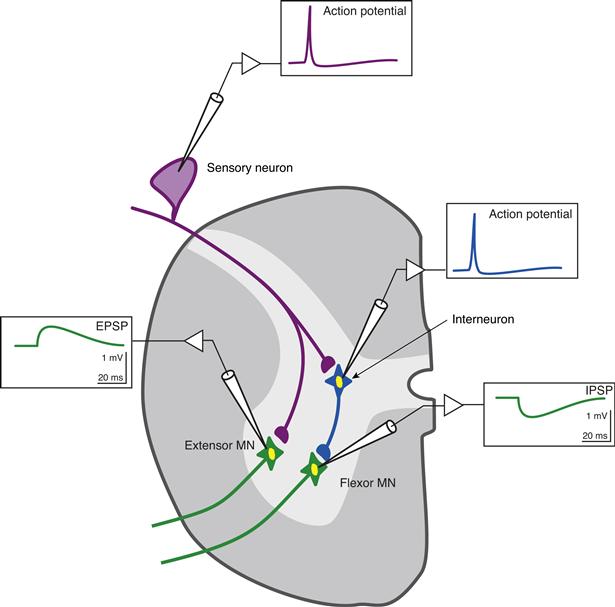
Figure 10.2 Excitatory (EPSP) and inhibitory (IPSP) postsynaptic potentials in spinal motor neurons. Idealized intracellular recordings from a sensory neuron, interneuron, and extensor and flexor motor neurons (MNs). An action potential in the sensory neuron produces a depolarizing response (an EPSP) in the extensor motor neuron. An action potential in the interneuron produces a hyperpolarizing response (an IPSP) in the flexor motor neuron.
Mechanisms responsible for fast EPSPs mediated by ionotropic receptors in the CNS are fairly well known. Moreover, the ionic mechanisms for EPSPs in the CNS are essentially identical with the ionic mechanisms at the skeletal neuromuscular junction. Specifically, the transmitter substance released from the presynaptic terminal (Chapters 7 and 8) diffuses across the synaptic cleft, binds to specific receptor sites on the postsynaptic membrane (Chapter 8), and leads to a simultaneous increase in permeability to Na+ and K+, which makes the membrane potential move toward a value of about 0 mV. However, the processes of synaptic transmission at the sensory neuron–motor neuron synapse and the motor neuron–skeletal muscle synapse differ in two fundamental ways: in the transmitter used and in the amplitude of the EPSP. The transmitter substance at the neuromuscular junction is ACh, whereas that released by the sensory neurons is an amino acid, probably glutamate. Indeed, glutamate is the most common transmitter that mediates excitatory actions in the CNS. The amplitude of the postsynaptic potential at the neuromuscular junction is about 50 mV; consequently, each PSP depolarizes the postsynaptic cell beyond threshold so there is a one-to-one relation between an action potential in the spinal motor neuron and an action potential in the skeletal muscle cell. Indeed, the EPSP must depolarize the muscle cell by only about 30 mV to initiate an action potential, allowing a safety factor of about 20 mV. In contrast, the EPSP in a spinal motor neuron produced by an action potential in an afferent fiber has an amplitude of only about 1 mV. The mechanisms by which these small PSPs can trigger an action potential in the postsynaptic neuron are discussed in a later section of this chapter and in Chapter 11.
Macroscopic Properties of PSPs Are Determined by the Nature of Gating and Ion-Permeation Properties of Single Channels
Patch-Clamp Techniques
Patch-clamp techniques (Hamill, Marty, Neher, Sakmann, & Sigworth, 1981), with which current flowing through single isolated receptors can be measured directly, can be sources of insight into both the ionic mechanisms and the molecular properties of PSPs mediated by ionotropic receptors. This approach was pioneered by Erwin Neher and Bert Sakman in the 1970s and led to their being awarded the Nobel Prize in Physiology or Medicine in 1991.
Figure 10.3A illustrates an idealized experimental arrangement of an “outside-out” patch recording of a single ionotropic receptor. The patch pipette contains a solution with an ionic composition similar to that of the cytoplasm, whereas the solution exposed to the outer surface of the membrane has a composition similar to that of normal extracellular fluid. The electrical potential across the patch, and hence the transmembrane potential (Vm), is controlled by the patch-clamp amplifier. The extracellular (outside) fluid is considered “ground.” Transmitter can be delivered by applying pressure to a miniature pipette filled with an agonist (in this case, ACh), and the current (Im) flowing across the patch of membrane is measured by the patch-clamp amplifier (Fig. 10.3). Pressure in the pipette that contains ACh can be continuous, allowing a constant stream of ACh to contact the membrane, or can be applied as a short pulse to allow a precisely timed and discrete amount of ACh to contact the membrane. The types of recordings obtained from such an experiment are illustrated in the traces in Figure 10.3. In the absence of ACh, no current flows through the channel (Fig. 10.3A). When ACh is applied continuously, current flows across the membrane (through the channel), but the current does not flow continuously; instead, small step-like changes in current are observed (Fig. 10.3B). These changes represent the probabilistic (random) opening and closing of the channel.

Figure 10.3 Single-channel recording of ionotropic receptors and their properties. (A) Experimental arrangement for studying properties of ionotropic receptors. (B) Idealized single-channel currents in response to application of ACh.
Channel Openings and Closings
As a result of the type of patch-recording techniques heretofore described, three general conclusions about the properties of ligand-gated channels can be drawn. First, ACh, as well as other transmitters that activate ionotropic receptors, causes the opening of individual ionic channels (for a channel to open, usually two molecules of transmitter must bind to the receptor). Second, when a ligand-gated channel opens, it does so in an all-or-none fashion. Increasing the concentration of transmitter in the ejection microelectrode does not increase the permeability (conductance) of the channel; it increases its probability (P) of being open. Third, the ionic current flowing through a single channel in its open state is extremely small (e.g., 10−12 A); as a result, current flowing through any single channel makes only a small contribution to the normal postsynaptic potential. Physiologically, when a larger region of the postsynaptic membrane, and thus more than one channel, is exposed to a released transmitter, the net conductance of the membrane increases due to the increased probability that a larger population of channels will be open at the same time. The normal PSP, measured with standard intracellular recording techniques (e.g., Fig. 10.2), is then proportional to the sum of the currents that flow through these many individual open channels. The properties of voltage-sensitive channels (see Chapter 5) are similar in that they, too, open in all-or-none fashion, and, as a result, the net effect on the cell is due to the summation of currents flowing through many individual open ion channels. The two types of channels differ, however, in that one is opened by a chemical agent, whereas the other is opened by changes in membrane potential.
Statistical Analysis of Channel Gating and Kinetics of the PSP
The experiment illustrated in Figure 10.3B was performed with continuous exposure to ACh. Under such conditions, the channels open and close repeatedly. When ACh is applied by a brief pressure pulse to more accurately mimic the transient release from the presynaptic terminal, the transmitter commonly causes only a single opening of the channel before it diffuses away. A set of data similar to that shown in Figure 10.4A would be obtained if an ensemble of these openings were collected and aligned with the start of each opening. Each individual trace represents the response to each successive “puff” of ACh. Note that, among the responses, the duration of the opening of the channel varies considerably—from very short (less than 1 ms) to more than 5 ms. Moreover, channel openings are independent events. The duration of any one channel opening does not have any relation to the duration of a previous opening. Figure 10.4B illustrates a plot that is obtained by adding 1000 of these individual responses. Such an addition roughly simulates the conditions under which a transmitter released from a presynaptic terminal leads to the near simultaneous activation of many single channels in the postsynaptic membrane. (Note that the addition of 1000 channels would produce a synaptic current equal to about 4 nA.) This simulation is valid given the assumption that the statistical properties of a single channel over time are the same as the statistical properties of the ensemble at one instant of time (i.e., an ergodic process). The ensemble average can be fit with an exponential function with a decay time constant of 2.7 ms. An additional observation (discussed later) is that the value of the time constant is equal to the mean duration of the channel openings. The curve in Figure 10.4B is an indication of the probability that a channel will remain open for various times, with a high probability for short times and a low probability for long times.

Figure 10.4 Determination of the shape of the postsynaptic response from single-channel currents. (A) Each trace represents the response of a single channel to a repetitively applied puff of transmitter. Traces are aligned with the beginning of the channel opening (dashed line). (B) The addition of 1000 of the individual responses. If a current equal to 4 pA were generated by the opening of a single channel, then a 4-nA current would be generated by 1000 channels opening at the same time. Data are fitted with an exponential function having a time constant equal to 1/a (see text).
Reprinted with permission from Sakmann (1992). American Association for the Advancement of Science, © 1992 The Nobel Foundation.
The ensemble average of single-channel currents (Fig. 10.4B) roughly accounts for the time course of the EPSP. However, note that the time course of the aggregate synaptic current can be somewhat faster than that of the excitatory postsynaptic potential in Figure 10.2. This difference is due to charging of the membrane capacitance by a rapidly changing synaptic current. Because the single-channel currents were recorded with the membrane voltage clamped, the capacitive current [Ic = Cm * (dV/dt)] is zero. In contrast, for the recording of the postsynaptic potential in Figure 10.2, the membrane was not voltage clamped, and therefore as the voltage changes (i.e., dV/dt), some of the synaptic current charges the membrane capacitance (see Eq. 10.7).
Analytical expressions that describe the shape of the ensemble average of the open lifetimes and the mean open lifetime can be derived by considering that single-channel opening and closing is a stochastic process (Johnston & Wu, 1995; Sakmann, 1992). Relations are formalized to describe the likelihood (probability) of a channel being in a certain state. Consider the following two-state reaction scheme:

In this scheme, α represents the rate constant for channel closing and β the rate constant for channel opening. The scheme can be simplified further if we consider a case in which the channel has been opened by the agonist and the agonist is removed instantaneously. A channel so opened (at time 0) will then close after a certain random time (Fig. 10.4). It can be shown that the mean open time = 1/α (Johnston & Wu, 1995; Sakmann, 1992).
Gating Properties of Ligand-Gated Channels
Although statistical analysis can be a valuable source of insight into the statistical nature of the gating process and the molecular determinants of the macroscopic postsynaptic potential, the description in the preceding section is a simplification of the actual processes. Specifically, a more complete description must include the kinetics of receptor binding and unbinding and the determinants of the channel opening, as well as the fact that channels display rapid transitions between open and closed states during a single agonist receptor occupancy. Thus, the open states illustrated in Figures 10.3B and 10.4A represent the period of a burst of extremely rapid openings and closings. If the bursts of rapid channel openings and closings are thought of, and behave functionally, as a single continuous channel opening, the formalism developed in the preceding section is a reasonable approximation for many ligand-gated channels. Nevertheless, a more complex reaction scheme is necessary to quantitatively explain available data. Such a scheme would include the following states,

where R represents the receptor, A the agonist, and the α, β, and k values the forward and reverse rate constants for the various reactions. A2R* represents a channel opened as a result of the binding of two agonist molecules. The asterisk indicates an open channel. Note that the lower part of the reaction scheme is equivalent to the one developed earlier; that is,

With the use of probability theory, equations describing transitions between the states can be determined. The approach is identical to that used in the simplified two-state scheme. However, the mathematics and analytical expressions are more complex. For some receptors, additional states must be represented. For example, as described in Chapter 8, some ligand-gated channels exhibit a process of desensitization in which continued exposure to a ligand results in channel closure.
Null (Reversal) Potential and Slope of I-V Relations
What ions are responsible for the synaptic current that produces the EPSP? Early studies of the ionic mechanisms underlying the EPSP at the skeletal neuromuscular junction yielded important information. Specifically, voltage-clamp and ion-substitution experiments indicated that the binding of transmitter to receptors on the postsynaptic membrane led to a simultaneous increase in Na+ and K+ permeability that depolarized the cell toward a value of about 0 mV (Fatt & Katz, 1951; Takeuchi & Takeuchi, 1960). These findings are applicable to the EPSP in a spinal motor neuron produced by an action potential in an afferent fiber and have been confirmed and extended at the single-channel level.
Figure 10.5 illustrates the type of experiment in which the analysis of single-channel currents can be a source of insight into the ionic mechanisms of EPSPs. A transmitter is delivered to the patch while the membrane potential is varied systematically (Fig. 10.5A). In the upper trace, the patch potential is −40 mV. The ejection of transmitter produces a sequence of channel openings and closings, the amplitudes of which are constant for each opening (i.e., about 4 pA). Now consider the case in which the transmitter is applied when the potential across the patch is −20 mV. The frequency of the responses, as well as the mean open lifetimes, is about the same as when the potential was at −40 mV, but now the amplitude of the single-channel currents is decreased uniformly. Even more interesting, when the patch is depolarized artificially to a value of about 0 mV, an identical puff of transmitter produces no current in the patch. If the patch potential is depolarized to a value of about 20 mV and the puff is delivered again, openings are again observed, but the flow of current through the channel is reversed in sign; a series of upward deflections indicate outward single-channel currents. In summary, there are downward deflections (inward currents) when the membrane potential is at −40 mV, no deflections (currents) when the membrane is at 0 mV, and upward deflections (outward currents) when the membrane potential is moved to 20 mV.

Figure 10.5 Voltage dependence of the current flowing through single channels. (A) Idealized recording of an ionotropic receptor in the continuous presence of agonist. (B) I–V relation of the channel in A. (C) Equivalent electrical circuit of a membrane containing that channel. γSC, single-channel conductance; IL, leakage current; ISC, single-channel current; gL, leakage conductance; gsyn, macroscopic synaptic conductance; EL, leakage battery; Er, reversal potential.
The simple explanation for these results is that no matter what the membrane potential, the effect of the transmitter binding with receptors is to produce a permeability change that tends to move the membrane potential toward 0 mV. If the membrane potential is more negative than 0 mV, an inward current is recorded. If the membrane potential is more positive than 0mV, an outward current is recorded. If the membrane potential is at 0 mV, there is no deflection because the membrane potential is already at 0 mV. At 0 mV, the channels are opening and closing as they always do in response to the agonist, but there is no net movement of ions through them. This 0-mV level is known as the synaptic null potential or reversal potential because it is the potential at which the sign of the synaptic current reverses. The fact that the experimentally determined reversal potential equals the calculated value obtained by using the Goldman-Hodgkin-Katz (GHK) equation (Chapter 5) provides strong support for the theory that the EPSP is due to the opening of channels that have equal permeabilities to Na+ and K+. Ion-substitution experiments also confirm this theory. Thus, when the concentration of Na+ or K+ in the extracellular fluid is altered, the value of the reversal potential shifts in a way predicted by the GHK equation. (Some other cations, such as Ca2+, also permeate these channels, but their permeability is low compared with that of Na+ and K+.)
Different families of ionotropic receptors have different reversal potentials because each has unique ion selectivity. In addition, it should now be clear that the sign of the synaptic action (excitatory or inhibitory) depends on the value of the reversal potential relative to the resting potential. If the reversal potential of an ionotropic receptor channel is more positive than the resting potential, opening of that channel will lead to depolarization (i.e., an EPSP). In contrast, if the reversal potential of an ionotropic receptor channel is more negative than the resting potential, opening of that channel will lead to hyperpolarization; that is, an inhibitory postsynaptic potential (IPSP), which is the topic of a later section in this chapter.
Plotting the average peak value of single-channel currents (Isc) versus the membrane potential (transpatch potential) at which they are recorded (Fig. 10.5B) can be a source of quantitative insight into the properties of the ionotropic receptor channel. Note that the current-voltage (I-V) relation is linear; it has a slope, the value of which is the single-channel conductance, and an intercept at 0 mV. This linear relation can be put in the form of Ohm’s law (I = G * ΔV). Thus,
 (10.1)
where γsc is the single-channel conductance and Er is the reversal potential (here, 0 mV).
Summation of Single-Channel Currents
We now know that the sign of a synaptic action can be predicted by knowledge of the relation between the resting potential (Vm) and the reversal potential (Er), but how can the precise amplitude be determined? The answer to this question lies in understanding the relation between synaptic conductance and extra synaptic conductances. These interactions can be rather complex (see Chapter 11), but some initial understanding can be obtained by analyzing an electrical equivalent circuit for these two major conductance branches. We first need to move from a consideration of single-channel conductances and currents to that of macroscopic conductances and currents. The postsynaptic membrane contains thousands of any one type of ionotropic receptor, and each of these receptors could be activated by transmitter released by a single action potential in a presynaptic neuron. Because conductances in parallel add, the total conductance change produced by their simultaneous activation would be
 (10.2)
where γsc, as before, is the single-channel conductance, P is the probability of opening of a single channel (controlled by the ligand), and N is the total number of ligand-gated channels in the postsynaptic membrane. The macroscopic postsynaptic current produced by the transmitter released by a single presynaptic action potential can then be described by
 (10.3)
Equation 10.3 can be represented physically by a voltage (Vm) measured across a circuit consisting of a resistor (gsyn) in series with a battery (Er). An equivalent circuit of a membrane containing such a conductance is illustrated in Figure 10.5C. Also included in this circuit are a membrane capacitance (Cm), a resistor representing the leakage conductance (gL), and a battery (EL) representing the leakage potential. (Voltage-dependent Na+, Ca2+, and K+ channels that contribute to the generation of the action potential have been omitted for simplification.)
The simple circuit allows the simulation and further analysis of the genesis of the PSP. Closure of the switch simulates the opening of the channels by transmitter released from some presynaptic neuron (i.e., a change in P of Eq. (10.2) from 0 to 1). When the switch is open (i.e., no agonist is present and the ligand-gated channels are closed), the membrane potential (Vm) is equal to the value of the leakage battery (EL). Closure of the switch (i.e., the agonist opens the channels) tends to polarize the membrane potential toward the value of the battery (Er) in series with the synaptic conductance. Although the effect of the channel openings is to depolarize the postsynaptic cell toward Er (0 mV), this value is never achieved because ligand-gated receptors are only a small fraction of the ion channels in the membrane. Other channels (such as the leakage channels, which are not affected by the transmitters) tend to hold the membrane potential at EL and prevent the membrane potential from reaching the 0-mV level. In terms of the equivalent electrical circuit (Fig. 10.5C), gL is much greater than gsyn.
An analytical expression that can be a source of insight into the production of an EPSP by the engagement of a synaptic conductance can be derived by examining the current flowing in each of the two conductance branches of the circuit in Figure 10.5C. As shown previously (Eq. 10.3), current flowing in the branch representing the synaptic conductance is equal to

Similarly, the current flowing through the leakage conductance is equal to
 (10.4)
By conservation of current, the two currents must be equal and opposite. Therefore,

Rearranging and solving for Vm, we obtain
 (10.5)
Note that when the synaptic channels are closed (i.e., switch open), gsyn is 0 and

Now consider the case of ligand-gated channels being opened by the release of transmitter from a presynaptic neuron (i.e., switch closed) and a neuron with gL = 10 nS, EL = −60 mV, gsyn = 0.2 nS, and Er = 0 mV. Then

Thus, as a result of the closure of the switch, the membrane potential has changed from its initial value of −60 mV to a new value of −59 mV; that is, an EPSP of 1 mV has been generated.
The preceding analysis ignored membrane capacitance (Cm), the charging of which makes the synaptic potential slower than the synaptic current. Thus, a more complete analytical description of the postsynaptic factors underlying the generation of a PSP must account for the fact that some of the synaptic current will flow into the capacitive branch of the circuit. Again, by conservation of current, the sum of the currents in the three branches must equal 0. Therefore,
 (10.6)
 (10.7)
where Cm (dVm/dt) is the capacitative current.
By solving for Vm and integrating the differential equation, we can determine the magnitude and time course of a PSP. An accurate description of the kinetics of the PSP requires that the simple switch closure (all-or-none engagement of the synaptic conductance) be replaced with an expression [gsyn(t)] that describes the dynamics of the change in synaptic conductance with time.
Nonlinear I-V Relations of Some Ionotropic Receptors
For many PSPs mediated by ionotropic receptors, the current-voltage relation of the synaptic current is linear or approximately linear (Fig. 10.5B). Such ohmic relations are typical of nicotinic ACh channels and AMPA (alpha-amino-3-hydroxyl-5-methyl-4-isoxazolepropionate) glutamate channels (as well as many receptors mediating IPSPs). The linear I–V relation is indicative of a channel whose conductance is not affected by the potential across the membrane. Such linearity should be contrasted with the steep voltage dependency of the conductance of channels underlying the initiation and repolarization of action potentials (Chapter 5).
NMDA (N-methyl-D-aspartate) glutamate channels are a class of ionotropic receptors that have nonlinear current-voltage relations. At negative potentials, the channel conductance is low even when glutamate is bound to the receptor. As the membrane is depolarized, conductance increases and current flowing through the channel increases, resulting in the type of I–V relation illustrated in Figure 10.6A. This nonlinearity is represented by an arrow through the resistor representing this synaptic conductance in the equivalent circuit of Figure 10.6B. The nonlinear I–V relation of the NMDA receptor can be explained by a voltage-dependent block of the channel by Mg2+ (Fig. 10.7B). At normal values of the resting potential, the pore of the channel is blocked by Mg2+. Thus, even when glutamate binds to the receptor (Fig. 10.7B), the blocked channel prevents ionic flow (and an EPSP). The block can be relieved by depolarization, which displaces Mg2+ from the pore (Fig. 10.7B). When the pore is unblocked, cations (i.e., Na+, K+, and Ca2+) can flow readily through the channel, and this flux is manifested in the linear part of the I–V relation (Fig. 10.6A). AMPA channels (Fig. 10.7A) are not blocked by Mg2+ and have linear I–V relations (Fig. 10.5B).

Figure 10.6 (A) I–V relation of the NMDA receptor. (B) Equivalent electrical circuit of a membrane containing NMDA receptors.
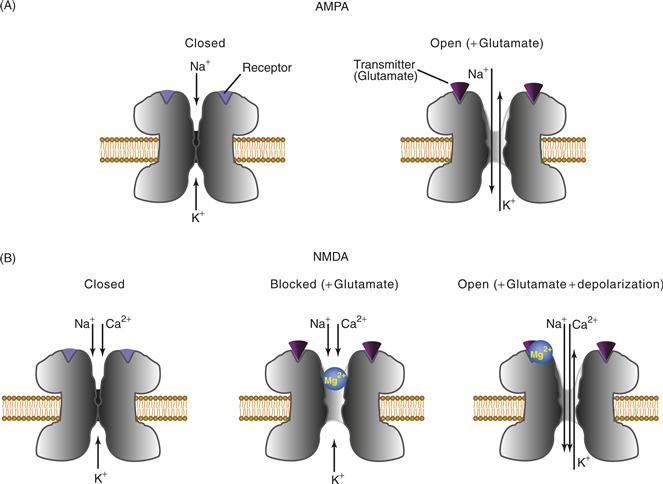
Figure 10.7 Features of AMPA and NMDA glutamate receptors. (A) AMPA receptors: (left) in the absence of agonist, the channel is closed, and (right) glutamate binding leads to channel opening and an increase in Na+ and K+ permeability. AMPA receptors that contain the GluR2 subunit are impermeable to Ca2+. (B) NMDA receptors: (left) in the absence of agonist, the channel is closed; (middle) the presence of agonist leads to a conformational change and channel opening, but no ionic flux occurs because the pore of the channel is blocked by Mg2+; and (right) in the presence of depolarization, the Mg2+ block is removed and the agonist-induced opening of the channel leads to changes in ion flux (including Ca2+ influx into the cell).
Inhibitory Postsynaptic Potentials Decrease the Probability of Cell Firing
Some synaptic events decrease the probability of generating action potentials in the postsynaptic cell. Potentials associated with these actions are called inhibitory postsynaptic potentials. Consider the inhibitory interneuron illustrated in Figure 10.2. Normally, this interneuron is activated by summating EPSPs from converging afferent fibers. These EPSPs summate in space and time such that the membrane potential of the interneuron reaches threshold and fires an action potential. This step can be bypassed by artificially depolarizing the interneuron to initiate an action potential. The consequences of that action potential from the point of view of the flexor motor neuron are illustrated in Figure 10.2. The action potential in the interneuron produces a transient increase in the membrane potential of the motor neuron. This transient hyperpolarization (the IPSP) looks very much like the EPSP, but it is reversed in sign.
What are the ionic mechanisms for these fast IPSPs and what is the transmitter substance? Because the membrane potential of the flexor motor neuron is about −65 mV, one might expect an increase in the conductance to some ion (or ions) with an equilibrium potential (reversal potential) more negative than −65 mV. One possibility is K+. Indeed, the K+ equilibrium potential in spinal motor neurons is about −80 mV; thus, a transmitter substance that produced a selective increase in K+ conductance would lead to an IPSP. The K+-conductance increase would move the membrane potential from −65 mV toward the K+ equilibrium potential of −80 mV. Although an increase in K+ conductance mediates IPSPs at some inhibitory synapses (see later), it does not at the synapse between the inhibitory interneuron and the spinal motor neuron. At this particular synapse, the IPSP seems to be due to a selective increase in Cl− conductance. The equilibrium potential for Cl− in spinal motor neurons is about −70 mV. Thus, the transmitter substance released by the inhibitory neuron diffuses across the cleft and interacts with receptor sites on the postsynaptic membrane. These receptors are normally closed, but when opened they become selectively permeable to Cl−. As a result of the increase in Cl− conductance, the membrane potential moves from a resting value of −65 mV toward the Cl− equilibrium potential of −70 mV.
As in the sensory neuron–spinal motor neuron synapse, the transmitter substance released by the inhibitory interneuron in the spinal cord is an amino acid, but in this case the transmitter is glycine. The toxin strychnine is a potent antagonist of glycine receptors. Although glycine originally was thought to be localized to the spinal cord, it is also found in other regions of the nervous system. The most common transmitter associated with inhibitory actions in many areas of the brain is γ-aminobutyric acid (GABA; see Chapter 5).
GABA receptors are divided into three major classes: GABAA, GABAB, and GABAC (Billinton et al., 2001; Bormann & Fiegenspan, 1995; Bowery, 1993; Cherubini & Conti, 2001; Gage, 1992; Moss & Smart, 2001). As discussed in Chapter 7, GABAA receptors are ionotropic receptors, and, like glycine receptors, binding of transmitter leads to an increased conductance to Cl−, which produces an IPSP. GABAA receptors are blocked by bicuculline and picrotoxin. A particularly striking aspect of GABAA receptors is their modulation by anxiolytic benzodiazepines. Figure 10.8 illustrates the response of a neuron to GABA before and after treatment with diazepam (Bormann, 1988). In the presence of diazepam, the response is potentiated greatly. In contrast to GABAA receptors that are pore-forming channels, GABAB receptors are G-protein coupled (see also Chapter 8). GABAB receptors can be coupled to a variety of different effector mechanisms in different neurons. These mechanisms include decreases in Ca2+ conductance, increases in K+ conductance, and modulation of voltage-dependent A-type K+ current. In hippocampal pyramidal neurons, the GABAB-mediated IPSP is due to an increase in K+ conductance. Baclofen is a potent agonist of GABAB receptors, whereas phaclofen is a selective antagonist. GABAC receptors are pharmacologically distinct from GABAA and GABAB receptors and are found predominantly in the vertebrate retina. GABAC receptors, like GABAA receptors, are Cl− selective pores.

Figure 10.8 Potentiation of GABA responses by benzodiazepine ligands. (A) Brief application (bar) of GABA leads to an inward Cl− current in a voltage-clamped spinal neuron. (B) In the presence of diazepam, the response is enhanced significantly.
From Bormann (1988).
Ionotropic receptors that lead to the generation of IPSPs and ionotropic receptors that lead to the generation of EPSPs have biophysical features in common. Indeed, analyses of the preceding section are generally applicable. A quantitative understanding of the effects of the opening of glycine or GABAA receptors can be obtained by using the electrical equivalent circuit of Figure 10.5C and Eq. 10.5, with the values of gsyn and Er appropriate for the respective ionotropic receptor. Interactions between excitatory and inhibitory conductances can be modeled by adding additional branches to the equivalent circuit (see Fig. 10.15D and Chapter 12).
Some PSPs Have More Than One Component
The transmitter released from a presynaptic terminal diffuses across the synaptic cleft, where it binds to ionotropic receptors. In many cases, the postsynaptic receptors are homogeneous. In other cases, the same transmitter activates more than one type of receptor. A major example of this type of heterogeneous postsynaptic action is the simultaneous activation by glutamate of NMDA and AMPA receptors on the same postsynaptic cell. Figure 10.9A illustrates such a dual-component glutamatergic EPSP in the CA1 region of the hippocampus. The cell is voltage clamped at various fixed holding potentials, and the macroscopic synaptic currents produced by activation of the presynaptic neurons are recorded. The experiment is performed in the presence and absence of the agent 2-amino-5-phosphonovalerate (APV), which is a specific blocker of NMDA receptors. When the cell is held at a potential of 20 or −40 mV, APV leads to a dramatic reduction of the late, but not the early, phase of the excitatory postsynaptic current (EPSC). In contrast, when the potential is held at −80 mV, the EPSC is unaffected by APV. These results indicate that the PSP consists of two components: an early AMPA-mediated component and a late NMDA-mediated component. In addition, results indicate that conductance of the non-NMDA component is linear, whereas conductance of the NMDA component is nonlinear. The I–V relations of the early (peak) and late (at approximately 25 ms) components of the EPSC are plotted in Figure 10.9B (Hestrin, Nicoll, Perkel, & Sah, 1990).

Figure 10.9 Dual-component glutamatergic EPSP. (A) The excitatory postsynaptic current was recorded before and during the application of APV at the indicated membrane potentials. (B) Peak current-voltage relations are shown before  and during (
 ) the application of APV. Current-voltage relations measured 25 ms after the peak of the EPSC (dotted line in (A)); before (
 ) and during
  application of APV are also shown.
Reprinted with permission from Hestrin et al. (1990).
Dual-component IPSPs also are observed in the CNS, but here the transmitter (GABA) that mediates the inhibitory actions may be released from different neurons that converge on a common postsynaptic neuron. Stimulation of afferent pathways to the hippocampus results in an IPSP in a pyramidal neuron, which has a fast initial inhibitory phase followed by a slower inhibitory phase (Fig. 10.10). Application of GABAA antagonists blocks the early inhibitory phase, whereas the GABAB receptor antagonist phaclofen blocks the late inhibitory phase (not shown). Early and late IPSPs can also be distinguished based on their ionic mechanisms. Hyperpolarizing the membrane potential to −78 mV nulls the early response, but at this value of membrane potential, the late response is still hyperpolarizing (Figs. 10.10A and 10.10B). Hyperpolarizing the membrane potential to values more negative than −78 mV reverses the sign of the early response, but the slow response does not reverse until the membrane is made more negative than about −100 mV (Thalmann, 1988). The reversal potentials are consistent with a fast Cl−-mediated IPSP, mediated by fast opening of GABAA receptors and a slower K+-mediated IPSP mediated by G-protein GABAB receptors.
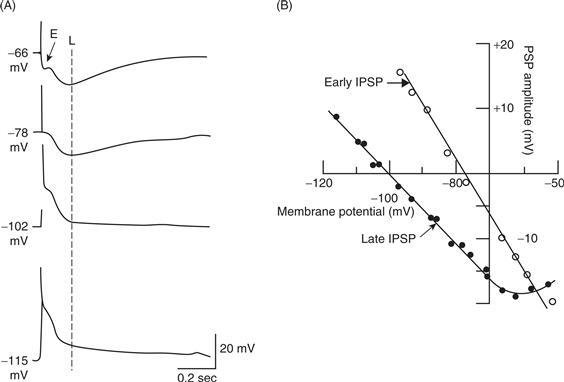
Figure 10.10 Dual-component IPSP. (A) Intracellular recordings from a pyramidal cell in the CA3 region of the rat hippocampus in response to activation of mossy fiber afferents. With the membrane potential of the cell at the resting potential, afferent stimulation produces an early (E) and late (L) IPSP. With increased hyperpolarization produced by injecting constant current into the cell, the early component reverses first. At more negative levels of the membrane potential, the late component also reverses. This result indicates that the ionic conductances underlying the two phases are distinct. (B) Plots of the change in amplitude of the early (measured at 25 ms) and the late (measured at 200 ms, dashed line in A) response as a function of membrane potential. Reversal potentials of the early and late components are consistent with a GABAA-mediated chloride conductance and a GABAB-mediated potassium conductance, respectively.
From Thalmann (1988).
Dual-component PSPs need not be strictly inhibitory or excitatory. For example, a presynaptic cholinergic neuron in the mollusk, Aplysia, produces a diphasic excitatory-inhibitory (E-I) response in its postsynaptic follower cell. The response can be simulated by local discrete application of ACh to the postsynaptic cell (Fig. 10.11) (Blankenship, Wachtel, & Kandel, 1971). The ionic mechanisms underlying this synaptic action were investigated in ion-substitution experiments, which revealed that the dual response is due to an early Na+- dependent component followed by a slower Cl−-dependent component. Molecular mechanisms underlying such slow synaptic potentials are discussed next.

Figure 10.11 Dual-component cholinergic excitatory-inhibitory response. (A) Control in normal saline. Ejection of ACh produces a rapid depolarization followed by a slower hyperpolarization. (B) In Na+-free saline, ACh produces a purely hyperpolarizing response, indicating that the depolarizing component in normal saline includes an increase in gNa. (C) In Cl-free saline, ACh produces a purely depolarizing response, indicating that the hyperpolarizing component in normal saline includes an increase in gcl.
Reprinted with permission from Blankenship et al. (1971).
Summary
Synaptic potentials mediated by ionotropic receptors are the fundamental means by which information is transmitted rapidly between neurons. Transmitters cause channels to open in an all-or-none fashion, and the currents through these individual channels summate to produce the macroscopic postsynaptic potential. The sign of the postsynaptic potential is determined by the relationship between the membrane potential of the post-synaptic neuron and the ion selectivity of the ionotropic receptor.
Metabotropic Receptors: Mediators of Slow Synaptic Potentials
A common feature of the types of synaptic actions heretofore described is the direct binding of the transmitter with the receptor-channel complex. An entirely separate class of synaptic actions has as its basis the indirect coupling of the receptor with the channel. Two major types of coupling mechanisms have been identified: coupling of the receptor and channel through an intermediate regulatory protein, such as a G-protein, and coupling through a diffusible second-messenger system. Because coupling through a diffusible second-messenger system is the most common mechanism, it is the focus of this section.
A comparison of the features of direct, fast ionotropic-mediated and indirect, slow metabotropic-mediated synaptic potentials is shown in Figure 10.12. Slow synaptic potentials are not observed at every postsynaptic neuron, but Figure 10.12A illustrates an idealized case in which a postsynaptic neuron receives two inputs, one of which produces a conventional fast EPSP and the other of which produces a slow EPSP. An action potential in neuron 1 leads to an EPSP in the postsynaptic cell with a duration of about 30 ms (Fig. 10.12B). This type of potential might be produced in a spinal motor neuron by an action potential in an afferent fiber. Neuron 2 also produces a postsynaptic potential (Fig. 10.12C), but its duration (note the calibration bar) is more than three orders of magnitude greater than that of the EPSP produced by neuron 1.

Figure 10.12 Fast and slow synaptic potentials. (A) Idealized experiment in which two neurons (1 and 2) make synaptic connections with a common postsynaptic follower cell (Post). (B) An action potential in neuron 1 leads to a conventional fast EPSP with a duration of about 30 ms. (C) An action potential in neuron 2 also produces an EPSP in the postsynaptic cell, but the duration of this slow EPSP is more than three orders of magnitude greater than that of the EPSP produced by neuron 1. Note the change in the calibration bar.
How can a change in the postsynaptic potential of a neuron persist for many seconds as a result of a single action potential in the presynaptic neuron? Possibilities include a prolonged presence of the transmitter due to continuous release, to slow degradation, or to slow reuptake of the transmitter, but the mechanism here involves a transmitter-induced change in the metabolism of the postsynaptic cell. Figure 10.13 compares the general mechanisms for fast and slow synaptic potentials. Fast synaptic potentials are produced when a transmitter substance binds to a channel and produces a conformational change in the channel, causing it to become permeable to one or more ions (both Na+ and K+ in Fig. 10.13A). The increase in permeability leads to a depolarization associated with the EPSP. The duration of the synaptic event critically depends on the amount of time during which the transmitter substance remains bound to the receptors. Acetylcholine, glutamate, and glycine remain bound only for a very short period. These transmitters are removed by diffusion, enzymatic breakdown, or reuptake into the presynaptic cell. Therefore, the duration of the synaptic potential is directly related to the lifetimes of the opened channels, and these lifetimes are relatively short (see Fig. 10.4B).
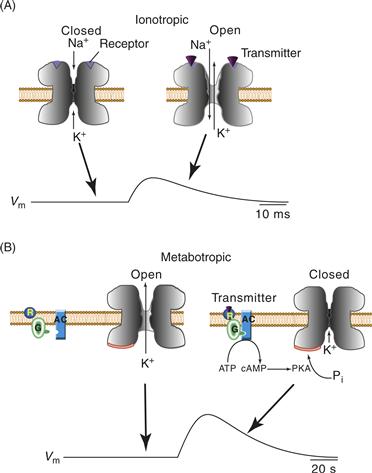
Figure 10.13 Ionotropic and metabotropic receptors and mechanisms of fast and slow EPSPs. (A, left) Fast EPSPs are produced by binding of the transmitter to specialized receptors that are directly associated with an ion channel (i.e., a ligand-gated channel). When the receptors are unbound, the channel is closed. (A, right) Binding of the transmitter to the receptor produces a conformational change in the channel protein such that the channel opens. In this example, the channel opening is associated with a selective increase in the permeability to Na+ and K+. The increase in permeability results in the EPSP shown in the trace. (B, left) Unlike fast EPSPs, which are due to the binding of a transmitter with a receptor-channel complex, slow EPSPs are due to the activation of receptors (metabotropic) that are not coupled directly to the channel. Rather, coupling takes place through the activation of one of several second-messenger cascades, in this example, the cAMP cascade. A channel that has a selective permeability to K+ is normally open. (B, right) Binding of the transmitter to the receptor (R) leads to the activation of a G-protein (G) and adenylyl cyclase (AC). The synthesis of cAMP is increased, cAMP-dependent protein kinase (protein kinase A, PKA) is activated, and a channel protein is phosphorylated. The phosphorylation leads to closing of the channel and the subsequent depolarization associated with the slow EPSP shown in the trace. The response decays due to both the breakdown of cAMP by cAMP-dependent phosphodiesterase and the removal of phosphate from channel proteins by protein phosphatases (not shown).
One mechanism for a slow synaptic potential is shown in Figure 10.13B. In contrast with the fast PSP for which the receptors are actually part of the ion channel complex, channels that produce slow synaptic potentials are not coupled directly to the transmitter receptors. Rather, the receptors are separated physically and exert their actions indirectly through changes in metabolism of specific second-messenger systems. Figure 10.13B illustrates one type of response in Aplysia for which the cAMP-protein kinase A (PKA) system is the mediator, but other slow PSPs use other second-messenger kinase systems (e.g., the protein kinase C system). In the cAMP-dependent slow synaptic responses in Aplysia, transmitter binding to membrane receptors activates G-proteins and stimulates an increase in the synthesis of cAMP. Cyclic AMP then leads to the activation of cAMP-dependent protein kinase (PKA), which phosphorylates a channel protein or protein associated with the channel (Siegelbaum, Camardo, & Kandel, 1982). A conformational change in the channel is produced, leading to a change in ionic conductance. Thus, in contrast with a direct conformational change produced by the binding of a transmitter to the receptor-channel complex, in this case, a conformational change is produced by protein phosphorylation. Indeed, phosphorylation-dependent channel regulation is a fairly general feature of slow PSPs. However, channel regulation by second messengers is not produced exclusively by phosphorylation. In one family of ion channels, the channels are gated or regulated directly by cyclic nucleotides. These cyclic nucleotide-gated channels require cAMP or cGMP to open but have other features in common with members of the superfamily of voltage-gated ion channels (Kaupp, 1995; Zimmermann, 1995).
Another interesting feature of slow synaptic responses is that they are sometimes associated with decreases rather than increases in membrane conductance. For example, the particular channel illustrated in Figure 10.13B is selectively permeable to K+ and is normally open. As a result of the activation of the second messenger, the channel closes and becomes less permeable to K+. The resultant depolarization may seem paradoxical, but recall that the membrane potential is due to a balance between resting K+ and Na+ permeability. K+ permeability tends to move the membrane potential toward the K+ equilibrium potential (−80 mV), whereas Na+ permeability tends to move the membrane potential toward the Na+ equilibrium potential (55 mV). Normally, K+ permeability predominates, and the resting membrane potential is close to, but not equal to, the K+ equilibrium potential. If K+ permeability is decreased because some of the channels close, the membrane potential will be biased toward the Na+ equilibrium potential and the cell will depolarize.
At least one reason for the long duration of slow PSPs is that second-messenger systems are slow (from seconds to minutes). Take the cAMP cascade as an example. Cyclic AMP takes some time to be synthesized, but, more importantly, after synthesis, cAMP levels can remain elevated for a relatively long period (minutes). The duration of the elevation of cAMP depends on the actions of cAMP-phosphodiesterase, which breaks down cAMP. However, duration of an effect could outlast the duration of the change in the second messenger because of persistent phosphorylation of the substrate protein(s). Phosphate groups are removed from substrate proteins by protein phosphatases. Thus, the net duration of a response initiated by a metabotropic receptor depends on the actions of not only the synthetic and phosphorylation processes, but also the degradative and dephosphorylation processes.
Activation of a second messenger by a transmitter can have a localized effect on the membrane potential through phosphorylation of membrane channels near the site of a metabotropic receptor. The effects can be more widespread and even longer lasting than depicted in Figure 10.13B. For example, second messengers and protein kinases can diffuse and affect more distant membrane channels. Moreover, a long-term effect can be induced in the cell by altering gene expression. For example, protein kinase A can diffuse to the nucleus, where it can activate proteins that regulate gene expression. Detailed descriptions of second messengers and their actions are given in Chapter 9.
Summary
In contrast to the rapid responses mediated by ionotropic receptors, responses mediated by metabotropic receptors are generally relatively slow to develop and persistent. These properties arise because metabotropic responses can involve the activation of second-messenger systems. By producing slow changes in the resting potential, metabotropic receptors provide long-term modulation of the effectiveness of responses generated by ionotropic receptors. Moreover, these receptors, through the engagement of second-messenger systems, provide a vehicle by which a presynaptic cell can not only alter the membrane potential, but also produce widespread changes in the biochemical state of a postsynaptic cell.
Integration of Synaptic Potentials
The small amplitude of the EPSP in spinal motor neurons (and other cells in the CNS) poses an interesting question. Specifically, how can an EPSP with an amplitude of only 1 mV drive the membrane potential of the motor neuron (i.e., the postsynaptic neuron) to threshold and fire the spike in the motor neuron that is necessary to produce the contraction of the muscle? The answer to this question lies in the principles of temporal and spatial summation.
When the ligament is stretched (Fig. 10.1), many stretch receptors are activated. Indeed, the greater the stretch, the greater the probability of activating a larger number of the stretch receptors; this process is referred to as recruitment. However, recruitment is not the complete story. The principle of frequency coding in the nervous system specifies that the greater the intensity of a stimulus, the greater the number of action potentials per unit time (frequency) elicited in a sensory neuron. This principle applies to stretch receptors as well. Thus, the greater the stretch, the greater the number of action potentials elicited in the stretch receptor in a given interval and therefore the greater the number of EPSPs produced in the motor neuron from that train of action potentials in the sensory cell. Consequently, the effects of activating multiple stretch receptors add together (spatial summation), as do the effects of multiple EPSPs elicited by activation of a single stretch receptor (temporal summation). Both of these processes act in concert to depolarize the motor neuron sufficiently to elicit one or more action potentials, which then propagate to the periphery and produce the reflex.
Temporal Summation Allows Integration of Successive PSPs
Temporal summation can be illustrated by firing action potentials in a presynaptic neuron and monitoring the resultant EPSPs. For example, in Figures 10.14A and 10.14B, a single action potential in sensory neuron 1 produces a 1-mV EPSP in the motor neuron. Two action potentials in quick succession produce two EPSPs, but note that the second EPSP occurs during the falling phase of the first, and the depolarization associated with the second EPSP adds to the depolarization produced by the first. Thus, two action potentials produce a summated potential that is about 2 mV in amplitude. Three action potentials in quick succession would produce a summated potential of about 3 mV. In principle, 30 action potentials in quick succession would produce a potential of about 30 mV and easily drive the cell to threshold. This summation is strictly a passive property of the cell. No special ionic conductance mechanisms are necessary. Specifically, the postsynaptic conductance change (gsyn in Eq. 10.3) produced by the second of two successive action potentials adds to that produced by the first. In addition, the postsynaptic membrane has a capacitance and can store charge. Thus, the membrane temporarily stores the charge of the first EPSP, and the charge from the second EPSP is added to that of the first.

Figure 10.14 Temporal and spatial summation. (A) Intracellular recordings are made from two idealized sensory neurons (SN1 and SN2) and a motor neuron (MN). (B) Temporal summation. A single action potential in SN1 produces a 1-mV EPSP in the MN. Two action potentials in quick succession produce a dual-component EPSP, the amplitude of which is approximately 2 mV. (C) Spatial summation. Alternative firing of single action potentials in SN1 and SN2 produce 1-mV EPSPs in the MN. Simultaneous action potentials in SN1 and SN2 produce a summated EPSP, the amplitude of which is about 2 mV.
However, the “time window” for this process of temporal summation very much depends on the duration of the postsynaptic potential, and temporal summation is possible only if the presynaptic action potentials (and hence postsynaptic potentials) are close in time to each other. The time frame depends on the duration of changes in the synaptic conductance and the time constant (Chapter 5). Temporal summation, however, rarely is observed to be linear as in the preceding examples, even when the postsynaptic conductance change (gsyn in Eq. 10.3) produced by the second of two successive action potentials is identical with that produced by the first (i.e., no presynaptic facilitation or depression) and the synaptic current is slightly less because the first PSP reduces the driving force (Vm − Er) for the second. Interested readers should try some numerical examples.
Spatial Summation Allows Integration of PSPs from Different Parts of a Neuron
Spatial summation (Fig. 10.14C) requires a consideration of more than one input to a postsynaptic neuron. An action potential in sensory neuron 1 produces a 1-mV EPSP, just as it did in Figure 10.14B. Similarly, an action potential in a second sensory neuron by itself also produces a 1-mV EPSP. Now, consider the consequences of action potentials elicited simultaneously in sensory neurons 1 and 2. The net EPSP is equal to the summation of the amplitudes of the individual EPSPs. Here, the EPSP from sensory neuron 1 is 1 mV, the EPSP from sensory neuron 2 is 1 mV, and the summated EPSP is approximately 2 mV (Fig. 10.14C). Thus, spatial summation is a mechanism by which synaptic potentials generated at different sites can summate. Spatial summation in nerve cells is influenced by the space constant—the ability of a potential change produced in one region of a cell to spread passively to other regions of a cell (see Chapter 11).
Synaptic Plasticity
Synaptic plasticity refers to the ability of synaptic connections to change their strength, a process that is believed critical for regulating the flow of information in neuronal circuits and for mediating learning and memory. Synaptic plasticity has two major forms, homosynaptic plasticity and heterosynaptic plasticity. Homosynaptic plasticity refers to the ability of a synapse to change its strength as a result of activity in that synapse, whereas heterosynaptic plasticity refers to the ability of a synapse to change its strength as a result of activity in another neuron or pathway.
Homosynaptic plasticity has two basic forms: homosynaptic depression and homosynaptic facilitation. Homosynaptic depression refers to a decrease in the strength of a synaptic connection with repeated activation. For example, if the afferent sensory neuron in Figure 10.2 is stimulated a second time 100 ms after the first, the second EPSP will have a lower amplitude. The mechanisms underlying synaptic depression are diverse and range from depletion of the pools of transmitter in the presynaptic terminal to desensitization of transmitter receptors on the postsynaptic neuron. The various possibilities are not mutually exclusive. Homosynaptic facilitation is a phenomenon opposite to homosynaptic depression. It generally occurs when multiple action potentials are fired in quick succession in a presynaptic neuron. For example, if the afferent sensory neuron in Figure 10.2 is stimulated a second time 10 ms after the first, the second EPSP will have a greater amplitude. This particular example of homosynaptic facilitation is frequently called paired-pulse or twin-pulse facilitation (PPF). A common mechanism for PPF involves residual calcium. If the second presynaptic action potential is initiated during a time when Ca2+ levels remain elevated after the first, the Ca2+ influx from the second spike will add to it. Consequently, more transmitter will be released because of the greater net Ca2+ concentration in the presynaptic terminal. When two spikes are close together PPF occurs rather than homosynaptic depression presumably because the increase in the probably of release caused by the enhanced Ca2+ is much greater than the decrease in the pool size due to the depletion of transmitter. A more dramatic example of homosynaptic facilitation is post-tetanic potentiation (PTP). Here, rather than two spikes a high frequency burst of spikes (tetanus) is delivered to the presynaptic neuron and subsequent test EPSPs are enhanced.
Like homosynaptic plasticity, heterosynaptic plasticity has two forms: heterosynaptic inhibition and heterosynaptic facilitation. In both cases, the strength of the synapse between two neurons is regulated by a third neuron or pathway. The prime example of heterosynaptic inhibition is presynaptic inhibition in the spinal cord where descending control pathways regulate the strength of connections between sensory neurons and their postsynaptic targets. At the mechanistic level, presynaptic inhibition appears to be due to a down regulation of voltage-dependent Ca2+ conductances in the presynaptic terminals. Consequently, action potentials in the sensory neurons lead to less influx of Ca2+ and less transmitter release. Therefore, the amplitude of the EPSP in the postsynaptic cell is reduced (i.e., inhibited). The most extensively studied example of heterosynaptic facilitation is the serotonin-induced facilitation of the Aplysia sensorimotor synapse, which has both short lasting (min) and long lasting (days) forms. This process is described in detail in Chapter 47. Other more enduring forms of synaptic plasticity such as long-term potentiation (LTP) and long-term depression (LTD) are also described in Chapter 47.
Summary
Whether a neuron fires in response to synaptic input depends, at least in part, on how many action potentials are produced in any one presynaptic excitatory pathway and on how many individual convergent excitatory input pathways are activated. The summation of EPSPs in time and space is only part of the process, however. The final behavior of the cell is also due to the summation of inhibitory synaptic inputs in time and space, as well as to the properties of the voltage-dependent currents (Fig. 10.15) in the soma and along the dendrites (Koch & Segev, 1989; Ziv, Baxter, & Byrne, 1994). For example, voltage-dependent conductances such as A-type K+ conductance have a low threshold for activation and can thus oppose the effectiveness of an EPSP to trigger a spike. Low-threshold Na+ and Ca2+ channels can boost an EPSP. Finally, we need to consider that spatial distribution of the various voltage-dependent channels, ligand-gated receptors, and metabotropic receptors is not uniform. Thus, each segment of the neuronal membrane can perform selective integrative functions. Clearly, this system has an enormous capacity for the local processing of information and for performing logical operations.

Figure 10.15 Modeling the integrative properties of a neuron. (A) Partial geometry of a neuron in the CNS revealing the cell body and pattern of dendritic branching. (B) The neuron modeled as a sphere connected to a series of cylinders, each of which represents the specific electrical properties of a dendritic segment. (C) Segments linked with resistors representing the intracellular resistance between segments, with each segment represented by the parallel combination of the membrane capacitance and the total membrane conductance. Reprinted with permission from Koch and Segev (1989). Copyright © 1989 MIT Press. (D) Electrical circuit equivalent of the membrane of a segment of a neuron. The segment has a membrane potential V and a membrane capacitance Cm. Currents arise from three sources: (1) m voltage-dependent (vd) conductances (gvd1–gvdm)/(2) n conductances due to electrical synapses (es) (ges1–gesn), and (3) n times o time-dependent conductances due to chemical synapses (cs) with each of the n presynaptic neurons (gcs1,1–gcsn,o). Evd and Ecs are constants and represent the values of the equilibrium potential for currents due to voltage-dependent conductances and chemical synapses, respectively. V1–Vn represent the value of the membrane potential of the coupled cells.
Reprinted with permission from Ziv et al. (1994).
The flow of information in dendrites and the local processing of neuronal signals are discussed in Chapter 12. Several software packages are available for the development and simulation of realistic models of single neurons and neural networks. One, Simulator for Neural Networks and Action Potentials (SNNAP) (http://nba.uth.tmc.edu/snnap/), provides mathematical descriptions of ion currents, intracellular second messengers, and ion pools, and allows simulation of current flow in multicompartment models of neurons.
References
1. Billinton A, Ige AO, Bolam JP, White JH, Marshall FH, Emson PC. Advances in the molecular understanding of GABAB receptors. Trends in Neurosciences. 2001;24:277–282.
2. Blankenship JE, Wachtel H, Kandel ER. Ionic mechanisms of excitatory, inhibitory and dual synaptic actions mediated by an identified interneuron in abdominal ganglion of Aplysia. Journal of Neurophysiology. 1971;34:76–92.
3. Bormann J. Electrophysiology of GABAA and GABAB receptor subtypes. Trends in Neurosciences. 1988;11:112–116.
4. Bormann J, Feigenspan A. GABAC receptors. Trends in Neurosciences. 1995;18:515–519.
5. Bowery NG. GABAB receptor pharmacology. Annual Review of Pharmacology and Toxicology. 1993;33:109–147.
6. Cherubini E, Conti F. Generating diversity at GABAergic synapses. Trends in Neurosciences. 2001;24:155–162.
7. Eccles JC. The physiology of synapses New York: Springer-Verlag; 1964.
8. Fatt P, Katz B. An analysis of the end-plate potential recorded with an intra cellular electrode. Journal of Physiology (London). 1951;115:320–370.
9. Gage PW. Activation and modulation of neuronal K+ channels by GABA. Trends in Neurosciences. 1992;15:46–51.
10. Hamill OP, Marty A, Neher E, Sakmann B, Sigworth J. Improved patch-clamp techniques for high-resolution current recording from cells and cell-free membrane patches. Pflügers Archives. 1981;391:85–100.
11. Hestrin S, Nicoll RA, Perkel DJ, Sah P. Analysis of excitatory synaptic action in pyramidal cells using whole-cell recording from rat hippocampal slices. Journal of Physiology (London). 1990;422:203–225.
12. Johnston D, Wu SM-S. Foundations of cellular neurophysiology Cambridge, MA: MIT Press; 1995.
13. Kaupp UB. Family of cyclic nucleotide gated ion channels. Current Opinion Neurobiology. 1995;5:434–442.
14. Koch C, Segev I. Methods in neuronal modeling Cambridge, MA: MIT Press; 1989.
15. Moss SJ, Smart TG. Constructing inhibitory synapses. Nature Reviews Neuroscience. 2001;2:240–250.
16. Sakmann B. Elementary steps in synaptic transmission revealed by currents through single ion channels. Science. 1992;256:503–512.
17. Siegelbaum SA, Camardo JS, Kandel ER. Serotonin and cyclic AMP close single K+ channels in Aplysia sensory neurones. Nature (London). 1982;299:413–417.
18. Spencer WA. The physiology of supraspinal neurons in mammals. In: Kandel ER, ed. Handbook of physiology. Bethesda, MD: American Physiological Society; 1977;969–1022. (Part 2, Sect. 1, Vol. 1).
19. Takeuchi A, Takeuchi N. On the permeability of end-plate membrane during the action of transmitter. Journal of Physiology (London). 1960;154:52–67.
20. Thalmann RH. Evidence that guanosine triphosphate (GTP)-binding proteins control a synaptic response in brain: Effect of pertussis toxin and GTPgS on the late inhibitory post-synaptic potential of hippocampal CA3 neurons. Journal of Neuroscience. 1988;8:4589–4602.
21. Zimmermann AL. Cyclic nucleotide gated channels. Current Opinion Neurobiology. 1995;5:296–303.
22. Ziv I, Baxter DA, Byrne JH. Simulator for neural networks and action potentials: Description and application. Journal of Neurophysiology. 1994;71:294–308.
Suggested Readings
1. Burke RE, Rudomin P. Spatial neurons and synapses. In: Kandel ER, ed. Handbook of physiology. Bethesda, MD: American Physiological Society; 1977;877–944. (Part 2, Sect. 1, Vol. 1).
2. Byrne JH, Schultz SG. An introduction to membrane transport and bioelectricity 2nd ed. New York: Raven Press; 1994.
3. Cowan WM, Sudhof TC, Stevens CF, eds. Synapses. Johns Hopkins Univ. Press 2001.
4. Hille B, ed. Ion channels of excitable membranes. Sunderland, MA: Sinauer; 2001.
5. Shepherd GM, ed. The synaptic organization of the brain. New York: Oxford Univ. Press; 2004.