3
• CHAPTER •
Buying Checklist
Buying Checklist
Does Your Stock Pass or Fail?
Make sure the 3 “Big Rocks” of CAN SLIM® are always in place before you invest.
Use this checklist to see if your stock has the CAN SLIM traits big winners typically display just before they launch a major price move.
Big Rock #1: Only buy stocks in a market uptrend. Take defensive action as a downtrend begins.
 Market in confirmed uptrend
Big Rock #2: Focus on companies with big earnings growth and a new, innovative product or service.
 Composite Rating of 90 or higher
 EPS Rating of 80 or higher
 EPS growth 25% or higher in recent quarters
 Accelerating earnings growth
 Average Annual EPS growth 25% or more over last 3 years
 Sales growth 25% or higher in most recent quarter
 Return on equity (ROE) of 17% or higher
 SMR® Rating (Sales + Margins + Return on Equity) of A or B
 New products, service, or management
 Among the top-rated stocks in its industry group
 Ranked in top 40–50 of IBD’s 197 industry groups
Big Rock #3: Buy stocks being heavily bought by institutional investors. Avoid those they’re heavily selling.
 Increase in number of funds that own the stock in recent quarters
 Accumulation/Distribution Rating of A or B
 Relative Strength Rating of 80 or higher
 Share price above $15
 Average daily volume of 400,000 shares or more
 Chart Analysis: Buy stocks as they break out of the common patterns that launch big moves.
 Breaking out of sound base or alternative buy point
 Volume at least 40% to 50% above average on breakout
 Relative strength line in new high ground
Within 5% of ideal buy point
You can download and print this checklist at www.investors.com/GettingStartedBook.
Does Your Stock Pass or Fail?
Find Out with IBD Stock Checkup®
Before we go over each item on the Buying Checklist, note that you can quickly see if your stock passes or fails using Stock Checkup on Investors.com. You’ll find Pass (green), Neutral (yellow) or Fail (red) grades for most items.
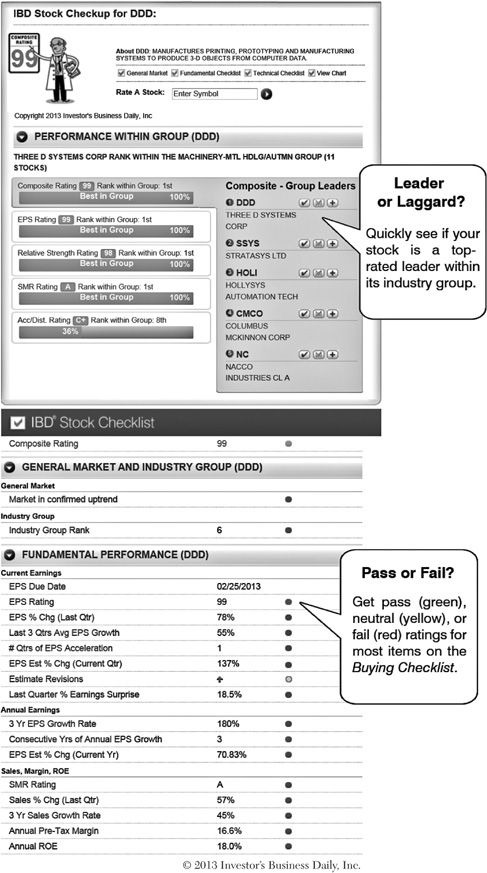
See the Checklist and Stock Checkup in Action
 Watch a short video on how to quickly run your stock ideas through the Buying Checklist at www.investors.com/GettingStartedBook.
It Pays to Be Picky
As we go through each item, keep in mind the concept behind this checklist.
We just saw how the CAN SLIM Investment System outlines what traits the best-performing stocks typically have just before they launch a major price move. The Buying Checklist helps you see which stocks have those same traits right now.
Stocks that pass this test are the ones most likely to go up 50%, 100%, 200% or even more. You’ll see countless examples of stocks that did just that as we check off each item.
Using the Buying Checklist will become second nature very quickly. Once you’ve done it a few times, you’ll be surprised at how fast you can evaluate multiple stocks. And since you’ll know exactly what characteristics to look for, it won’t be difficult to separate the leaders from the laggards.
Practice Now with Stock Checkup
 If you’re near a computer, I suggest you pull up Stock Checkup as we go through each item on the checklist. It’ll help you get used to the process even quicker. See how at www.investors.com/GettingStartedBook.
Forget All the Hype, Hunches and Hearsay
All too many investors choose stocks based on little more than tips, opinions and rumors. You might hear a pundit say a stock that just fell 30% is now “undervalued.” Or an investing newsletter might promote a company with no sales and profits but a “promising” product in the pipeline. Going on nothing more than a hunch or interesting story, many folks will just jump right in.
But that kind of wishful-thinking, impulsive speculation rarely ends well. Fortunately, it’s also totally unnecessary.
You’ll find that having rules and checklists—and sticking to them—will be the real “secret” to increasing the amount of money you make.
So instead of picking stocks based on hype and hunches, focus on the facts. Use the Buying Checklist to make each stock prove itself before you buy.
Think of using this checklist like building the foundation of your home. If you want to create a solid portfolio, don’t start by cutting corners and using cheap, inferior materials. Take the time up front to do it right. If you focus on stocks that have these CAN SLIM traits, you’ll be creating a solid foundation for success rather than a shoddy structure that more closely resembles a house of cards.
Stay disciplined and picky. Only about 1% to 2% of stocks will make the grade, but that’s the point: You’re not looking for unproven or run-of-the-mill companies. You only want the best-of-the-best A players on your team. The Buying Checklist will help you build that winning lineup.
• CHECK THE CHART BEFORE YOU BUY •
Big Rock #1: Only Buy Stocks in a Market Uptrend. Take Defensive Action as a Downtrend Begins.
It’s no coincidence that the very first item on the Buying Checklist deals with general market direction.
The reason is simple: A stock may earn stellar grades for the first six CAN SLIM® traits, but if the “M” (Market Direction) fails, look out!
We touched on this earlier, but we’ll come back to it again and again because it’s critical that you understand this fact and take it to heart:
3 of 4 stocks simply move in the same direction as the general market, either up or down.
How does that impact you?
 If you buy during a market uptrend, you have a 75% chance of being right.
 If you buy during a market downtrend, you have a 75% chance of being wrong.
I think you’ll agree: That’s a very compelling reason to stick with the checklist and only buy stocks when the market is in an uptrend.
Of course, the question is: How can you tell which way the market is trending right now?
Let’s find out using the checklist …
Buying Checklist
Big Rock #1: Only buy stocks in a market uptrend. Take defensive action as a downtrend begins.
 Market in confirmed uptrend
 Market in confirmed uptrend
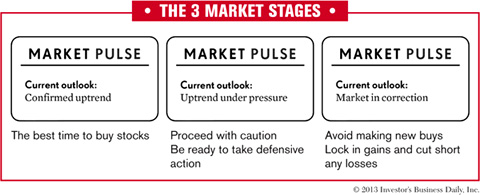
As we saw earlier, the general market is always in 1 of 3 stages: “Confirmed uptrend,” “Uptrend under pressure,” or “Market in correction.”
You can see which stage we’re currently in just by checking the Market Pulse inside The Big Picture column found in IBD every day. (In Chapter 5, “Selling Checklist,” we’ll cover what to do when the market stage is “Uptrend under pressure” or “Market in correction.”)
Can You Really Time the Market?
Conventional wisdom says no. Actual market history says yes.
The Current Outlook in the Market Pulse changes based on certain signals that appear every time a major shift in trend occurs.
Now keep in mind: Saying you can time the market does not mean you’ll sell at the very top and buy at the very bottom. And it does not mean you can predict where the market will be six months from now.
But it does mean you can spot when a potential new uptrend has begun. And you can see when the market is starting to weaken and roll over into a downtrend.
This isn’t about predicting the future. It’s simply about understanding what is going on in the major indexes right now: Are institutional investors pushing the indexes higher by continuing to buy, or are they driving the market down by selling more aggressively?
No crystal ball required here: Simply understanding the current direction is enough to build yourself a financially secure future. As you can see in the next two figures, following the 3 stages in the Market Pulse will help you make money when the market is up—and protect those profits when selling pressure mounts and a downtrend begins. (Also go back and look at the two examples we covered in Chapter 1, “Start Here.”)
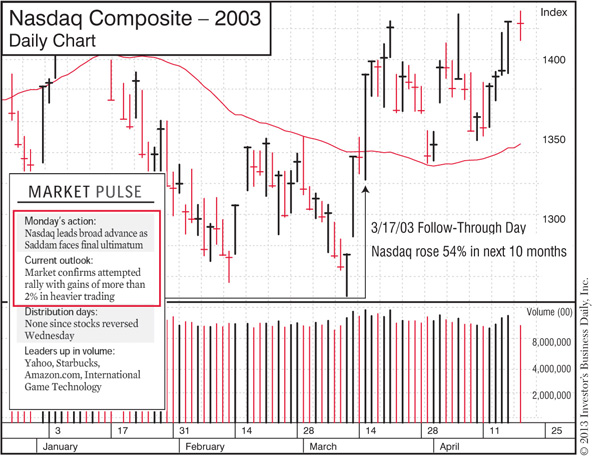
Following the bear market caused by the dot-com bust, the Market Pulse alerted readers to the start of a new uptrend.
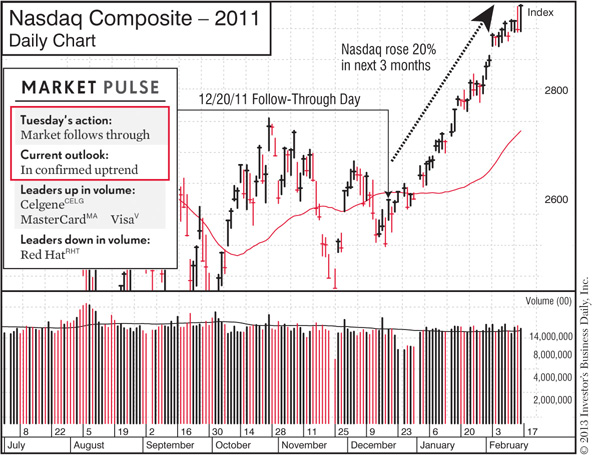
After several months of volatility, the Market Pulse noted the start of a new uptrend in December 2011, giving investors a chance to profit as leading stocks launched new runs.
“See” How to Time the Market
 Learn more about how to spot changes in market trends with short videos at www.investors.com/GettingStartedBook.
Two Signs of a Change in Market Trend
Below is a brief explanation of the two main signals that indicate a shift in market direction: “Follow-through days” that note the start of a new uptrend, and “distribution days” that alert you to a weakening market.
Since this book is focused on helping you get started, I’ll just cover the basics here. You can dig deeper by taking the Action Steps at the end of this chapter and by doing the “Must-Do Steps” we discussed in the Introduction.
You Don’t Have to Track These Changes on Your Own
If the market shifts from a correction to an uptrend or vice versa, you’ll know it just by looking at the Market Pulse. So while it’s definitely helpful to understand the mechanics behind follow-through days and distribution days, don’t worry if it doesn’t sink in on the first go. Remember, investing is a skill best learned in stages. You can dig into more details and advanced topics later.
“Follow-Through Days” Mark Start of New Uptrend
When the market is in a correction, how can you tell if the direction has changed and a new uptrend has begun?
Look for a “follow-through day.”
IBD’s ongoing study of every market cycle since 1880 has found that no sustained uptrend has ever begun without a follow-through day.
So when you’re in a down market and wondering when it’ll be time to get back in, don’t guess. Wait for this time-tested signal to appear and the Market Pulse outlook to shift from “Market in correction” to “Confirmed uptrend.”
How Does a Follow-Through Day Work?
Let’s answer that by seeing how the March 12, 2009 follow-through day marked the end of the severe 2008 bear market and the start of a robust new bull cycle.
Think back to what the mood in the country was at that time. In 2007–2008, the housing market had tanked, and the entire financial system had been shaken to the point of near collapse. The Nasdaq had lost over half its value since the start of the bear market in November 2007, and countless investors had suffered similar losses. (Of course, anyone who followed the Selling Checklist in this book would have avoided any serious damage. Hint, hint …)
So by March 2009, a lot of folks had taken a beating and were in no mood to jump back into the stock market anytime soon. The doom and gloom headlines only seemed to confirm those fears.
But for investors who understood how market cycles work, the signs of a potential new uptrend were there—as were the tremendous money-making opportunities that emerge at the beginning of every new bull market.
That brings up another important fact: New market uptrends tend to begin when the economic and other news is bad.
That’s why the follow-through day is such a valuable tool: Instead of wringing your hands at the latest headlines and trying to guess when the market might turn around, just wait for a follow-through day, knowing that new uptrends never begin without one.
We’ll get into how to read charts later in Chapter 6, “Don’t Invest Blindly,” but for now let’s just walk through the “story” the Nasdaq chart was telling you as the market began to rebound.
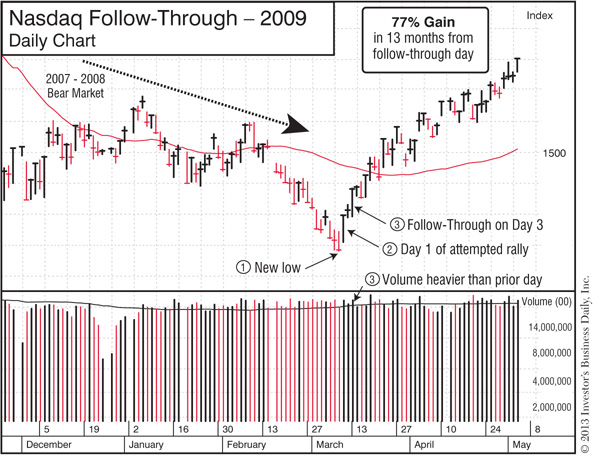
See below for an explanation of points 1 through 3 and how follow-through days alert you to new market uptrends.
1. New Low: When the market is in a downtrend, look for at least one of the major indexes (S&P 500, Nasdaq, or Dow) to hit a new price low. The Nasdaq did that on March 9, 2009 (Point 1 in the previous chart).
2. Attempted Rally: After hitting that new low, look for a day when the index closes higher. That might mean the index has stopped its decline, established a new “bottom,” and is on its way to a rebound.
The Nasdaq did that on March 10, when it made a nice gain on higher-than-normal volume (Point 2). What does that above-average volume tell you? That institutional investors are buying—a bullish sign. But one up day isn’t enough to tell if the market trend has truly changed. So we count that as Day 1 of an attempted rally.
3. Follow-Through Day: Once the attempted rally is under way, we start looking for a follow-through day to confirm that a new uptrend has begun. Here are the basic requirements:
 Typically occurs sometime after Day 3 of the attempted rally. Many occur between Days 4–7, but they can come later. The March 12, 2009, follow-through actually occurred on Day 3, which is fairly rare (Point 3).
 The index should make a big one-day price gain, typically 1.5% or higher, on volume heavier than the prior day.
Get Back in Gradually After a Follow-Through Day
Not every follow-through day leads to a big, sustained uptrend. About one-third will fail, and the market will quickly fall back into a correction. That’s why you want to get back into the market gradually when a follow-through day occurs and the Market Pulse shifts from “Market in correction” to “Confirmed uptrend.”
If the uptrend takes hold and the leading CAN SLIM stocks start to move higher on heavy buying by institutional investors, you can start to get in more aggressively. If the uptrend fails, use the Selling Checklist and move safely back to the sidelines.
What to Do When a New Uptrend Begins
 See my 2-Minute Tip video on “What to Do After a Follow-Through Day” at www.investors.com/GettingStartedBook.
“Distribution Days” Alert You to a Weakening Market
When the market is in an uptrend, you know at some point the tide will turn and a new downtrend will begin. You can see when that shift may be occurring by looking for what we call “distribution days”—days of heavy selling in the major indexes. (“Distribution” is just another word for selling.)
A distribution day is when one of the major indexes closes down at least 0.2% on volume heavier than the day before. (Stalling action—when the trading volume increases, but the closing price barely budges—can also count as distribution.)
We’ll get into how to handle a weakening market when we go through the Selling Checklist, but here’s the key point: A rising number of distribution days shows that institutional investors are beginning to sell more aggressively. And we’ve already seen, it’s the enormous buying (and selling) power of mutual funds and other big investors that ultimately drives the market—and individual stocks—either up or down.
Of course, fund managers try not to sell so aggressively that it becomes obvious to everyone what they’re doing. Yet their size and trading volume make it difficult to hide. That’s why tracking distribution days is so important: It helps you gauge how serious the selling is and see if a true change in trend is emerging.
When the number of distribution days begins to mount, the Market Pulse outlook shifts from “Confirmed uptrend” to “Uptrend under pressure.” That’s a warning sign that more trouble may be on the way.
That selling may ease and fade away, allowing the market to continue its climb. But if that downward pressure picks up steam, look out!
If you get 6 distribution days within any 4- or 5-week period, the uptrend will typically roll over into a downtrend. You can see the current number of distribution days in the Market Pulse, and if you get enough days, the Current Outlook will shift to “Market in correction.”
See the following S&P 500 chart for an example of how distribution days mount, and the Market Pulse changes from “Confirmed uptrend” to “Uptrend under pressure” and finally to “Market in correction.”
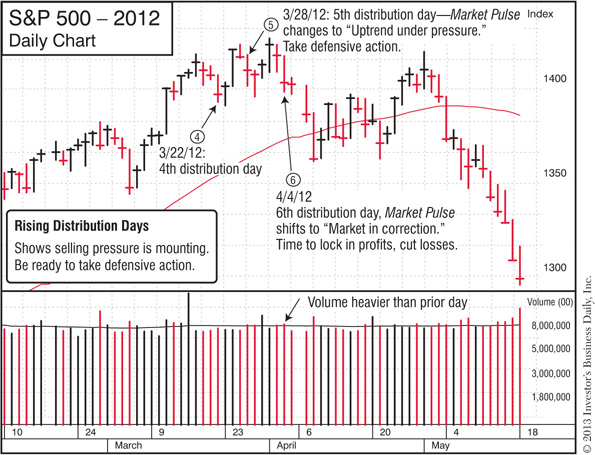
Protect your money: Take defensive action when distribution days start to mount.
We’ll see how to handle that type of weakening market in Chapter 5, “Selling Checklist.”
Feeling a Little Overwhelmed?
 I don’t blame you—it’s a lot to take in! But don’t forget: You don’t have to track all of this on your own. Just check the Market Pulse to instantly see which way the market is currently headed.
5 Things You Need to Know About Market Cycles
1. Your Goal is to Make Money When the Market is in an Uptrend—and Protect Those Profits as a Downtrend Begins
I mentioned earlier how I learned this lesson the hard way. Like millions of other investors, I made a lot of money in the bull market of the mid- to late-1990s, but gave back much of those gains when the dot-com boom ended in 2000.
Even back then, I knew the stock market was “cyclical,” but I didn’t understand what impact those cycles have on my portfolio. I didn’t know:
 How to tell when the market trend is changing?
 What action to take when that change occurs?
Most folks don’t. And that’s not surprising since we’re constantly told that (a) you can’t time the market, and (b) “buy and hold” is the “safe” approach. Those market myths have cost a lot of people a lot of money.
But now you see how the market actually works. “Buy and hold” investors may make money in a strong market uptrend, but they’ll likely give it all back (and then some!) when a sharp downturn hits.
By using the buying and selling checklists in this book, you can unstrap yourself from that market roller coaster. Sticking to basic rules will help you generate solid profits when the market is up and lock in the bulk of those gains when the trend changes.
2. Know Where You’re at in the Market Cycle
We all know a “bull market” is when the market is moving higher, and a “bear market” means it’s trending down.
But it’s important to understand that even within a bull market, you will have what we call “interim corrections.” The major indexes will take a rest and pull back for a few weeks or a couple of months, then resume their climb. The depth of these interim corrections varies, but the Nasdaq or S&P 500 might pull back somewhere around 10% to 15%. That’s a fairly mild decline—not enough to change the underlying bull market uptrend.
As a general rule, a decline of under 20% indicates an interim correction. A drop of 20% or more constitutes a bear market.
The following figure shows an example of how that works.
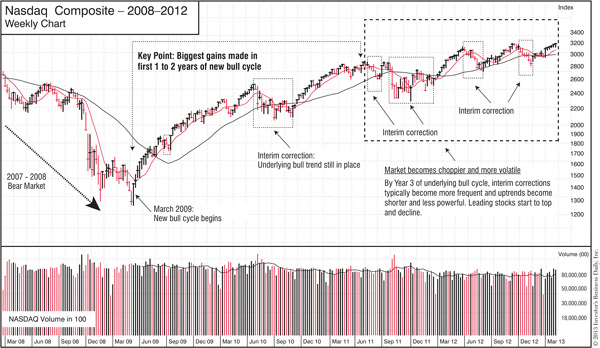
Regularly read The Big Picture column to know if we’re in the early or later stages of the current market cycle.
How Long Do Bull and Bear Markets Typically Last?
The length varies, but here are some general guidelines:
 Bull markets typically last 2 to 4 years.
 Bear markets typically last 8 to 9 months.
Why Should You Pay Attention to What “Stage” the Bull Market Cycle Is In?
Because the really big gains typically happen within the first two years of a bull market.
By the time you get into the third year of a bull cycle, two things tend to happen:
 The market becomes more choppy and volatile. That’s a sign the bull is getting tired, and the enthusiasm found at the beginning of the cycle is starting to fade. Interim corrections may become more frequent and deep. But as long as the bull market uptrend remains in place, you may still find plenty of money-making opportunities. Just stay on your toes and stick to the buying and selling checklists since you know a bear market will emerge at some point.
 Leading stocks start to peak and roll over. As they say, nothing goes up forever. In the later stages of a bull market, institutional investors will start to cash out of the big leaders—and when they start to sell, those stocks start to drop.
When that happens, it doesn’t matter how great the company’s earnings growth and products may be, it’s time for you to protect your hard-earned profits. Whether it’s Apple, Google, Netflix, Chipotle Mexican Grill, or any other leading stock in any bull market, at some point you’ll need to lock in your gains—and that becomes particularly important when a bear market begins to take hold. (More on that in Chapter 5, “Selling Checklist.”)
Find Out What Stage the Market is in with The Big Picture
 If you regularly read The Big Picture column, you’ll always have a good sense of where we’re at in the current market cycle—and what steps you should take to handle it.
3. Always Stay Engaged—Even in a Down Market
One of the biggest mistakes you can make is to stop doing your routine and ignore the market just because it’s currently in a correction.
Even in a severe market downtrend, we’re never more than four days away from the start of a potential new rally. That’s all it takes for a follow-through day to occur and switch the Market Pulse outlook from “Market in correction” to “Confirmed uptrend.”
And as you’ll see in #5 below, if you don’t keep your watch list up to date while the market is down, there’s a good chance you’ll miss the biggest money-making opportunities in the next uptrend.
Think of a downtrend like the off-season in baseball. You’re not buying stocks right now, but if you want to have stellar results when a new “season” begins, you need to stick to your training regimen in the off-season. You never want to be out of shape on “Opening Day” when that new uptrend begins.
4. Look for New Leaders in a New Bull Market
In every bull market cycle, a new group of top-rated CAN SLIM stocks emerges to lead the market higher. They’ll often double or triple in price in just 1 to 2 years. Some will go up even more.
They’ll be the innovative leaders in whatever new inventions or industries are driving that particular bull market. In the 1990s, it was the Internet revolution and the rise of cell phones and personal computers that propelled the market higher. No surprise, then, that it was the companies driving those innovations—AOL, Qualcomm, Yahoo!, Amazon, Cisco, and others— that became the big market winners.
But here are two other things you need to know about leading stocks:
 When leaders eventually peak and begin to decline, they drop 72% on average.
 Only about 1 in 8 stocks that led in the prior bull market go on to lead again in the next one.
We’ll get into that in more detail in Chapter 5, “Selling Checklist,” but here’s the point: When a new bull market begins, don’t stay focused on past winners. Look for new leaders.
That’s how you capture big gains—and you can find the next crop of winning stocks by regularly doing the Simple Weekend Routine, especially when the market is still in a correction.
5. The Big Money is Made in the Early Stages of a New Uptrend
Think of a market correction like a forest fire. It ain’t pretty, but it’s a necessary part of the cycle.
The forest fire burns down the old trees to make room for new growth. And the heat of the fire pops open the seeds so new trees can take root.
Same with the market. During a correction, most of the past leaders fall and a new crop of CAN SLIM innovators—the new growth—emerges.
But just as a new tree can’t grow while the fire is still burning, a new leading stock can’t shoot higher while the market is still in a correction.
However, as soon as that market “fire” dies down and a new uptrend begins, the next crop of leaders take off. In fact, you’ll find that:
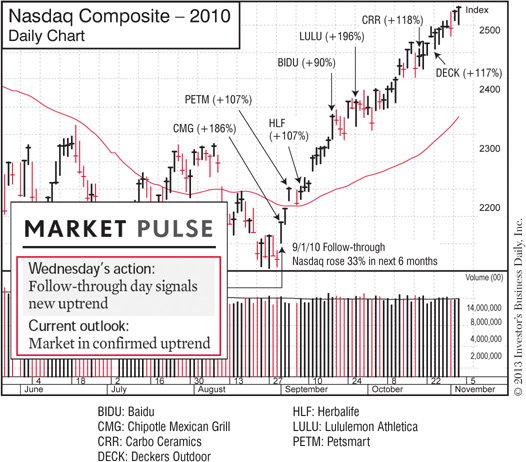
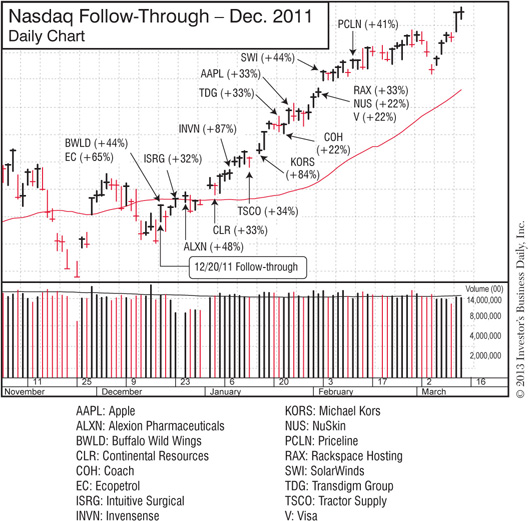
Winning stocks often launch their big moves right on or immediately after a follow-through day.
This happens at the start of every strong new uptrend. Below are examples of how the top stocks took off right when follow-through days occurred in 2003, 2010 and 2011. As you look at the charts, note how these new leaders started their runs within days or just a couple of weeks after the Market Pulse shifted from “Market in correction” to “Confirmed uptrend.”
Also keep this in mind: You’ll typically find such stocks highlighted in the IBD 50 and/or Your Weekly Review before they launch these big moves. By using the Simple Weekend Routine, you can have such stocks on your watch list as they start those big price runs.
How Top Stocks Launch New Runs Right When a New Market Uptrend Begins
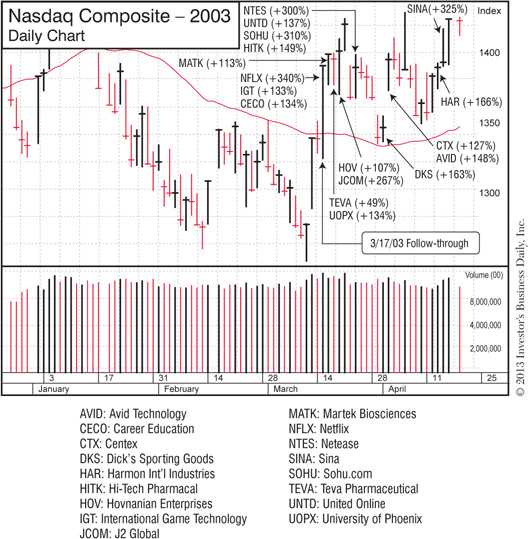
See how all the market cycle pieces fit together?
 Make money in an uptrend—and protect your profits as a downtrend begins.
 Focus on “new growth”—not past leaders.
 Keep doing your routine and building your watch list during the downtrend.
 If you don’t stay engaged while the market is down, you’ll likely miss the next crop of big winners that shoot higher right when a new uptrend begins.
I hope this makes clear why you definitely need to understand how market cycles work—and how easy it is to stay in sync with those trends. Just check the Market Pulse and read The Big Picture regularly.
And as you’ll see when we get into the Simple Weekend Routine, you can also spot the next group of potential winners by regularly checking the IBD 50, Your Weekly Review, and other lists that highlight today’s CAN SLIM stocks.
The Trend Is Your Friend
It’s an old cliché, but it’s stuck around all these years for a reason: It’s true!
You will build a solid foundation for making money in stocks if you simply buy when the market is trending up, and protect yourself when it starts trending down.
Everything flows from understanding market cycles and the current market direction.
In a strong uptrend, the top-rated CAN SLIM stocks will give you multiple opportunities to make significant profits. By following the rest of the Buying Checklist and the Simple Weekend Routine, you can have them on your watch list, ready to act when those opportunities arise.
Next up: Let’s see what specific traits to look for as you search for the next big winners.
• ACTION STEPS •
Big Rock #2: Focus on Companies with Big Earnings Growth and a New, Innovative Product or Service
Big, Accelerating Earnings Growth is the #1 Factor in Choosing a Stock
It’s the primary trait that attracts fund managers and other institutional investors—the big players that provide the needed fuel for a stock’s big run.
And what drives that explosive earnings growth? It’s usually a game-changing product or service, new management, a major new industry trend—or some combination of all of the above.
Just think back to some of the biggest winners over the last 100+ years.
IBM: In the 1920s, IBM’s high-tech punch card machines were revolutionizing how large organizations kept records. Starting in 1926, IBM soared 1,992% in 168 weeks.
Brunswick: Bowling was extremely popular in the 1950s, and Brunswick came out with a game-changing product: Automatic pin-spotters for bowling alleys. Earnings soared and the stock shot up 1,500% in 162 weeks.
Home Depot: The new “big-box store” would forever change the hardware and do-it-yourself industries. In 1982, the stock bolted 892% in 64 weeks.
AOL: In the early 1990s, cyberspace was the realm of tech-savvy geeks. Then AOL created a fun and easy way for everyone to go online. Starting in 1994, the stock rose 570% in just 75 weeks.
Crocs: In 2006, what caused this shoemaker’s stock to soar 431% in only 59 weeks? The unmistakable “Crocs craze” created by its unique—and seemingly ubiquitous—new line of casual footwear made of a proprietary resin.
And that doesn’t even mention major moves by Google, Apple, Priceline, Netflix, Baidu, F5 Networks, Intuitive Surgical, cloud computing leaders Rackspace Hosting and SolarWinds, or 3D printing innovators 3D Systems and Stratasys, just to name a few.
What did they all have in common as they made their big moves? Big earnings growth driven by a hot new product or industry trend.
Not every stock you buy will be one of these big winners, but a new crop of innovators does emerge in every new bull market cycle. They’re the true market leaders that have the potential to go up 100%, 300%, 500%, or more. And since they share the same CAN SLIM® traits, you’ll find them highlighted in features like the IBD 50, Sector Leaders, and Your Weekly Review.
Think what catching just one or two of these stocks in the next big uptrend could do for your portfolio.
Let’s see how you can make that happen using the Buying Checklist.
Buying Checklist
Big Rock #2: Focus on companies with big earnings growth and a new, innovative product or service.
 Composite Rating of 90 or higher
 EPS Rating of 80 or higher
 EPS growth 25% or higher in recent quarters
 Accelerating earnings growth
 Average Annual EPS growth 25% or more over last 3 years
 Sales growth 25% or higher in most recent quarter
 Return on equity (ROE) of 17% or higher
 SMR® Rating (Sales + Margins + Return on Equity) of A or B
 New products, service, or management
 Among the top-rated stocks in its industry group
 Ranked in top 40–50 of IBD’s 197 industry groups
IBD SmartSelect® Ratings
A big part of the Buying Checklist is making sure your stock gets passing grades for IBD SmartSelect Ratings, which show how strongly a company fits the CAN SLIM profile. You’ll find these unique ratings in Stock Checkup on Investors.com and in the IBD Smart NYSE + NASDAQ Tables(Chapter 7) in the Making Money section of Investor’s Business Daily.
It’s All Relative
With the exception of the Accumulation/Distribution Rating, each rating is relative. In other words, they show how your stock compares to all other stocks on the market.
That’s a huge advantage, instantly separating the leaders from the laggards.
For example, the Earnings-Per-Share (EPS) Rating goes from 1 (worst) to 99 (best). A 95 rating instantly tells you the company is outperforming 95% of all other stocks in terms of both current and annual earnings growth. A 99 Composite Rating means the company’s overall strength puts it in the top 1% of all stocks.
Think how easy that is—and how much time it saves.
For example, we saw that big earnings growth is the #1 factor to look for in a stock. With one glance at the EPS Rating, you know how your stock’s earnings growth stacks up against every other company on the market.
As we go through the checklist, you’ll see what each rating measures and the minimum grades to look for. While you never want to buy a stock just because it has a high rating, these grades save you a tremendous amount of time by identifying stocks that do—and don’t—have the CAN SLIM traits.
Unless otherwise noted below, ratings range from 1 (worst) to 99 (best).
Overall Strength
 Composite Rating of 90 or higher
The Composite Rating combines all the IBD SmartSelect Ratings into one, with more weight on the EPS and Relative Strength (RS) Ratings.
A rating of 90 or higher tells you that, in terms of overall fundamental and technical strength, the stock is outperforming 90% of all other stocks.
A rating of 90 is the minimum. You’ll find the true market leaders have a Composite Rating north of 95 and often have the highest-possible score of 99.
Earnings Growth
 EPS Rating of 80 or higher
We saw earlier that you need to look at Current quarterly earnings growth (the “C” in CAN SLIM) and Annual earnings growth (the “A”). The EPS Rating measures both.
An EPS Rating of 80 tells you the company’s earnings-per-share growth is in the top 20% of all stocks. You’ll find the biggest winners often have a 95 or higher EPS Rating prior to launching a major move.
 EPS growth 25% or more in recent quarters
As a minimum, you want to see earnings-per-share growth of 25% or higher in recent quarters. But you’ll often find top performers have even more impressive numbers prior to launching their big moves.
For example, in the two quarters before Google shot up 558% in just over three years starting in 2004, it posted EPS growth of 155% and 143%. And in 2006, shoe maker Crocs also showed two quarters of explosive earnings growth—122% and 330%—before its share price skyrocketed 431% in just over a year.
 Accelerating earnings growth
Ideally, EPS growth should be big and accelerating (i.e., increasing quarter over quarter). That shows the company is continuing to grow its profits.
It’s a warning sign if a stock’s EPS growth rate starts to decelerate and move in the wrong direction. The stock market is forward looking, and institutional investors are looking for increasing—not declining—growth.
Case in point: As we saw in the earlier CAN SLIM case study, in the three quarters before Ulta Beauty surged 165% from September 2010 to July 2011, its EPS growth accelerated from 56% to 62% to 188%.
 Average Annual EPS growth of 25% or more over last 3 years
A company can cut costs or take other measures to drive up its earnings per share for a quarter or two. That can mask more serious underlying problems the company may be facing in terms of demand for its products, declining profit margins, or negative industry trends.
That’s why you also want to make sure the company is delivering solid annual EPS growth.
Here again, 25% annual growth over the last three years is the minimum. The top stocks often post numbers that dwarf that. Going back to Google in 2004, its three-year annual EPS growth rate was 293% before it launched its five-fold gain.
Sales Growth and Return on Equity Does your stock have the key ingredients that drive earnings growth?
Since big, accelerating earnings growth is the #1 factor to look for, make sure the company has the basic ingredients that generate that type of earnings performance: Superior sales, a high return on equity, and industry-leading profit margins.
Sales growth shows how much demand there is for the company’s products or services. Profit margins and return on equity gauge how efficiently the company is generating that sales revenue. All three factors ultimately impact a company’s earnings growth.
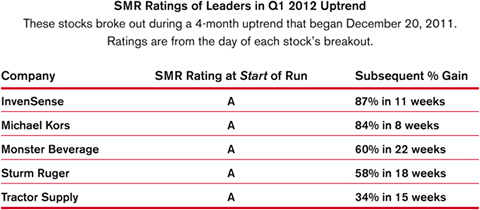
 SMR Rating of A or B
SMR Rating: Sales, Profit Margins and Return on Equity
The quickest way to see if a stock has the ingredients that drive earnings is to check the SMR Rating. It measures a company’s S ales growth, profit M argins (both pre-tax and after-tax) and R eturn on equity. Then it compares that to the performance of all other stocks and assigns a rating from A (best) to E (worst).
An A rating means that, in terms of sales, margins and return on equity, the company is in the top 20% of all stocks.
Keep in mind, too, that the SMR Rating is a more accurate gauge than if you looked at these three factors in isolation. For example, a company could have rising sales growth but shrinking profit margins—which could have a negative impact on EPS growth down the road. By looking at the more comprehensive SMR Rating, you get the full picture.
If a stock has good earnings growth but weak sales, profit margins, and ROE, beware! That EPS growth may be less impressive—and less sustain-able—than it appears.
In general, you want to buy stocks with an A or B SMR Rating and avoid those with a D or E. The next table shows why that’s important.
 Sales growth 25% or higher in most recent quarter
If sales growth is less than 25%, it should at least be accelerating over the last three quarters.
For example, look at Netflix’s sales growth just before it rocketed 683% from March 2009 to July 2011. It was under the 25% growth you prefer but was accelerating.

Ideally, you’d see three quarters of acceleration in both sales and earnings.
 Return on equity (ROE) of 17% or higher
Return on Equity separates the best-run companies from the also-rans.
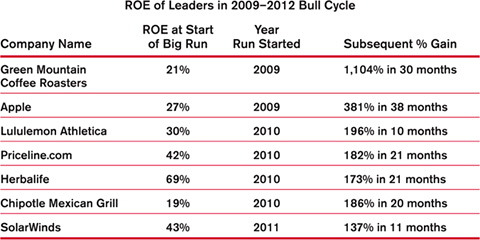
I have to say, in my countless conversations with investors over the years, return on equity is one of the most overlooked factors. (IBD calculates ROE by dividing net income by average shareholder equity over the last two years.) But it’s a critical clue to look for when picking a stock: A strong return on equity identifies the best-run companies making the most efficient use of their capital. Ultimately, that leads to higher profitability and earnings growth.
A 17% return on equity is the minimum benchmark, but stocks that go on to make monster moves often sport an ROE of 25%, 35% or more. The bigger, the better. The following table shows why that’s true.
 New products, service or management
“Out with the old, in with the new.” That could be the official mantra for the stock market, which is always looking ahead in search of companies with new, paradigm-shifting products and services.
Such leaders emerge in every bull market cycle, and here are some quick ways to see if your stock has the “N” in CAN SLIM:
 Check the company’s website and press releases.
 Read IBD stories about the stock on Investors.com. Pay special attention to The New America section (Chapter 7), which profiles innovative companies every day.
 Learn what companies featured in IBD lists actually do. Pay particular attention to stocks highlighted in the IBD 50 and Sector Leaders lists.
As we saw in the earlier CAN SLIM case study, Apple is an example of an established company that rejuvenated itself—and its stock—with new, innovative products.
More often, you’ll find groundbreaking innovations in younger, entrepreneurial companies—often those that had their initial public offering (IPO) within the last 15 years, many within the last 7 to 8 years.
In every major uptrend, these game-changers emerge to lead the market’s advance, driven by some product or service that’s revolutionizing how we work or live.
You may have never even heard of these companies at that point. But as you search for stocks with CAN SLIM traits, they’ll naturally start to appear on your radar screen.
I had never heard of Alexion Pharmaceuticals, F5 Networks, Stratasys, Lululemon Athletica, SolarWinds, Mellanox Technologies, Transdigm, or Tractor Supply until they started showing up in IBD’s stock lists. But they all had something new, and that was driving exceptional earnings and sales growth. That’s why they showed up early on our screens—and that’s why they all made impressive price gains during the bull market that began in 2009.
Don’t Ignore a Stock Just Because You’ve Never Heard of the Company
If it has the “N” and other CAN SLIM traits, get to know more about it: Go to their website, and read articles and profiles in IBD and other sources. You might be looking at a stock that could double or triple in price.
In 2009, not many Americans had heard of Baidu. I’m sure many still haven’t.
Called the “Chinese Google,” Baidu emerged as the dominant search engine in China as millions of new Internet users came online. It was a strong new leader in a new and rapidly growing industry and rose 401% from September 2009 to April 2011. (Using the Simple Weekend Routine, you could have seen Baidu highlighted in the IBD 50, Your Weekly Review and other IBD features multiple times as it made that big move.)
New Industry Trend
The “N” in CAN SLIM can also refer to a new industry trend, which can be a boon for companies in that field, especially for the innovators driving that change.
The emergence of cloud computing is a good example. There’s been a major shift away from running applications and storing data on a local computer, and instead pushing that functionality to the online “cloud.” That’s meant big business—and nice share price gains—for leaders in that industry, such as Rackspace Hosting, SolarWinds, and Amazon.
That’s just one example. The company names and industry trends are always changing. So regardless of what the latest technology or innovations are when you’re reading this, here’s the key question to ask: Is the stock you’re reviewing benefiting from a significant new industry trend, and is it one of the companies leading that change?
New Price High
Here’s another “new” thing you should know about the best stocks: They usually start their big moves as they hit or close in on a new price high (i.e., the highest share price the stock has hit over the last 52 weeks).
We’ll talk more about that when we get into charts in Chapter 6, “Don’t Invest Blindly,” but just keep this in mind: Stocks hitting new lows tend to go lower. Stocks hitting new highs tend to go higher.
Translation: Don’t go “bargain” hunting for beaten down stocks—chances are they’ll go even lower. Instead, focus on stocks showing strength as they move upward to new price highs.
New Does Not Mean Unproven
You’re not looking for companies making promises of a revolutionary new product or service. Those may pan out, they may not.
You’re looking for companies with new products already on the market showing strong demand. That demand is reflected in the company’s fundamentals we noted earlier: Rising sales revenue, high profit margins, and accelerating earnings growth.
Whether it’s a young company making its initial public offering (IPO) or an established outfit with a new product, make it prove itself by showing CAN SLIM traits before you buy.
The Facebook Fiasco
Look at what happened to Facebook when it debuted in 2012. It was a new IPO in a new and growing industry—social media. And it was the dominant player in that space. So it got high marks for “new” but did not pass the rest of the Buying Checklist.
Remember how we saw that big, accelerating earnings growth is the #1 factor to look for—and that you want to see particularly strong EPS growth over the last three quarters?
Facebook showed the exact opposite. Just prior to its IPO, it posted three consecutive quarters of decelerating earnings, dropping from 83% to 17% to 9%. Sales growth was also trending down.
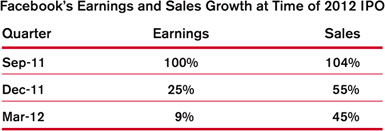
So despite all the buzz and pre-IPO hype, you could have looked objectively at Facebook and seen the bottom-line facts: Sales and earnings were both heading in the wrong direction. And what happened next? From its May debut through August, the stock dropped 50%.
Down the road, Facebook may have all the pieces of the puzzle in place, but if you had used this Buying Checklist, you would have clearly seen that—even prior to the IPO—the stock did not earn a passing grade. And in the company’s first two reports after going public, Facebook reported 0% earnings growth.
Remember: Never buy a stock just because someone recommends it or because with all the buzz, you’re “sure” it will go up. Instead, pick stocks based on rules: Make every stock prove itself by passing the Buying Checklist.
 Among the top-rated stocks in its industry group
Here’s a simple rule of thumb for successful investing: Focus on the top-rated stocks in the top-ranked industry groups. This part of the checklist shows if your stock fits that bill.
Stock Checkup shows the Top 5 stocks in each industry group based on IBD SmartSelect Ratings. In general, you want to focus on the #1 or #2 stock in the group in terms of Composite Rating.
Keep in mind: “Top-rated” does not necessarily mean “best-known.”
Here’s an extreme example: Everyone knows mortgage giant Fannie Mae, but its stock completely collapsed during the 2008 housing crisis, and by August 2012, it had already been delisted from the Nasdaq and was trading around 25 cents a share. Yet its industry group was ranked #1 out of the 197 groups IBD tracks.
So what was the “top-rated” stock in Fannie Mae’s Finance–Mortgage & Related Services group?
The lesser-known—but much more profitable—Nationstar Mortgage Holdings. It certainly wasn’t a household name like Fannie Mae, but it had explosive earnings growth of 600% and 999% in the two quarters since going public in March 2012. And from May to August 2012, Nationstar’s stock jumped 88% in just 14 weeks.
Is Your Stock a Leader Within its Industry Group?
Nationstar Mortgage vs. Fannie Mae
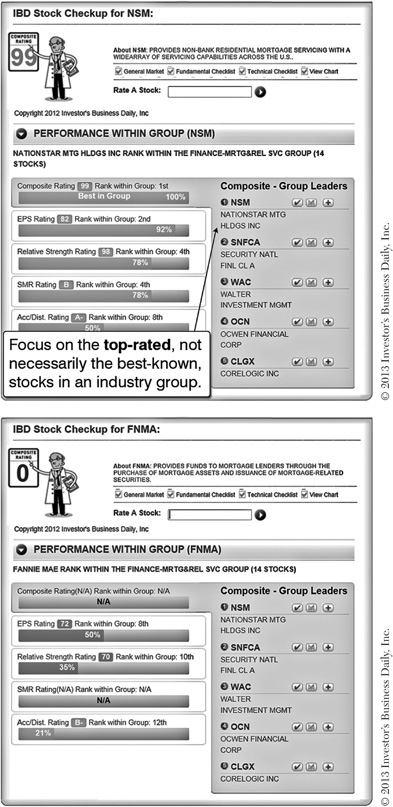
Nationstar Mortgage’s “Best in Group” ranking and 99 Composite Rating showed it was the true industry group leader.
 Ranked in top 40–50 of IBD’s 197 industry groups
As IBD founder Bill O’Neil has said, “You cannot overstate the importance of being aware of new group movements.”
Almost half of a stock’s price move depends on the strength of its industry group and sector:

That means your stock has a better chance of moving up if its industry shows strength. Here’s why.
As we’ll see in detail later, it’s the buying and selling power of institutional investors that ultimately pushes the general market and individual stocks up or down.
So when they shift their money into a certain sector or industry group, that sector or group will move up in the rankings. You want to follow their lead and put your money into the same industries. (And on the flip side, when a sector or industry group starts to sink in the rankings, beware! Get ready to take defensive action since the stocks within that industry will likely decline as big investors sell their shares and move that money somewhere else.)
How to Track Sectors → Industry Groups → Group Leaders
You can see where institutional investors are putting their money by regularly checking IBD’s rankings for 33 sectors and 197 industry groups. Then, as we saw earlier, you can see which particular companies are the leaders within each group by checking the five top-rated stocks in Stock Checkup. The following graph outlines how that works.
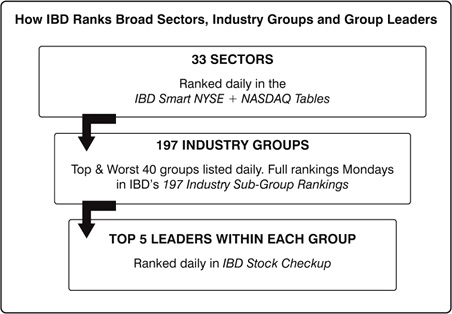
We start with sectors, dividing all stocks into broad categories like Retail, Building, Computers, Energy and Medical. Those 33 sectors are then ranked daily based on the price performance of the stocks within each sector.
That’s an important first step, but it doesn’t tell you the whole story. To more clearly pinpoint where institutional investors are putting their money, check the industry group rankings.
IBD’s 197 industry groups break down the broad sectors into smaller factions made up of stocks that are closely aligned in terms of the specific business they’re in.
This is crucial because, for example, Retail may be the #1 sector, but which specific groups are leading that growth? Which groups are lagging?
There are 18 different industry groups within the Retail sector, including Consumer Electronics, Discount & Variety, Internet, Leisure Products, and Restaurants. You want to know which ones are showing the most strength and moving up in the rankings—because you want to see where institutional investors are putting their money.
Rise of the Discounters
Here’s just one example of why checking industry group rankings is an important part of your stock-picking process …
In February and March 2010, the Retail sector was consistently among the top five sectors. Within that sector, the Retail–Discount & Variety industry group was moving sharply higher in the rankings: In mid-March, the group was ranked #25 out of the 197 groups, up from #176 seven months earlier.
Remember: At that time, the economy was struggling. People on tight budgets do more shopping at discount stores, and that’s why institutional investors began shifting their money into stocks in the Discount & Variety industry group.
So it’s no coincidence that around the same time, top-rated stocks within that group started impressive runs: Those moves were being fueled by the institutional money moving into that industry.

By checking the rankings, you would have seen that another group in the Retail sector, Retail–Apparel/Shoes/Accessories, had also been moving up rapidly. As of February 24, 2010, the group had jumped from #117 to #19 over the last seven months.
Two leaders in that group also happened to be discount retailers: Ross Stores and TJX Companies, which owns T. J. Maxx and Marshalls. That further confirmed the big institutional money was flowing into operators of bargain stores. Both TJX and Ross broke out within a week and generated solid gains for investors over the next two years:

Coincidence? Not at all. Year after year, countless examples reinforce this simple strategy: Focus on the top-rated stocks in the top-ranked industry groups.
Why put yourself at a disadvantage by buying low-rated stocks in a low-ranked group?
Where to Find Industry Group Rankings
You can see the current ranking for your stock’s group in Stock Checkup.
Pay particular attention to stocks in the top 40 groups, and avoid those in the bottom 40.
You’ll find the top 40 and worst 40 groups each day in the print and digital editions of IBD. The full list of IBD’s 197 Industry Sub-Group Rankings is published every Monday. (Note: “Sub-group” and “group” are used interchangeably.)
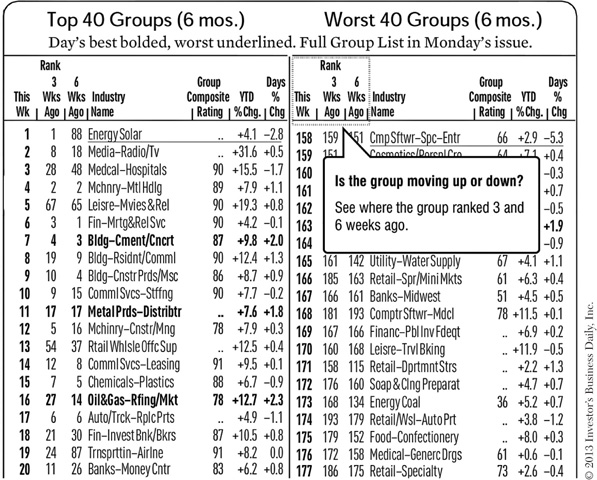
You can also see if the group’s ranking has been moving up or down. The list shows current ranking and where the group stood 3 and 6 weeks ago.
3 Key Points
We’ve gone through a lot of details, so let’s take step back for a minute and look at the 3 main takeaways from this chapter:
 Focus on companies with big earnings growth and a game-changing new product or service.
 Fish where the fish are: Look for the top-rated stocks in the top-ranked industry groups.
 Use Stock Checkup to quickly see if your stock passes or fails this part of the checklist.
Check out the Action Steps below to start using the Buying Checklist and make sure these key points really sink in.
And remember: You can find today’s top-rated CAN SLIM stocks by doing the Simple Weekend Routine (Chapter 4).
Next up: Let’s see if institutional investors are heavily buying—or selling—your stock.
• ACTION STEPS •
Big Rock #3: Buy Stocks Being Heavily Bought by Institutional Investors. Avoid Those They’re Heavily Selling.
For a stock to go up 50%, 100% or more, someone has to keep buying shares at a continually higher price to fuel that move. And they have to buy a lot of shares—hundreds of thousands, even millions. Only institutional investors— primarily mutual fund managers—have that kind of buying power.
So if you want to find stocks with the potential to double or triple in price, focus on those being bought heavily by these professional investors. It’s not a guarantee of success, but without that fuel, a stock won’t be able to make a sustained upward move.
And when those same institutional investors start to sell, look out! That high-volume selling pressure will likely push the share price sharply lower. Fighting that deluge is like trying to swim up a waterfall. You’re essentially guaranteed to get pummeled. So move to the sidelines and wait for big investors to start buying the stock again. You’ll find it’s much easier to swim with the current than against it. (More on that in Chapter 5, “Selling Checklist,” and Chapter 6, “Don’t Invest Blindly.”)
Yes, You Can See What Big Investors Are Up To
In some ways, the massive buying power of institutional investors gives them an advantage. But there is a downside for them—and an upside for you and me: They’re too big to hide what they’re doing.
The best way to literally see what they’re up to is to use stock charts. If you’ve never used charts before, I think you’ll be amazed at the “behindthe-scenes stories” they reveal—how they lift the curtain to show you if fund managers are heavily buying or selling a stock, or if they’re just sitting tight and quietly scooping up a few more shares.
I personally find it fascinating that a few simple lines on a graph can tell you so much about what’s really going on. But they can—and you’ll find that once you know what to look for, it’s really not that hard to do. In fact, in many cases, you’ll find the story is actually hard to miss. You’ll see telltale patterns stocks form just before they launch a big move and early warning signs that tell you it may be time to lock in your gains.
We’ll get into charts and what they reveal about the trading of institutional investors in Chapter 6, “Don’t Invest Blindly.” (Feel free to jump ahead to that if you’re curious.)
For now, let’s focus on some other quick ways you can see what the all-important fund managers and other institutions are up to.
Buying Checklist
Big Rock #3: Buy stocks being heavily bought by institutional investors. Avoid those they’re heavily selling.
 Increase in number of funds that own the stock in recent quarters
 Accumulation/Distribution Rating of A or B
 Relative Strength Rating of 80 or higher
 Share price above $15
 Average daily volume of 400,000 shares or more
Get Pass or Fail Ratings for Each Item
 You can instantly see if your stock gets a pass, neutral or fail rating for each item in this section of the checklist using Stock Checkup on Investors.com. If you’re near a computer, take a look at the ratings in Stock Checkup as we go through the descriptions below.
 Increase in number of funds that own the stock in recent quarters
To confirm that your stock is in demand by institutional investors, make sure the number of funds that own the stock rose in the most recent quarter. Ideally, the number of funds should be rising over the last 3 or 4 quarters.
Also, look for a material increase in the number of funds in the most recent quarter.
If that number is not increasing—or worse, if it’s decreasing—what does that tell you?
It could indicate a lack of enthusiasm for the stock among fund managers. Until they start getting in, that stock will probably not go up in any meaningful way.
How Do You Know if Fund Ownership Is Rising or Dropping?
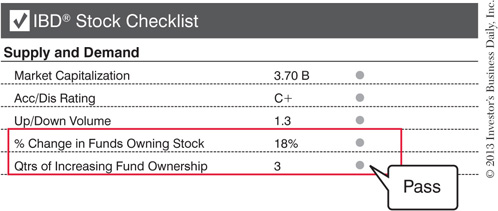
In Stock Checkup, you’ll find a pass, neutral or fail grade for your stock’s institutional sponsorship. You’ll also see how many quarters of rising fund ownership the stock has.
Don’t Be the First to Arrive at the Party!
There are many misconceptions about how the stock market actually works. One is that you have to get into a stock before the big investors do. In fact, the opposite is true: The best stocks have rising institutional sponsorship before they soar.
The mutual fund managers at Fidelity, Vanguard, Janus, Dreyfus, CGM, and elsewhere all have teams of researchers who dig into the current performance and future prospects of thousands of publicly traded companies.
If a stock is not owned by a significant number of funds (say, 50 or more), it means that at least some of the 10,000 institutional investors out there have studied the stock and decided to take a pass.
That’s not a cause for celebration, thinking you’ve somehow stumbled upon a hidden gem. It’s a cause for concern.
To see why you won’t be late if you wait for funds to start getting in, you need to understand that it can take these big institutions weeks, even months, to establish their positions in a stock.
For example, if the manager of a $2 billion fund decides he or she wants to put 1% of the fund’s capital into a certain stock, that manager has to buy a $20 million position. If the stock trades around $20 a share, that fund manager has to buy 1 million shares.
If the manager tried to buy all those shares in one go, it would quickly drive up the price of the stock beyond the price he or she wanted to pay. So instead, over a few weeks or months, the fund’s traders will quietly buy shares in smaller increments until they’ve established the desired $20 million position around the average cost-per-share they were targeting.
And that’s just one fund. If dozens, hundreds, or even thousands of funds are moving in to the same stock, do the math! By the time Apple topped in 2012, it was owned by over 4,300 funds.
That doesn’t happen overnight. It can take many months of continued buying before all these professional investors establish their positions.
That gives you time to get in and ride their coattails.
Good Gains Come to Those Who Wait for Confirmation
The table below shows how it pays to be patient and make sure the number of funds with a position in the stock is rising before you jump in.
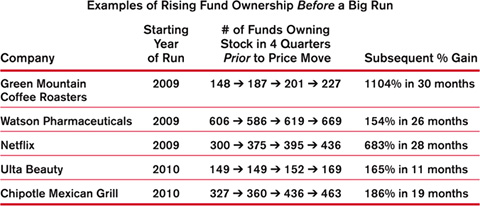
In the table above, look at the four quarters of fund ownership for Watson Pharmaceuticals and Ulta Beauty. In the first two quarters, the number of funds that owned Watson Pharmaceuticals actually dropped, and for Ulta Beauty that number stayed flat. But in the most recent quarter just before both stocks launched their big runs, note how the number of funds jumped significantly higher. That’s the kind of “material increase” you want to see. It shows institutional investors are moving in and picking up shares.
 Accumulation/Distribution Rating of A or B
Here’s another way to see if institutional investors are buying or selling your stock: Check the Accumulation/Distribution Rating (ACC/DIS RTG®).
Accumulation is a fancy word for buying. Distribution refers to selling. The Acc/Dis Rating, which ranges from A (best) to E (worst), tracks institutional trading in a stock over the last 13 weeks (roughly three months). It does that by focusing exclusively on the large-volume trades only professional investors make.
The table below shows what the A to E ratings mean. In general, only buy stocks with an A or B Accumulation/Distribution Rating, and avoid those rated D or E.
The info below for Netflix shows the kinds of gains that are possible when a stock passes the institutional sponsorship criteria and other areas of the Buying Checklist.
Netflix’s Institutional Sponsorship Just Before Rising 683%
March 2009–July 2011
Accumulation/Distribution Rating at time of breakout: A–
Fund ownership in 4 quarters prior to big move: 300 → 375 → 395 → 436
 Relative Strength Rating of 80 or higher
You’re not looking for just good stocks. You’re looking for the best ones— those that are clearly outperforming the rest of the pack. The Relative Strength (RS) Rating is yet one more way to separate the cream from the rest of the crop.
The RS Rating tracks a stock’s share price performance over the last 52 weeks and compares it to that of the S&P 500, which is often used as a bellwether for the general market. To see how that compares to every other stock, a rating from 1 (worst) to 99 (best) is given.
An RS Rating of 80 means the stock’s share price performance is outpacing 80% of all other stocks.
Look for a Strong Relative Strength and EPS Rating
The RS Rating focuses on the strength of the stock as valued by the market (i.e., the “technicals”). The EPS Rating gauges the strength of the company (i.e., the “fundamentals”).
Think of it as the yin and yang of investing: By insisting that your stock has strong ratings for both, you’re looking at the whole picture, not just half of it.
As Bill O’Neil has said, if you look at the stocks that have made enormous runs over the last several decades, “The vast majority of superior stocks will rank 80 or higher on both the EPS and the RS ratings before their major moves.” And 80 is the minimum. The top stocks often rate much higher for both EPS and RS.
85-85: A Profitable Combination
The IBD® 85-85 Index tracks the performance of stocks that score 85 or higher for both the EPS and RS Ratings. These are the stocks included in IBD’s Your Weekly Review.
While hindsight is 20-20, you could say foresight is 85-85: From inception on November 13, 2000, through February 5, 2013, the IBD 85-85 Index rose 275% compared to the S&P 500’s 12% gain. While that does not mean every stock with 85 or higher EPS and RS ratings will make a big run, it does show how this powerful combination of solid earnings growth and relative price strength can lead to substantial profits—and why you want to focus your research on stocks with similar ratings.
 Share price above $15
We’re all human. It can be tempting to chase low-priced stocks, thinking they offer the most potential for a big gain. But they’re usually cheap for a reason: Weak (or nonexistent) earnings growth, lackluster sales, or a lack of new and exciting products. Because of that, they have a hard time attracting institutional investors, and we’ve already seen how important it is to have rising institutional sponsorship.
So the two takeaways here are:
1. Avoid cheap, low-priced stocks.
2. Don’t be afraid to buy seemingly “high-priced” stocks with a share price of $50, $100 or more.
Focus on the CAN SLIM traits, not the “high” share price.
When Priceline started a 182% run in 2010, it was already trading around $270 per share. And Apple may have seemed expensive when its share price hit $150 in July 2009. But less than three years later, it had climbed to $644.
Not all CAN SLIM stocks have triple-digit share prices. SolarWinds launched its 137% move in 2011 from a share price around $25. The prices for these three stocks were different, but their winning profiles were the same: They had the CAN SLIM characteristics.
By definition, CAN SLIM stocks are the fastest-growing, most profitable companies on the market. Just as you can’t buy a Mercedes for the price of a Chevy, CAN SLIM leaders tend to command a higher share price and a higher P/E ratio than inferior stocks (Chapter 2).
So focus on the CAN SLIM traits … don’t chase cheap stocks … and if all the other checklist items are in place, don’t worry if the share price seems high.
 Average daily volume of 400,000 shares or more
“Volume” refers to the amount of shares a stock trades in a given period (e.g., in a day or week). Stocks that have a low average daily volume are said to be “thinly” traded.
You want to avoid thinly traded stocks for the same reason you want to steer clear of low-priced ones: Institutional investors tend to avoid them, so you should too. Plus they tend to be more volatile.
The average daily volume varies widely and can change over time for the same stock. At the time of this writing, Google, for example, is trading around 2.5 million shares on average every day, while Fleetcor Technologies is trading much less, around 670,000.
Mutual fund managers tend to establish large positions, buying tens of thousands or even millions of shares. That’s hard to do in a stock that only-trades 50,000 shares a day. It’s easier to establish a meaningful position— without driving up the price too quickly—in a stock that trades a few million shares on average.
Also, when it comes time to sell, it’s easier for institutional investors to unload their shares in a “liquid” stock—one that has a big pool of buyers and sellers and trades in large volume. It’s much harder for fund managers to quickly get out of thinly traded stocks: Their own high-volume selling can quickly drive down the price, which either reduces their profits or increases their losses.
Keep in mind that while any stock can be subject to a sudden price swing, thinly traded stocks tend to be more volatile. It takes much less volume to significantly impact the price of a stock that trades 50,000 shares a day than one that trades 3 million.
So focus on stocks that trade at least 400,000 shares per day. A more conservative investor trying to reduce the risk of volatility might look for stocks trading 1 million shares or more each day. One place to find such stocks is the IBD Big Cap 20 (Chapter 7).
Funds Will Determine the Fate of Your Stocks
By now you understand that mutual funds and other institutional investors account for the bulk of all trading, and therefore they ultimately determine the fate of a stock. If they’re heavily buying, the stock will go up. If they’re heavily selling, the stock will go down.
It’s the same for the overall market. New uptrends begin when these big investors start buying aggressively and end when they start to sell.
People can talk about all kinds of fancy technical indicators and throw around exotic Wall Street lingo, but that’s the bottom line. And that’s why it’s critical you make sure (a) the market is in an uptrend, and (b) your stock passes this section—and the “Chart Analysis” segment—of the Buying Checklist before you invest.
It’s not that hard to do, and that little extra effort will go a long way to generating superior profits.
Next up: Let’s compare two potential CAN SLIM stocks using the criteria on the Buying Checklist.
• ACTION STEPS •
A Tale of 2 Stocks: Priceline.com vs. Expedia
In July 2009, we were just a few months into a new bull market that began in March. As you were searching for stocks to buy, you might have come across two big players in the online travel booking business, Priceline.com and Expedia.
As we saw in the checklist, you want to pay particular attention to the top-rated stocks in the top-ranked industry groups. In July, the Leisure–Travel Booking group (known as Leisure–Services at the time) was ranked #11.
With that in mind, let’s look at the key facts known about Priceline and Expedia at the time.
As you go through this, consider what you now know about what to look for in a stock before you buy, and ask yourself:
 Which company looks stronger?
 Which stock has a higher likelihood of making a big price gain?
 Which one would you choose to invest your hard-earned money in?
Think about how each company stacks up against the “big rocks” we’ve been discussing.
All data as of July 2009
Does the Company Have Big Earnings Growth?
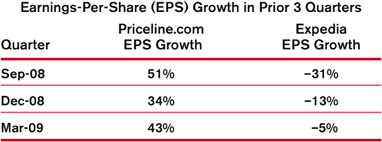
While Expedia has shown negative earnings growth the last 3 quarters, Priceline’s EPS growth has been above the 25% minimum and accelerated in the most recent quarter.

Priceline’s annual earnings growth is over 9 times better than Expedia’s, which gets a failing grade because it’s well below the 25% benchmark.

The highest-possible 99 EPS Rating shows Priceline is outperforming 99% of all stocks in terms of recent quarterly and annual earnings growth. Expedia scores a mediocre 63, which is under the minimum 80 rating we look for in the Buying Checklist.


While Expedia’s SMR Rating of B earns a passing grade, Priceline’s score is even better. That shows Priceline has superior performance in the 3 main ingredients that drive EPS growth: S ales, Profit M argins and R eturn on Equity. And Priceline’s ROE is over 4 times stronger than Expedia’s 10%, which again fails to meet the 17% minimum.
Always keep in mind: Big earnings growth is the #1 factor to look for in a stock. And at this point in time, Priceline’s growth was clearly outpacing that of Expedia.
Does the Company Have a New, Innovative Product or Service?
Priceline’s innovative and exclusive “Name Your Own Price” system had already been in place for years, but was still a major—and unique—draw for consumers. They also had several “new” things driving growth, including kitschy commercials featuring William Shatner.
To increase sales, Priceline had earlier dropped its booking fees. Competitors—including Expedia—didn’t take similar action until 2 years later.
Priceline was also rapidly expanding in a new market—Europe—with its recent acquisition of Booking.com. That marked a new and growing opportunity, since European travelers were still just starting to go online to book their hotels and airfare.
Expedia’s main “new” change was to its service policies and fees—done primarily in reaction to steps Priceline had taken earlier. It hoped to attract more travelers by eliminating cancellation fees for hotels, car rentals, cruises and most airline tickets.
Are Mutual Funds Heavily Buying the Stock?

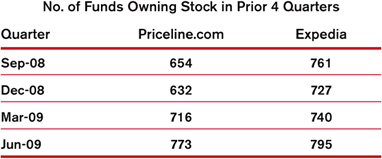
With an Accumulation/Distribution Rating of B and rising fund ownership, Expedia clears the institutional sponsorship criteria in the Buying Checklist. But here again, Priceline’s institutional demand is even stronger: It is actually being more heavily bought by fund managers.
What Is the Stock’s Overall Strength?

Expedia’s 95 Composite Rating was strong, showing it was in the top 5% of all stocks. But you’re looking for the best of the best, the true market leaders. And Priceline’s 99 Composite Rating meant it was in the top 1%.
What About the P/E Ratio?

In Chapter 2, we already discussed why P/E ratios are not an important factor when it comes to deciding what stocks to buy. In fact, investors who only buy stocks with low P/E ratios and never buy ones with so-called “high” P/Es will miss out on virtually every big winner.
So ask yourself: After seeing everything else we just covered about these two companies, would you buy Expedia just because it had a lower P/E ratio?
What Happened Next?
Do you see how it quickly becomes obvious which stock is stronger as you go through the checklist? No guesswork—just the facts. And the more you do it, the quicker and easier it gets.
The difference in the gains that followed proves the payoff for using the Buying Checklist can be life-changing.
Subsequent Gains for Priceline.com and Expedia
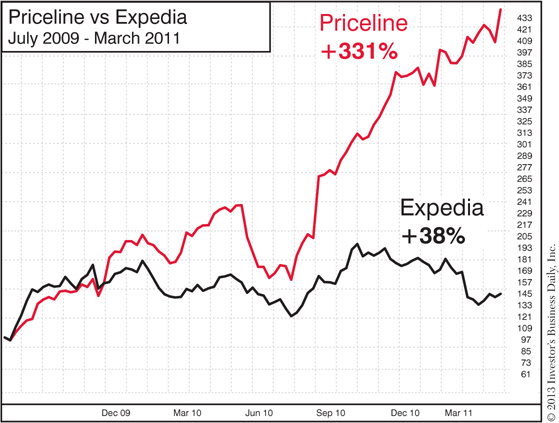
Next up: Now it’s your turn to review 2 stocks and decide which one has more potential.
You Make the Call: Which Stock Looks Stronger?
Now it’s your turn to choose.
Below are the actual earnings, ratings, institutional sponsorship and other vital facts about two companies in the same industry group. Based on what we’ve covered so far, compare the two and ask yourself: Which stock looks stronger?
At the end, I’ll reveal the names of the two companies and what happened next to their stocks.
Does the Company Have Big Earnings Growth?


Does the Company Have a New, Innovative Product or Service?

Are Mutual Funds Heavily Buying the Stock?

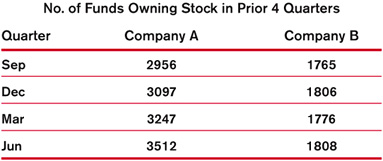
Time to choose: Which company looks stronger, A or B?
Apple vs. Dell July 2009
The checklist results clearly show Apple (Company A) was demonstrating much more strength than Dell (Company B).
The return of founder Steve Jobs in 1997 spurred a phenomenal period of innovation for Apple. The iPod®, iTunes®, iPhone® and the “app” ecosystem were revolutionizing the music and smartphone industries, leading to the explosive earnings growth you saw above.
Dell had been following a different trajectory. While still a major player in the computer industry, Dell’s growth had slowed dramatically compared to the 1990s. Founder Michael Dell’s return as CEO in 2005 failed to rejuvenate the company in the way Jobs’s return had for Apple.
What Happened Next?
Subsequent Gains for Apple and Dell
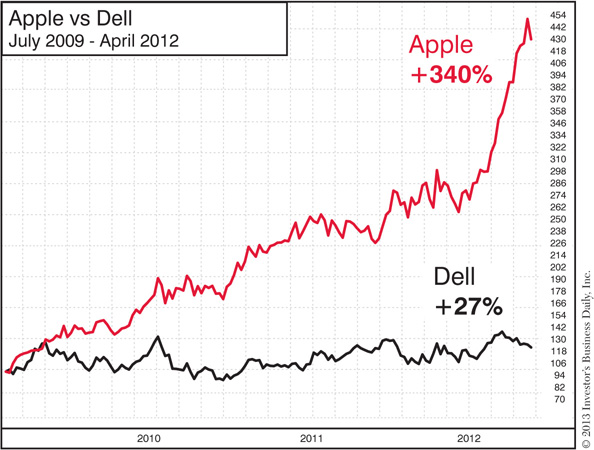
Look at the huge difference in those gains. That’s why you want to put your money into stocks that have CAN SLIM® traits.
When you’re screening stocks, your choices won’t always be that clear-cut. But 100+ years of market history make the most essential point very clear.
To find the best stocks—the ones most likely to make a huge price gain— look for stocks that:
 Have big earnings growth and new, innovative products
 Are top-rated leaders in a top-ranked industry group
 Are being heavily bought by institutional investors
When you focus on stocks that pass the Buying Checklist by displaying those traits—and make sure the overall market is in a solid uptrend—that’s a time-tested recipe for making money in stocks.
Next up: What do you do if your stock gets a mix of pass and fail marks on the Buying Checklist?
What if Your Stock Gets Both Pass and Fail Ratings?
This will certainly happen. Investing, after all, is not an exact science. Few stocks—even those that go on to stellar gains—are picture perfect in every single respect.
So here are tips on how to handle stocks that have a few blemishes.
 If the stock fails in several areas, take a pass and move on.
You’re not looking for mediocre stocks. You’re looking for the market’s strongest leaders. These top stocks may have one, two or maybe three flaws, but they won’t have a lot of serious ones. So if a stock fails on several items on the Buying Checklist, keep your powder dry and keep looking.
As T. Boone Pickens has said, “If you’re going to hunt elephants, don’t get off the trail for a rabbit.”
 Focus on the “big rocks”—the most important factors in deciding what to buy.
 Does the stock have big earnings growth and a new, innovative product or service?
 Are mutual funds heavily buying the stock?
Always put those big rocks in first. A stock may come up short on a checklist item or two, but make sure you can answer a definite “yes” to those two key questions above.
Let’s look at a few “mixed bag” scenarios you’re likely to encounter.
Scenario 1: Strong Stock but Relatively Weak Industry Group
If you find a stock that passes everything on the checklist, except its industry group is not ranked in the top 40–50 groups, should you toss it by the wayside? Not necessarily.
Yes, you want to focus on the top-rated stocks within the top-ranked industry groups. But there are times when a big winner will emerge from a somewhat lower-ranked group.
One example is Ulta Beauty. As we saw in the case study for Ulta (see Chapter 2), it had explosive earnings growth; it had a popular new retail concept that was revolutionizing how cosmetics were sold; and mutual funds were heavily buying its stock.
But when it launched its 165% run, Ulta Beauty’s Retail–Specialty industry group was only ranked #82.
The group ranking is important because a higher ranking means funds and other institutional investors are moving into that industry. So if you do invest in a stock that is not in a top 40–50 group, make sure the stock gets flying colors for the other checklist items. You also need to make sure mutual funds are heavily buying the stock to at least partially make up for the lower group ranking. That was the case for Ulta: In the 4 quarters before its big move, the number of funds that owned shares jumped from 197 to 315.
Also, if the group ranking is sub-par, make sure there is at least one other top-rated stock in the group. That confirms institutions are showing some interest in the industry. You had that for Ulta Beauty: Fellow retailer Sally Beauty Holdings sported a solid 95 Composite Rating and launched a big run around the same time as Ulta.
Scenario 2: Drop in Fund Ownership in Most Recent Quarter but Strong Accumulation/Distribution Rating
Let’s say you were running Lululemon Athletica through this checklist in September 2010.
Did it have big earnings growth? Yes, its EPS growth in the prior 3 quarters accelerated from 43% to 100% to 180%. It also had a very strong 30% return on equity.
Did it have a new, innovative product or service? Yes, again. It had found a profitable niche with high-end yoga apparel as the popularity of yoga was rising.
Were mutual funds heavily buying the stock? Yes, but with some caveats.
In the first quarter of 2010, the number of funds that owned Lululemon jumped from 189 to 223. But in Q2, it dropped to 206. As we saw in the “Big Rock #3” section of the checklist, you’d prefer to see that number rise in the most recent quarter.
But there were mitigating factors that made up for that flaw. One was that even with that drop, the number of funds that owned shares was up over the last 4 quarters, from 195 to 206.
Also, when Lululemon launched its big move, it had an Accumulation/Distribution Rating of B+, indicating moderate to heavy buying by institutional investors over the last 13 weeks. And just a few days before it launched its big move, it released its latest earnings report and professional investors poured in, driving a spike in trading volume that was over 600% higher than normal.
So while Lululemon did have a flaw or two, it was strong overall, and it had the three most important elements we look for: Big earnings; a new, innovative product or service; and mutual funds were heavily buying shares.
From that point, it shot up 196% in just 10 months. (By the way, over the next 4 quarters, the number of funds that owned Lululemon jumped from 205 to 359.)
Scenario 3: Strong but Not Accelerating Earnings Growth
In September 2010, Chipotle Mexican Grill was a CAN SLIM® leader, but it had a flaw: Its EPS growth had decelerated over the last 3 quarters, from 90% to 53% to 33%. Obviously, you’d prefer to see that going in the opposite direction.
But again, when you ask the most important questions, Chipotle got a “yes” in response to each one.
Did it have a new, innovative product or service? Chipotle’s chain of organic gourmet burrito restaurants was extremely popular and well-positioned to serve the growing number of people who wanted a healthier alternative to typical fast food fare.
Were mutual funds heavily buying the stock? Yes. Just before it broke out, Chipotle had a solid Accumulation/Distribution Rating of B, and the number of funds that owned shares had risen sharply over the last 4 quarters.
Did it have big earnings growth? Since Chipotle’s EPS growth had decelerated in recent quarters, were there any mitigating factors that could garner a positive answer to this key question?
One was that, while deceleration is certainly not ideal, Chipotle’s earnings growth was still above the 25% minimum we look for.
Also, its annual earnings growth over the last 3 years was 38%—well above the 25% minimum benchmark.
Chipotle’s EPS Rating was 97, meaning in terms of overall current and annual earnings growth, it was outpacing 97% of all stocks. Plus, it had a solid return on equity of 19% and the highest possible Composite Rating of 99, meaning it was in the top 1% of all stocks in terms of overall strength— including current and annual earnings growth.
So while not picture perfect, Chipotle—like Lululemon—showed market-leading power, and it went on to gain 186% over the next 20 months.
Don’t Let the “Perfect” Become the Enemy of the “Very Good”
If you come across a stock that gets a passing grade for almost all the items on this checklist but misses on one or two, don’t automatically write it off. Look at the big picture, and see if it has the most critical things to look for: Big earnings growth, a hot new product or service, and clear demand from fund managers.
What if Your Stock Doesn’t Pass?
Check the Group Leaders in IBD Stock Checkup
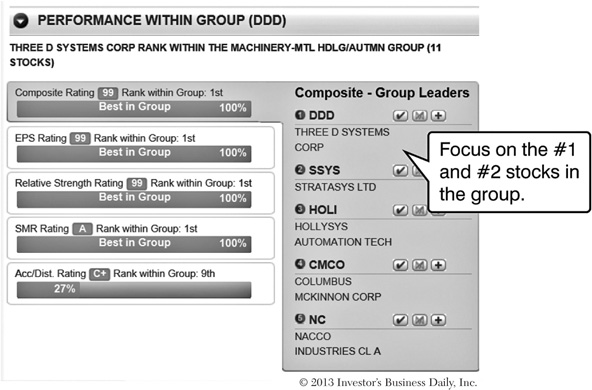
If the company you’re looking at doesn’t pass the checklist, try this: Check the top-rated stocks in the same industry group, found at the top of Stock Checkup (see the example above).
Focus primarily on the #1 and #2 stocks, and run them through the same checklist. It’s a great way to discover the true industry leaders and build a quality watch list.
Be Cautious—but on the Hunt— During Earnings Season
Four times a year, publicly traded companies report their earnings and sales figures for the prior quarter. The latest numbers can pleasantly surprise—or bitterly disappoint—professional analysts and investors. That’s why you often see dramatic swings—up or down—when a company reports.
So during earnings season, you often see a lot of breakouts, but you may also see several breakdowns.
Because you don’t know which way that pendulum will swing, don’t buy a stock just before it releases its latest earnings report.
Instead, wait for the stock to announce the numbers, and see how the market reacts. If the stock shoots past a proper buy point on heavy volume, that could offer a chance to get in. If it sells off on massive volume, you’ll be glad you didn’t try to “guess” and jump in early.
Here are 3 simple tips on how to handle earnings season:
 Check to see when any stock you own or have on your watch list is scheduled to report. You can find that information on the company’s website or through other services. During earnings season, IBD publishes the Earnings Calendar, a list of key stocks scheduled to report the following week. You’ll find that in the Monday edition.
 Have your buying and selling game plans in place ahead of time. If you’re considering buying a stock that could potentially break out of a base when it reports earnings, know the exact buy point you’re looking for and how many shares you’ll purchase. If you own a stock that’s about to report, be sure to have a defensive selling plan in place, just in case it suddenly sells off.
 Consider using automatic trade triggers. If you can’t watch the market during the day, set a trade trigger with your broker ahead of time (see Chapter 4). You can set a conditional buy order for a stock on your watch list to make sure you catch it if it breaks out while you’re away from your computer. And you can set a stop-loss order to help protect your profits or cap any losses if a stock you already own declines.
Expect the Unexpected
Earnings season can sometimes leave you scratching your head. A stock may soar higher on a seemingly weak quarterly report, while another may sell off despite posting stellar numbers. Again, that’s why your best bet is to wait for the company to report and see how the market reacts.
Below are examples of two very different reactions to two seemingly positive earnings announcements. They’re good reminders of how you can keep the odds of success in your favor by keeping your powder dry until you see how the company’s earnings story plays out.
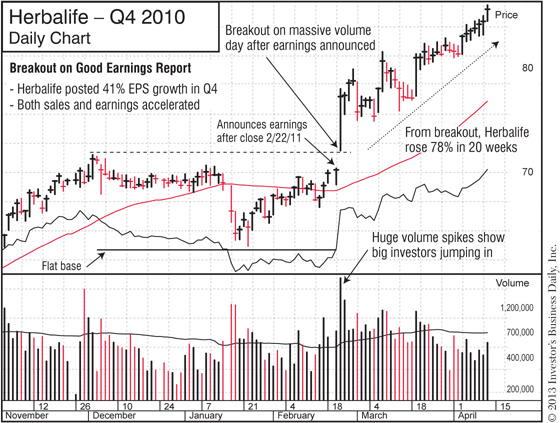
Herbalife soared 78% in 20 weeks after reporting accelerating earnings growth.
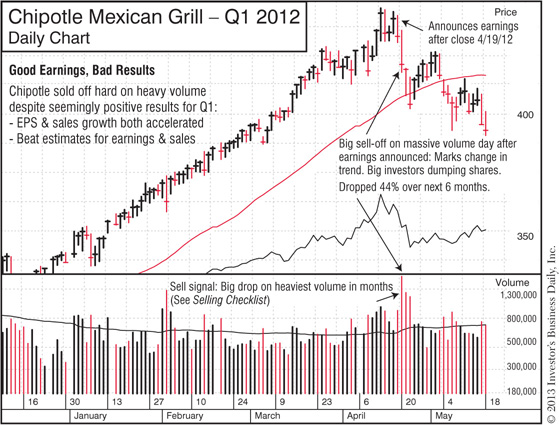
Despite posting accelerating earnings and sales growth, Chipotle sold off.
 Market in confirmed uptrend
 Composite Rating of 90 or higher
 EPS Rating of 80 or higher
 EPS growth 25% or higher in recent quarters
 Accelerating earnings growth
 Average Annual EPS growth 25% or more over last 3 years
 Sales growth 25% or higher in most recent quarter
 Return on equity (ROE) of 17% or higher
 SMR® Rating (Sales + Margins + Return on Equity) of A or B
 New products, service, or management
 Among the top-rated stocks in its industry group
 Ranked in top 40–50 of IBD’s 197 industry groups
 Increase in number of funds that own the stock in recent quarters
 Accumulation/Distribution Rating of A or B
 Relative Strength Rating of 80 or higher
 Share price above $15
 Average daily volume of 400,000 shares or more
 Chart Analysis: Buy stocks as they break out of the common patterns that launch big moves.
 Breaking out of sound base or alternative buy point
 Volume at least 40% to 50% above average on breakout
 Relative strength line in new high ground
 Watch a short video on how to quickly run your stock ideas through the Buying Checklist at
  If you’re near a computer, I suggest you pull up Stock Checkup as we go through each item on the checklist. It’ll help you get used to the process even quicker. See how at
  If you buy during a market uptrend, you have a 75% chance of being right.
 Market in confirmed uptrend


 Does the stock have big earnings growth and a new, innovative product or service?

