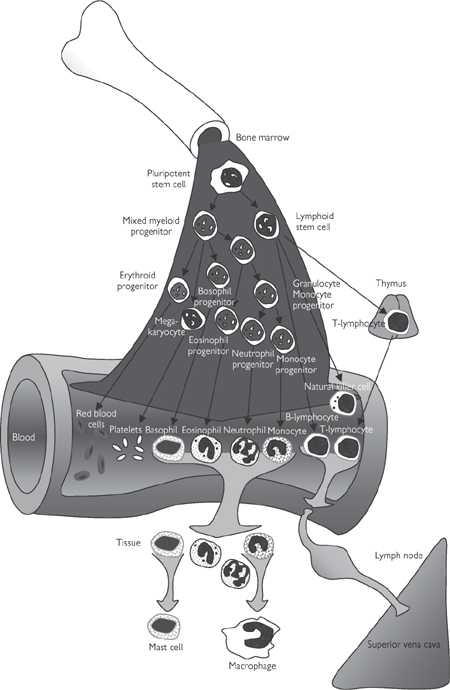
Fig. 6.23 The origin of blood cells.
Monocytes are derived directly from myeloid cells and pass into the bloodstream, where they circulate in a quiescent form for up to 2 days before they migrate into the tissue and differentiate into mature phagocytic macrophages. Macrophages are the scavengers of the immune system and are particularly prevalent in the liver (where they are sometimes called Kupffer cells) and the lungs. However, they accumulate in specific sites of infection to help kill invading pathogens and to clear cellular debris from the site.
These granulocytes have a very distinctive nuclear arrangement consisting of densely packed chromosomal material in two to five distinct lobes. Like monocytes, mature neutrophils also differentiate from myeloid progenitor cells via granulocyte stem cells. The cytoplasm of neutrophils is packed with granules of different types:
• Primary granules contain a range of enzymes (e.g. myeloperoxidase) that generate highly toxic, oxygen-related species, including superoxide and hydrogen peroxide
• Secondary granules contain enzymes (e.g. lysozyme, collagenase) that act to lyse cells and digest their contents, or deprive them of essential iron (lactoferrin).
The primary function of neutrophils is the identification, phagocytosis, and killing of invading pathogens. Mature neutrophils only circulate for about 10h before they undergo programmed cell death and are cleared by macrophages.
Eosinophils are very similar in structure, function, and origin to neutrophils. The distinguishing feature of eosinophils is their 2–3-lobed dense nucleus. They are often associated with allergic reactions and defence against parasites.
Basophils are rarely found in peripheral blood and when they enter tissues, they become mast cells that are involved in the recruitment of other inflammatory cells to sites of infection or damage. These cells are packed with histamine and heparin-containing granules that can obscure the nucleus.
Platelets are very small (1–2μm diameter), discoid, subcellular fragments that do not contain nuclei but have most of the other features associated with cells, including mitochondria, endoplasmic reticulum, and a crude microfilament and actin-based cytoskeleton. Platelets are derived from megakaryocytes in the bone marrow in response to thrombopoietin synthesized in the kidneys and liver. Their generation is auto-regulated on account of clearance of circulating thrombopoietin by platelets.
The function of platelets is to stop blood loss after injury by forming a plug in damaged blood vessels and releasing agents (e.g. thrombin) that contribute to rapid clot formation. They also release signals to recruit and activate further platelets (e.g. ADP, thromboxane A2, 5-HT) and to attract inflammatory cells (e.g. platelet-derived growth factor; PDGF) to the site of injury in order to ward off any potential infection. This process of haemostasis is covered in detail on p.464.
The heart is a four-chambered, muscular pump responsible for perfusing the vascular network with blood. The left and right sides of the heart effectively operate as two pumps, respectively, sending blood through the systemic and pulmonary circulations that are arranged in series.
• The outline of the heart, which is roughly conical in shape, can be consistently defined on the surface of the chest according to the following guidelines:
• The superior border of the heart is defined as a line following the 2nd intercostal space approximately 4cm either side of the sternum
• The right border runs from the 3rd right costal cartilage to the 6th right costal cartilage
• The apex of the heart is located in the 5th intercostal space in the mid-clavicular line. Its inferior border runs from this point to the right border
• The left border of the heart connects the apex to the superior border
• These relationships are of importance to clinicians during auscultation and palpation ( OHCM8 pp.36–45)
• The heart is located in the middle mediastinum within the pericardium: a double-layered sac which completely surrounds the heart apart from the points where the great vessels enter and leave
• The external pericardial layer is referred to as fibrous pericardium: a structure which prevents excessive distension of the heart
• On its internal face, the heart is lined by a parietal layer of serous pericardium. This is continuous with the visceral layer of serous pericardium (epicardium) forming a potential space (pericardial cavity), which contains a thin layer of fluid permitting the heart to move within the pericardial sac
• Pericardial sinuses are formed by the reflection of the pericardium around the heart. These sinuses are small, blind-ending spaces between the heart and the great vessels (oblique sinus) and around the aorta and pulmonary trunk posterior to the heart (transverse sinus)
• The heart is fist-sized and lies obliquely within the thorax such that its anterior surface is formed largely of the right atrium and the right ventricle, while the left atrium and the left ventricle are orientated posteriorly
• The wall of the heart is made up of three layers: the epicardium is the most superficial of these and is lined by the muscular myocardium, which in turn is separated from the chambers by a layer of endocardium (monolayer of endothilial cells)
• The fibrous skeleton of the heart is formed by a cartilaginous ring at the level of the membranous ventricular septum, separating the atria from the ventricles. It contains the atrioventricular, aortic, and pulmonary orifices. It provides electroinsulation, so that electrical impulses cannot pass directly from the atria to the ventricles except via the atrioventricular node. This fibrous skeleton also supports the cardiac valves at the base of the cusps, preventing stretching and incompetence of the valves.
• The systemic circulation drains into the right atrium via the superior and inferior venae cavae, while the cardiac veins enter the right atrium via the coronary sinus
• The right atrium is separated from the left atrium by the interatrial septum within which can be found the fossa ovalis—a vestige of the foramen ovale which permits the shunting of blood from the right to the left atrium in the fetus
• Right atrial contraction forces blood into the right ventricle through the right atrioventricular orifice. This structure is bounded by the right atrioventricular (tricuspid) valve which prevents any back-flux of blood during ventricular contraction. The papillary muscles which arise from the ventricular wall are attached to the loose edges of the cusps of the right atrioventricular valve (usually one per cusp) via chordae tendinae which maintain the direction of the cusps. The three cusps of this valve are attached to a fibrous ring surrounding the atrioventricular orifice
• Right ventricular contraction forces blood into the pulmonary trunk via the infundibulum. The interventricular septum separates the right and left ventricles and bulges into the right ventricle because of higher pressure in the left ventricle. Back-flux of blood from the pulmonary circulation into the right ventricle is prevented by the presence of the pulmonary valve; this comprises three semi-lunar cusps. Stenosis of the pulmonary valve, frequently occurring alongside infundibular pulmonary stenosis, narrows the outflow from the right ventricle and causes right ventricular hypertrophy
• The left atrium receives the four pulmonary veins (two inferior and two superior). Its wall is slightly thicker than that of the right atrium owing to the higher pressures within the systemic circulation. The fossa ovalis is a visible part of the interatrial septum. Blood is expelled from the left atrium past the mitral valve, via the atrioventricular orifice, to the left ventricle. The mitral valve is analogous in structure and function to the tricuspid valve, although it comprises only two cusps and its papillary muscles are larger than their counterparts in the right side of the heart
• The wall of the left ventricle is approximately twice as thick as the right ventricle. It pumps blood into the aorta via the aortic orifice. The three semi-lunar cusps of the aortic valve guard this opening
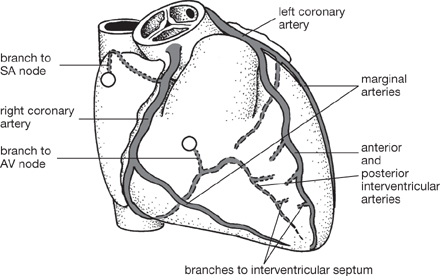
• Aortic sinuses are formed behind the cusp of each valve as a bulge in the aortic wall. The posterior sinus supplies the origin of the left coronary artery, and the anterior cusp provides the origin of the right coronary artery, which supplies the heart.
• The coronary circulation must provide the myocardium with sufficient blood to meet its high basal oxygen consumption, and have the capacity to increase during exercise
• The high pressure that develops in the ventricular wall during systole transiently shuts off the coronary circulation. This effect means that 80% of coronary blood flow occurs during diastole. In order to cope with these challenges, myocardium contains a density of capillaries, increasing the efficiency with which nutrients and waste products can be exchanged. Furthermore, the total oxygen extraction from the coronary circulation is high
• The branches of the coronary arteries are particularly sensitive to obstruction (e.g. during atherosclerosis OHCM8 pp.110–11), since anastomoses are infrequent and inefficient (functional end arteries). Such events underlie myocardial infarction and angina. Sites of obstruction can be localized by coronary angiography ( OHCM8 pp.104–5).
OHCM8 p.105)• The right and left coronary arteries arise from the aorta just distal to the aortic valve at the coronary sinus. These vessels supply the myocardium and the epicardium
• The right coronary artery passes from the anterior aortic sinus anteriorly, past the pulmonary trunk in the right atrioventricular groove, in which it passes under the inferior border of the heart; ultimately it anastomoses with the circumflex branch of the left coronary artery at the posterior interventricular groove. A branch of the right coronary artery (the posterior interventricular artery) runs in the inferior interventricular groove and anastomoses with the anterior interventricular artery near the apex of the heart, which arises from the left coronary artery. The right posterior interventricular artery supplies the AVN in 90% of people, while in the remaining 10%, the AVN is supplied by a branch of the left coronary artery. Clearly, this is of significance following myocardial ischaemia. A marginal branch also arises from the right coronary artery and passes along the inferior border of the heart
• The left coronary artery passes from the posterior aortic sinus and runs in the left atrioventricular groove to anastomose with the right coronary artery. It gives off several key branches analogous to those from the right coronary artery—the anterior interventricular artery (which runs in the anterior interventricular groove) and the circumflex artery (which anastomoses with the right coronary artery). The left marginal artery follows the left margin of the heart
• In general, the right and left ventricles are supplied by the right and left coronary arteries, respectively, while the atria and interventricular septum can be supplied by both. There can be considerable variations from this scheme, however.
Fig. 6.24 The arterial supply of the heart.
Reproduced from Mackinnon, Pamela and Morris, John, Oxford Textbook of Functional Anatomy, vol 2, p75 (Oxford, 2005). With permission of OUP.
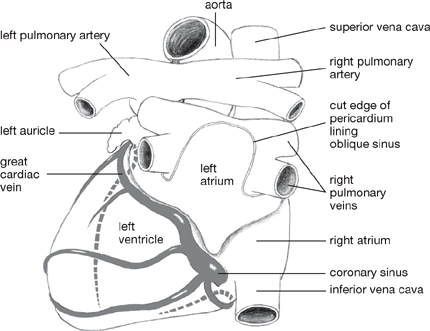
• The majority of the venous drainage of the heart empties into the coronary sinus, although a certain amount passes directly into the right atrium (largely from anterior cardiac veins which drain the anterior aspect of the heart)
• The coronary sinus runs in the posterior atrioventricular groove and receives:
• The great cardiac vein (from the anterior interventricular groove) at its left end
• The middle cardiac vein (from the inferior interventricular groove)
• The small cardiac vein (from the lower border of the heart) at its right end.
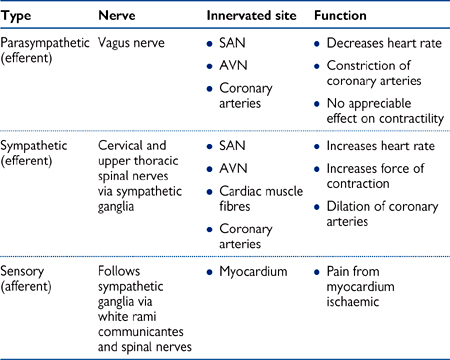
• The heart receives innervation from parasympathetic, sympathetic, and sensory fibres, which together form the superficial and deep cardiac plexuses below the aortic arch
• Sensory fibres innervating the heart run in close proximity to cervical and thoracic spinal nerves. This explains the phenomenon of referred cardiac pain to the chest, arms, and neck during myocardial ischaemia ( OHCM8 pp.88–9).
Fig. 6.25 The venous drainage of the heart.
Reproduced from Mackinnon, Pamela and Morris, John, Oxford Textbook of Functional Anatomy, vol 2, p76 (Oxford, 2005). With permission of OUP.
Table 6.3 Nerve supply to the heart
• Membrane depolarization is the stimulus for contraction of cardiac myocytes to occur, and the coordinated and regulated spread of electrical excitation from the atria to the ventricles is essential for efficient pumping activity
• The cells of the heart are arranged as a branching syncytium in which depolarization passes from one cell to the next via gap junctions. Dome cardiac muscle cells contain few myofibrils and are specialized conducting fibres that allow a wave of depolarization to spread throughout the heart in a rapid, coordinated manner
• Unlike skeletal muscle, electrical impulses within the heart are generated intrinsically and are not dependent on external nervous input, although cardiac function can be modulated by the activity of the autonomic nervous system
• The SAN—an area of specialized cardiac tissue on the posterior wall of the right atrium—is the normal pacemaker region that initiates electrical excitation
• The SAN exhibits the highest frequency of spontaneous activity and overrides other potential pacemaker regions (ectopic pacemakers)
• SAN cells contain few myofibrils and are not specialized for contraction. Instead, they spontaneously depolarize in a rhythmic manner, triggering action potentials which are conducted to the surrounding atrial tissue
• Following an action potential, the resting membrane potential of a SAN cell is –55 to –60mV. A slow inward leak of Na+ ions (If, ‘funny’ current) then depolarizes SAN cells until an action potential is fired at about –40mV. The upstroke of the action potential in an SA node cell is a result of the influx of Ca2+ ions through voltage-gated Ca2+ channels
• The atria are almost completely electrically insulated from the ventricles by the annulus fibrosus and electrical impulses can only pass between them via the AVN
• The AVN is a specialized area of conducting tissue within the atrial septum that slows the conduction of the electrical impulse, allowing the atria to contract before the ventricles
• Electrical impulses arrive at the AVN via conducting pathways from the SAN. From here, the bundle of His transmits depolarization across the annulus fibrosus and along the interventricular septum. The bundle of His divides into anterior and posterior, left and right bundle branches that pass down the left or right side of the interventricular septum and transmit impulses initially to the endocardial regions of the left and right ventricles, respectively
• Fibres from the left and right bundle branches transmit impulses to Purkinje fibres, comprising large-diameter cells that conduct electrical impulses very rapidly. From the endocardium, contractile cells transmit impulses to each other. This network of rapid conducting fibres therefore allows all parts of the ventricles to contract virtually simultaneously
• The function of the pacemaker and conducting system of the heart can be modulated by autonomic nervous system activity
• Sympathetic nerve activity to the SAN increases heart rate (positive chronotropic effect; tachycardia). This is mediated by catecholamines binding to β1 adrenoceptors, leading to an increase in intracellular cAMP
 The open-state probability of channels that conduct the funny current increases, thereby increasing the magnitude of this current and decreasing the time taken for depolarization to occur.
The time taken for conduction through the AVN is reduced
• Parasympathetic (vagal) nervous activity slows heart rate (negative chronotropic effect; bradycardia). This is mediated by acetylcholine binding to muscarinic (M2) receptors
The rate of depolarization of SAN cells is reduced, an effect mediated by reduced cAMP
Activation of K+-channels hyperpolarizes the pacemaker cells, increasing the time required to reach threshold for an action potential.
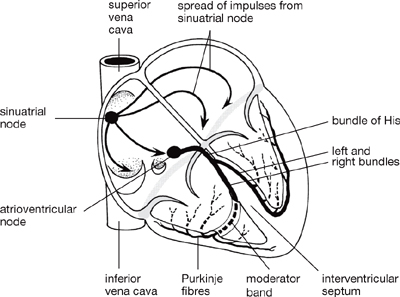
Fig. 6.26 The conducting system of the heart. The fibrous skeleton of the heart separates the muscle of the atria from that of the ventricles, which are connected only by the bundles of His.
Reproduced from Mackinnon, Pamela and Morris, John, Oxford Textbook of Functional Anatomy, vol 2, p77 (Oxford, 2005). With permission of OUP.
• The ECG ( OHCM8 pp.90–103) is a record of the electrical events associated with depolarization and repolarization of the myocardium, measured as changes in the surface potential of the skin
• During the cardiac cycle, as the atria and then the ventricles undergo sequential depolarization followed by repolarization, the extracellular myocardial compartment can be treated as two moving dipoles of opposite charge
• Each dipole is essentially an aggregation of the depolarized (negative) and hyperpolarized (positive) regions of the heart. Charge flows between these two dipoles, and it is the potential arising from these minute currents that can be picked up as small (up to 1 mV) potential differences at the skin
• Normally, only potentials arising from myocardial depolarization and repolarization can be recorded: the conducting system is too small to produce potential changes of sufficiently large magnitude to be measurable by ECG
• The ECG is routinely used clinically and allows abnormalities in the electrical activity of the myocardium to be detected and diagnosed. It should be remembered that the ECG is a record of electrical, and not contractile, events.
The nature of the ECG trace varies according to the ‘limb leads’ used to record it ( see next section), although certain features are invariant in healthy subjects (Fig. 6.27):
• The P wave is the first event of the cardiac cycle observable by ECG. It arises from depolarization of the atria and lasts approximately 0.08s
• The PR interval is the period from the start of the P wave to the start of the QRS complex (it should more logically be known as the PQ interval). A large proportion of the PR interval is flat (after the P wave) and this represents the time taken for conduction through the AVN—the heart is essentially isoelectric during this period. The PR interval lasts approximately 0.2s
• The QRS complex is a record of ventricular depolarization and, as such, is analogous to the P wave for the atria. It lasts for only a short time, approximately 0.1s, demonstrating the almost synchronous depolarization of the ventricular myocardium
• The ST segment corresponds to the plateau phase of the ventricular action potential and, like the major part of the PR interval, represents the heart in an isoelectric state
• The T wave is a record of ventricular repolarization. It is normally in the same orientation as the QRS complex (large upward deflection), since repolarization occurs in the opposite direction to depolarization.
• The ECG is traditionally recorded using three electrodes: one on each arm and one on the left leg. Together, these three points make up Einthoven’s triangle
• An ECG trace is generated by resolving the electrical vector arising from the electrical dipole onto one of the three leads connecting the above three electrodes
• During the cardiac cycle, this electrical dipole changes in magnitude and direction and, therefore, its resolution onto each of the three leads is continually changing
• Each of the three leads is in a different orientation and emphasizes different features of the ECG:
• Lead I: right arm (–) to left arm (+)—horizontal
• Lead II: right arm (–) to left leg (+)—60° below horizontal
• Lead III: left arm (–) to left leg (+)—120° below horizontal
• The standard leads are therefore designed such that a positive deflection results when a positive dipole points towards the left arm (lead I) or the left leg (lead II or III).
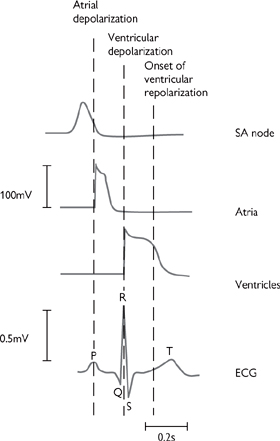
Fig. 6.27 The relationship between the onset and duration of the action potentials of cardiac cells during a single cardiac cycle and the ECG trace.
Reproduced with permission from Pocock G, Richards CD (2006). Human Physiology: The Basis of Medicine, 3rd edn, p271. Oxford: Oxford University Press.
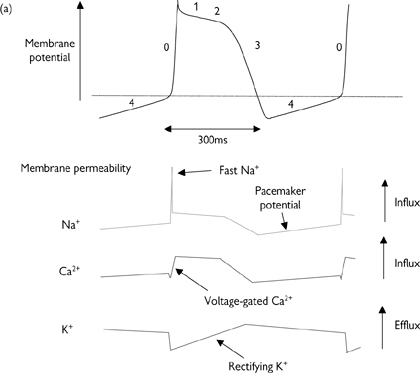
There are a number of features that make the action potentials of the heart different from those seen in other excitable tissue. Most importantly, there are special pacemaker cells (found primarily in the SAN) that spontaneously generate action potentials in a cyclical fashion, thanks to their unusually high Na+ permeability. The key events in the cardiac action potential are summarised in Fig 6.28 and described on p.256.
The pacemaker potential is transmitted to surrounding cells in the atrium because the cells are electrically coupled. These cells do not usually have pacemaker activity and action potentials are only triggered by depolarization of adjacent cells.
Depolarization of atrial cells is of shorter duration (200ms) than that in Purkinje fibres and ventricles, where Ca2+ channel activation is prolonged, leading to a longer plateau phase and action potentials that last for 300–400ms (Fig. 6.28).
The refractory period is the time taken between action potentials for the cell to prepare itself for another depolarization (e.g. reactivation of Na+ channels that are inactivated during depolarization). During the refractory period, cells cannot be activated, even if a stimulus arrives—a crucial factor in ensuring that the action potential is propagated in one direction only and cannot double-back on itself to create chaotic contractile patterns.
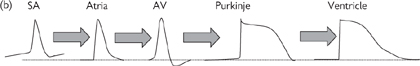
Fig. 6.28 (a) Cardiac action potential and membrane permeability; (b) change in action potential response profile across cardiac tissue—longer depolarizations correspond to protracted Ca2+ channel opening.
OHCM8 pp.118–25, 816–9)Maintenance of a consistent rhythm is central to efficient cardiac function. The electrical conductance system described is cleverly designed to only allow electrical waves to travel in one direction and to prevent their arriving too close together, making for inefficient contraction of cardiac muscle. However, an injury to the heart muscle (caused, for example, by a heart attack results in the death of a discrete area of the muscle, as defined by the location of the thrombus of the coronary artery that led to the heart attack. The infarcted area is dominated by scar tissue, which alters the electrical conduction properties of that region. The site of the infarct has serious implications for the efficient transmission of the electrical activity across the heart and can lead to potentially fatal changes in heart rhythm—so-called arrhythmias.
• Abnormal pacemaker activity: the heart rate is normally determined by the pacemaker cells in the SAN, but other cells in the heart can undertake pacemaker activity during or after ischaemic damage. The cellular mechanisms have not been fully elucidated but may involve a decrease in Na+/K+–ATPase pump activity, leading to membrane depolarization, and pain-mediated adrenaline release might play a part during a heart attack
• Heart block: if an infarct encompasses the AVN, the wave of activity may not be properly transmitted from the atria to the ventricles. The atria will continue to beat at the rate set by the SAN; the ventricles will beat independently, at a rate set by ventricular pacemaker cells. Sequential contraction of the atria, followed by the ventricles, is crucial for efficient pumping of blood and ‘heart block’ is best treated by implantation of an artificial pacemaker ( OHCM8 pp.126–7)
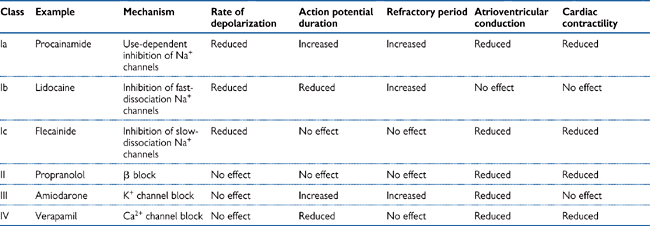
• Re-entry: the refractory nature of cardiac muscle immediately after depolarization normally ensures that the impulse wave only travels in one direction. Re-entry applies to a ‘ring’ of cardiac tissue, which can be anatomically distinct from the surrounding tissue, but is more commonly only functionally distinct. The concept dictates that an impulse arising from any point in the ring will propagate in both directions, until the waves of depolarization meet and both impulses are cancelled out (Fig. 6.29). However, if part of the ring is damaged, such that the impulse is not transmitted in the normal (anterograde) direction but can still be conducted in the retrograde direction, the impulse can cycle around the ring continuously, if the time taken for each cycle exceeds the refractory period. Although the re-entrant circuit may only occupy a small area of cardiac tissue, its effects are transmitted to the surrounding cardiac muscle and the impact on heart rhythm can be dramatic. Drugs that are useful in treating re-entry prolong the refractory period (see Table 6.4)
• Delayed after-depolarization: normally myocardial cells do not contract when they are stimulated by the wave of activity that originates in the SAN. In between times, the cells are first refractory and then quiescent, until the arrival of the next wave of depolarization. However, if intracellular Ca2+ levels increase excessively during depolarization, an after-depolarization can result from a net influx of Na+ ions in exchange for the Ca2+ (in the ratio 3 Na+ in: 1 Ca2+ out) and the opening of Ca2+-sensitive non-selective cation channels. If the heart rate is slow, the after-depolarization may not be sufficient to elicit an action potential, and it gradually subsides. However, as the heart rate increases, the after-depolarization increases until it is sufficiently high to elicit an action potential: the effect is self-perpetuating, leading to an indefinite chain of action potentials in quick succession (tachycardia).
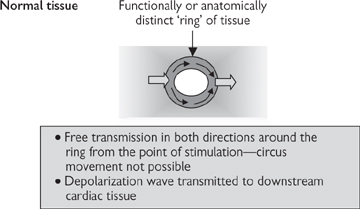
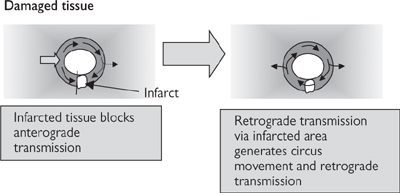
Fig. 6.29 Circus movement caused by re-entry in cardiac tissue.
Bradycardia ( OHCM8 pp.118–9) is an unusually slow heart rate that can be brought on by sinus dysfunction (sick sinus syndrome) or hypothyroidism and exacerbated by heart-slowing drugs (β-blockers and cardiac glycosides). Severe cases can lead to cardiac arrest, atrial fibrillation, or thromboembolism. Mild cases can be effectively treated with the muscarinic ACh receptor antagonist, atropine, which prevents the slowing effect of parasympathetic (vagal) stimulation of the heart. More serious cases may require temporary or permanent implantation of pacemaker devices ( OHCM8 pp.126–7).
Atrial fibrillation (AF) ( OHCM8 p.124) is defined as irregular and extremely rapid (300–600/min) contractions of the atria. The AVN is only intermittently activated by this chaotic activity, giving rise to irregular ventricular function. The cause is often myocardial infarction, but heart failure, hypertension, bronchitis, and hyperthyroidism can also result in AF. The main risk is thromboembolism ( OHCM8 p.474), which is prevented by the anticoagulant, warfarin ( OHCM8 p.344). The key to treatment of AF is to deal with the underlying cause, if possible, and to use drugs to slow the atrial contractions (digoxin, β-blockers, verapamil, amiodarone). If patients fail to respond to drug treatment or in emergency, cardioversion (electrical shock treatment; OHCM8 p.784) might help to restore normal rhythm (Box 6.8).
Table 6.4 Vaughan Williams’ classification of anti-arrhythmic drugs
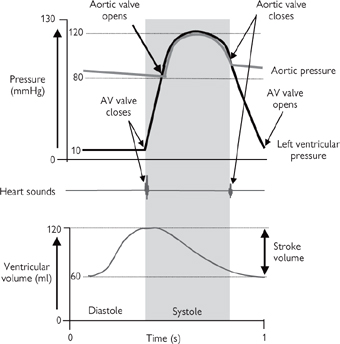
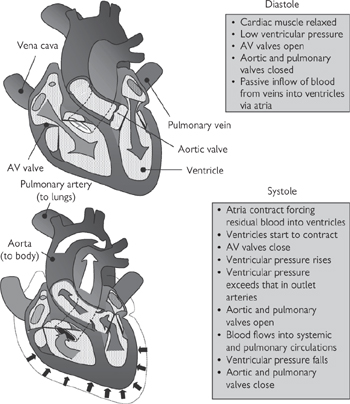
The role of the heart is to supply sufficient blood to the tissues to satisfy their O2 and nutrient requirements and to remove waste products, including urea and CO2. This role is fulfilled due to the synchronized contraction of the cardiac myocytes that constitute the walls of the heart chambers in response to the wave of electrical activity that is conducted by the myocytes themselves. Below (and in Figs 6.30, 6.31) is a summary of the mechanical events that contribute to the cardiac cycle; we join the cycle during the relaxation phase (diastole), just before the next wave of excitation is initiated in the SA node. Under resting conditions in humans, the whole cycle is complete in ~1s:
1 The atria and ventricles are relaxed and the pressure in the heart chambers is low. Blood from the large systemic veins (superior and inferior vena cava) and that returning from the lungs (pulmonary vein) flows into the right and left atria respectively. The atrioventricular (AV) valves are open at this stage of the cycle, so the majority of blood passes passively from the atria to the ventricles
2 The wave of depolarization emitted from the SAN in the right atrium sweeps across the atria and causes the cardiac myocytes in their walls to contract, forcing most of the remaining blood from the atria into the ventricles via the open AV valves. The volume of the ventricles increases as they fill (to a maximum of about 130mL under resting conditions)
3 The conduction wave has now passed through the AVN and been conducted, via the fast Purkinje fibres in the bundle of His, to the apex of the ventricles, whereupon it sweeps across the ventricles from bottom to top, initiating ventricular contraction (systolic phase)
4 As soon as ventricular contraction starts, the AV valves snap shut, trapping the blood in the ventricles and causing ventricular pressure to rise without any significant change in ventricular volume
5 Pressure in the ventricles continues to rise until it exceeds that in the outflow arteries (pulmonary artery and the aorta; ~80mmHg). Now the valves at the openings to these arteries are forced open by the pressure, and blood flows down its pressure gradient into the arteries. Ventricular volume falls as the blood is forced out. Ultimately, the pressure in the ventricles will fall below that in the arteries and the pulmonary and aortic valves will shut. Under resting conditions, only about half of the total volume of blood in the ventricles is ejected (i.e. the ejection fraction is about 50%)
6 The wave of contraction is followed by a relaxation phase. The refractory nature of the cardiac myocytes at this stage prevents another contraction occurring too soon after the first; it is essential that sufficient time is given between heartbeats to allow the chambers of the heart to fill properly. The relaxation (diastolic) phase of the cycle therefore allows blood to flow back into the heart, via the atria, before the start of another cycle.
Fig. 6.30 Cardiac cycle at rest: pressure, volume, and heart sounds.
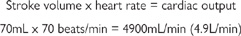
Each stroke of a healthy adult human heart under resting conditions ejects ~70mL into the systemic circulation, via the aorta. This volume is known as the ‘stroke volume’. The heart rate under the same conditions is usually ~70beats/min. Knowing these two parameters, we are able to calculate the amount of blood that is pumped out of the heart every minute (the cardiac output):
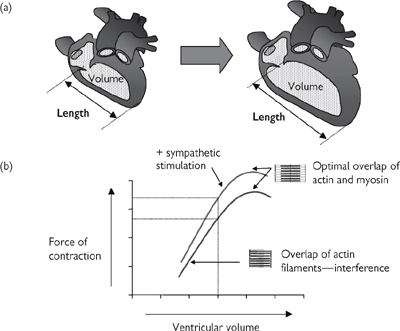
The force generated by contraction of cardiac myocytes is dependent on their length—just as it is for skeletal muscle fibres. The ‘length–tension’ relationship for cardiac tissue therefore bears a close similarity to that for skeletal muscle, but the length of the muscle is uniquely determined by the amount of blood in the ventricle when the heart is fully relaxed (the end diastolic volume; Fig. 6.32).
The Frank–Starling Law establishes that the force of contraction of the heart is related to the end diastolic volume (Fig. 6.32). Sympathetic nervous stimulation of the heart increases the efficiency of contractility—more force is generated for a given end-diastolic volume.
The end-diastolic volume is dependent on the amount of blood returning to the heart, also known as preload. In a non-compliant, fixed-volume, closed system, this would necessarily equal the amount of blood leaving the heart, meaning that increased cardiac output would be reflected in increased preload and increased force of contraction. Cardiac output is indeed a determinant of preload, but the issue is complicated by the fact that contraction of veins alters the volume of the vascular system and influences preload (Fig. 6.32): venous contraction reduces venous volume and increases preload and vice versa.
Therefore, while arterial tone is regarded as the primary determinant of blood pressure, venous tone has an impact on cardiac work and output, hence the ability of veno-selective dilators (e.g. nitrates) (p.440) to reduce cardiac O2 consumption by reducing cardiac work.
OHCM8 pp.140–5)Effective valves in the heart are essential for optimal pumping conditions because they prevent backflow of blood against the desired direction of flow. Valves are found between the atria and ventricles (the atrioventricular valves; mitral—left, tricuspid—right) and between the ventricles and the major arteries (aortic valve—left; pulmonary valve—right).
There are a number of potential causes of valve malfunction, which can be crudely divided into those that cause narrowing of the valve opening (stenosis) and those that cause the valve to leak, leading to regurgitation.
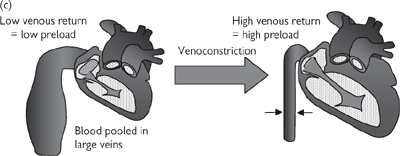
Fig. 6.32 Preload and the Frank–Starling Law (a) Ventricular volume determines cardiac muscle strength; (b) the Frank–Starling relationship between ventricular volume (muscle length) and force of contraction; (c) venoconstriction is a determinant of ventricular volume (preload).
• Rheumatic fever ( OHCM8 p.136) (autoimmune damage to valve tissue—more common in developing countries)
• Atherosclerotic degeneration.
• Bacterial infection (endocarditis) ( OHCM8 pp.144–5) or inflammation
• Prolapse (poorly supported or weak valve leaflets)
• Ventricular (AV valve disease) or aortic dilatation.
The physiological impact of heart valve disease is a loss of effective pumping in the heart resulting in symptoms consistent with reduced cardiac output:
• Angina (left-side valve disease)
• Oedema (pulmonary oedema for right-side valve disease, systemic oedema for left-side).
Dysfunctional valves are often first diagnosed by GPs, who detect abnormal heart noises (or murmurs). The normal ‘click’ of heart valves closing becomes a prolonged flutter on account of the valve leaflets fluttering or blood regurgitating through an insufficiently closed valve. The time and duration of the murmur is indicative of the valve that is damaged and the type of valve dysfunction (e.g. stenosis or regurgitation). However, diagnosis can only be confirmed with an ECG.
Box 6.9 summarizes the treatments for valvular diseases.
Box 6.9 Treatments and drug therapies of valvular diseases
• Advanced deterioration of valve function usually requires cardiological or surgical intervention, depending on the nature of the disease
• Valvuloplasty ( OHCM8 p.142) is a procedure conducted by a cardiologist in a patient with stenosed pulmonary or mitral valves; it does not require general anaesthesia. A balloon-tipped catheter is inserted into the femoral artery in the leg and manipulated remotely using X-ray imaging until the tip is across the stenosed valve, where it is inflated to increase the size of the opening and improve blood flow through it
• Valve replacement ( OHCM8 p.142) involves open-heart surgery. Damaged valves can be replaced by artificial valves or valves taken from cadavers (homografts) or from pigs (porcine xenografts). Artificial valves have the advantage of durability but patients with artificial grafts have to be maintained on antithrombotic drugs, while grafts from natural sources require replacement after ~10 years but do not require antithrombotics.
OHCM8 pp.128–31)The inability of the heart to meet the supply needs of the body is known as heart failure. Heart failure is often precipitated by a heart attack, which leads to the death of an area of ventricular myocardium and a reduction in the efficiency of ventricular contraction.
In patients with heart failure, the ejection fraction at rest falls considerably, with critical effects on cardiac output. For example, if the ejection fraction falls to 25%, only ~35mL is ejected with every heartbeat and cardiac output falls to ~2.5L/min (from the usual ~5L/min) leading to the following chain of events (see also Fig. 6.33):
• Blood pressure falls and is sensed by the baroreceptors and through a fall in renal blood flow
• Signals from the baroreceptors result in the stimulation of the sympathetic nervous system, which restores blood pressure to normal levels by increasing heart rate (via cardiac β1 adrenoceptors), blood volume (β adrenoceptors in the kidney), and vascular resistance (α1 receptors in arterioles)
• The shortfall in cardiac output is therefore compensated for at the expense of increased heart rate, peripheral vascular resistance (afterload), and blood volume (preload).
Unfortunately, this short-term solution has long-term consequences. The increased work rate of the heart, coupled with the increased resistance against which it has to pump blood, leads to the thickening of the ventricular walls (remodelling). While cardiac remodelling might be conceived to be advantageous on account of the strengthening of the muscle, it also leads to a further reduction in the volume of the ventricular chamber, reducing the stroke volume further.
Simultaneously, the reduction in renal perfusion activates the renin–angiotensin–aldosterone pathway (Fig. 6.33), leading to Na+ and water retention in the tissue (oedema) and pooling of blood in the central veins. The increase in central venous pressure constitutes an increase in cardiac preload, which might be predicted to improve cardiac contractility according to the Frank–Starling law (Fig. 6.32). However, the sympathetic compensation that has already taken place means that increasing the preload fails to increase contractility—instead, the heart becomes overloaded with blood (dilated).
This vicious cycle (Fig. 6.33) means that the initial reduction in stroke volume is compensated for by mechanisms that, ultimately, lead to a further reduction in stroke volume and a gradual deterioration in the condition. Heart failure is classified according to symptoms (New York Heart Association (NYHA)classification of heart failure OHCM8 p.131) (Table 6.5).
For treatment of heart failure, see Box 6.10.
Box 6.10 Treatment and drug therapies of heart failure ( OHCM8 pp.128–131) ( OHPDT2 Ch. 2)
The aim of treatment of heart failure is to break the vicious cycle to slow progression of the disease and prolong the life of sufferers:
• Reduce volume overload: as with hypertension, the kidney is a major target for therapeutic intervention in heart failure. Diuretics (e.g. furosemide) or angiotensin-converting enzyme (ACE) inhibitors (e.g. lisinopril) are the first-line drugs in heart failure. ACE inhibition has a secondary benefit of causing vasodilatation and reducing afterload, and may also slow or prevent processes involved in cardiac remodelling
• Veno-/vasodilatation: organic nitrates (e.g. isosorbide mononitrate) are veno-selective nitric oxide (NO) donor drugs that reduce cardiac workload primarily through reducing preload (although they may have some impact on afterload through vasodilatation as well). These drugs have been shown to reduce mortality
• Increase the force of ventricular contraction: cardiac glycosides (e.g. digoxin) can be prescribed if none of these treatments are showing benefit. These drugs are especially effective in patients with a dilated heart and work primarily by inhibiting the Na+/K+–ATPase, leading to an increase in intracellular Na+, which exchanges with calcium through the Na+/Ca2+ exchange pump. Ultimately, the extra Ca2+ swells the intracellular Ca2+ stores in the sarcoplasmic reticulum, meaning that more Ca2+ is released when the cells are stimulated. Cardiac glycosides can also slow the heart and improve rhythm. In acute heart failure, where a rapid increase in contractility is imperative, β1 adrenoceptor agonists (e.g. dobutamine) can be used
• Inhibit sympathetic activity: increased sympathetic activity contributes to the vicious cycle that exacerbates heart failure. Inhibition of β adrenoceptors in the heart has long been avoided on account of the perceived danger of reducing the force of contraction. However, it is now recognized that low doses of the β-blocker, carvedilol, in conjunction with a cardiac glycoside, ACE inhibitor, and diuretic can reduce mortality, although the precise mechanism of this action is still unknown. Physicians are advised to proceed cautiously with β-blockers in heart failure.
Table 6.5 NHYA classification of heart failure
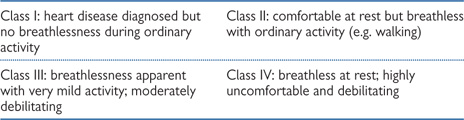
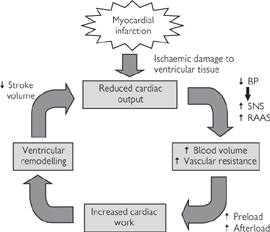
Fig. 6.33 The vicious cycle of heart failure is triggered by ischaemic damage to the ventricle. SNS, sympathetic nervous system; RAAS, renin–angiotensin–aldosterone system.
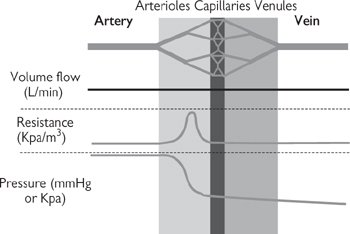
Blood is transported between the heart and the tissues by blood vessels (Fig. 6.34).
• Arteries carry blood from the heart to the tissues. They have thick, muscular walls to cope with the high pressures that they are exposed to, and to facilitate their constriction and dilatation to modulate blood pressure and flow distribution. Arteries become progressively smaller but more numerous with distance from the heart; the smallest arteries are called arterioles and are the primary determinant of resistance to flow, often termed peripheral vascular resistance or afterload
• Capillaries are very fine vessels (<50μm) that distribute blood from the arterioles throughout tissues. The walls of capillaries are only one endothelial cell in thickness and do not contract. The thin walls facilitate easy diffusion of O2 and glucose necessary for cellular respiration down the concentration gradient from the incoming blood, into the tissues. Waste metabolites (CO2, urea) diffuse in the opposite direction. An exception to this basic rule applies in the lungs (pulmonary circulation), where capillaries come into close contact with alveolar air to facilitate gaseous exchange, with the loss of CO2 to the atmosphere and the uptake of O2 into the red blood cells, where it is transported bound to haemoglobin
• Veins carry blood away from tissues and back to the heart. They have some vascular smooth muscle, but not as much as arteries; as a result they can contract and relax, but the changes in diameter are far less dramatic than in arteries. Blood leaving the capillaries enters small veins (venules), which progressively converge, pooling blood into increasingly large vessels. There is little pressure difference across the venous circulation, meaning that unaided flow of blood would be very slow. As a result, veins contain valves to prevent retrograde flow (backflow) and the venous return of blood to the heart is aided by contraction of the surrounding skeletal muscles. This is particularly important in humans, where our upright stance means that the effects of gravity have to be overcome to ensure the return of blood to the heart from our feet. The amount of blood returning to the atria of the heart determines preload.
An important feature of our blood vessels is that they contract and dilate in response to numerous signalling molecules in the body. The mechanism by which these effects occur are summarized and the cellular mechanisms are illustrated in Fig. 6.35.
• The primary stimulus for vascular smooth muscle contraction is activation of the sympathetic nervous system that innervates blood vessels. Increased sympathetic drive results in release of noradrenaline from sympathetic nerve terminals, which activates α1 and β2 adrenoceptors on the smooth muscle cells. Most arteries and arterioles have α1 receptors and contract in response to noradrenaline; α2 adrenoceptors are also found in these arteries, but they are probably stimulated by circulating adrenaline rather than by sympathetic nerve-derived noradrenaline. Arteries that supply skeletal muscle and some veins have a predominance of β2 adrenoceptors, which causes them to dilate in response to noradrenaline and circulating adrenaline. The net effect of increased sympathetic nervous system activity is to redistribute blood flow away from the internal organs to the skeletal muscles to prepare for ‘fight or flight’
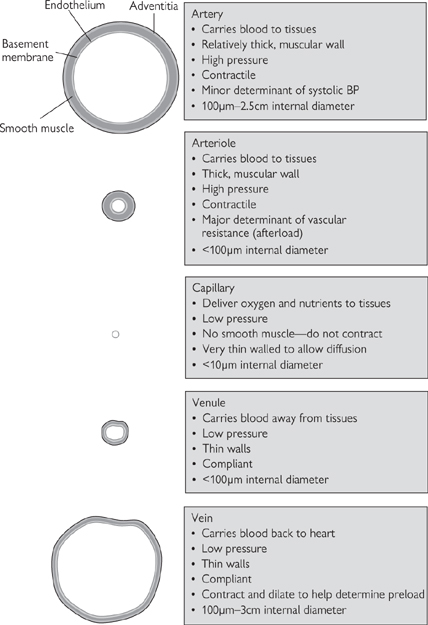
Fig. 6.34 Characteristics of different blood vessel types, showing the relative proportions of smooth muscle.
• ATP and neuropeptide Y are co-transmitters that are often released, with noradrenaline, to cause rapid or long-lasting vasoconstrictor effects respectively. Stimulation of β-adrenoceptors in the kidney also increases the amount of renin available to catalyse the first step in the renin–angiotensin–aldosterone system. One of the products of this system is angiotensin II, which is a powerful vasoconstrictor through stimulation of angiotensin (AT) receptors on the smooth muscle (primarily AT1 receptors).
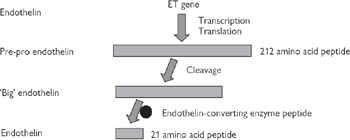
• The endothelins (ET-1, ET-2, ET-3—of which ET-1 is the most abundant) are endothelium-derived vasoconstrictor peptides, acting through ETA and ETB receptors on the smooth muscle. However, the action of ET-1 is modulated through stimulation of ETB receptors on the endothelium, which leads to the release of an endothelium-derived vasodilator, nitric oxide (Fig. 6.36, p.447)
• Thromboxane A2 (TXA2) is a prostanoid synthesized in platelets in response to vascular injury. As well as stimulating platelet activation, TXA2 is a powerful local vasoconstrictor, which helps to reduce blood loss after injury.
• Adenosine is primarily produced as a by-product of ATP breakdown, and can either be seen as a local or systemic vasodilator through stimulation of A2 receptors on the smooth muscle (except in the kidney, where stimulation of A1 receptors causes vasoconstriction). Adenosine is important in the heart, where it blocks AV conduction and reduces the force of contraction; adenosine release might be partly responsible for the pain associated with heart attacks. Adenosine is also a neuromodulator (A1 receptors), a bronchoconstrictor (A1), and a pro-inflammatory mediator (A3)
• Nitric oxide is one of a number of endothelium-derived vasodilators that are generated to cause local vasodilatation. Stimuli for nitric oxide generation include shear stress (the lateral stress experienced by endothelial cells due to blood flow), hypoxia, and circulating neurohormonal factors (e.g. substance P, bradykinin) that act to increase endothelial intracellular Ca2+. Endothelium-derived nitric oxide also acts as a powerful inhibitor of platelet activation and inflammatory cell adhesion. Dysfunction in nitric oxide production has been implicated in many cardiovascular diseases, including atherosclerosis. Nitric oxide is the most important endothelium-derived relaxing factor in large arteries
• Prostacyclin (PGI2) is a product of arachidonic acid metabolism, stimulated in response to many of the same mediators as nitric oxide. PGI2 acts synergistically with nitric oxide (the effect of combined release is greater than the sum of the two parts)
• Endothelium-derived hyperpolarizing factor (EDHF) is the dominant endothelium-derived factor in small (resistance) arteries. Its identity is still an unresolved issue, but K+ ions appear to play a prominent role.
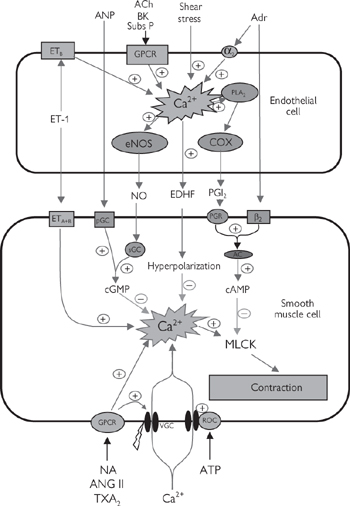
Fig. 6.35 Some of the cellular mechanisms underlying vascular smooth muscle contraction and dilation in response to endogenous signals.
Ach, acetylcholine; ANP, atrial natriuretic peptide; Adr, adrenaline; α2, α2 adrenoceptor; AC, adenylate cyclase; Ang II, angiotensin II; BK, bradykinin; β2, β2 adrenoceptor; ETA and ETB, endothelin receptors A and B; ET-1, endothelin-a; eNOS, endothelial nitric oxide synthase; COX, cyclo-oxygenase; EDHF, endothelium-derived hyperpolarizing factor; GPCR, G-protein-coupled receptor; MLCK, myosin light chain kinase; sGC/pGC, soluble and particulate guanylate cyclase; NA, noradrenaline; PLA2, phospholipase A2; PER, prostaglandin receptor; PGI2, prostacyclin; ROC, receptor-operated channel; Subs P, substance P; TXA2, thromboxane A2; VGC, voltage-gated channel.
The extent of constriction of any artery depends on the balance of vasoconstrictor and vasodilator stimuli. In the interests of efficiency, the signals from all of the different mediators are almost exclusively channelled through a single intracellular entity—the concentration of cytoplasmic calcium (Ca2+i): vasoconstrictors stimulate an increase in intracellular Ca2+i and vasodilators reduce Ca2+i, thus avoiding the potentially inefficient stimulation of two or more competing pathways (Fig. 6.35). Ca2+i derived from intracellular stores in the SR and through voltage-gated Ca2+ channels binds to calmodulin, which stimulates myosin light chain kinase (MLCK) to phosphorylate myosin—an essential step in the interaction of smooth muscle myosin with actin.
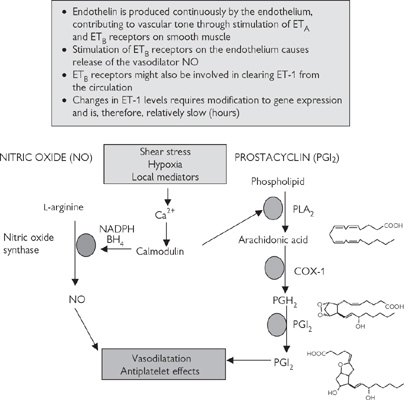
Fig. 6.36 Some of the endothelium-derived local regulators of vascular tone.
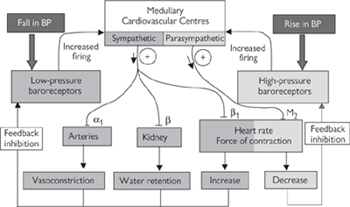
Blood pressure is constantly monitored by special receptors (baroreceptors). There are ‘high-pressure receptors’ in the aortic arch, pulmonary artery, and carotid arteries (carotid sinus), and ‘low-pressure receptors’ in the atria and adjacent large veins. Signals from both high- and low-pressure receptors are integrated in the ‘cardiovascular centres’ in the upper medulla and responded to by appropriate stimulation of the parasympathetic (to slow the heart in response to high blood pressure) or sympathetic (to accelerate heart rate, constrict blood vessels, and increase blood volume in response to low blood pressure) branches of the autonomic nervous system (Fig. 6.37).
The relationship between blood flow, resistance, and pressure bears close similarity to Ohm’s law for electricity (Fig. 6.38). The blood system is a closed circuit and the pressure within the system is determined by a number of parameters, all of which can be controlled from the cardiovascular centres in the medulla.
• Blood volume: the volume of fluid within a system with fairly rigid walls is an important determinant of pressure. Just as pumping more air into a tyre increases the tyre pressure, so increasing the volume of blood increases blood pressure. Indeed, the effect is far more dramatic in the blood system because, unlike air, blood is virtually incompressible—the molecules cannot be forced to come closer together by external force. However, the impact of changes in blood volume are partially damped out by the fact that arteries (like tyres) are compliant—the walls are able to stretch to accommodate more fluid without a proportional increase in pressure. As we age, our arteries stiffen (become less compliant—arteriosclerosis OHCM8 p.110)—a factor that contributes to the gradual increase in blood pressure that we experience with age. The kidney controls the blood volume by modulating the amount of salt and, consequently, water that is reabsorbed in the distal tubule. Blood volume-mediated changes are slow in onset and are not responsible for rapid compensatory changes in blood pressure, but are central to hypertension ( OHCM8 p.132)
• Cardiac output: as mentioned previously, cardiac output is determined both by heart rate and stroke volume. The relationship between cardiac output and blood pressure is a proportional one: if all other parameters remain unchanged (and ignoring compliance), doubling cardiac output would be expected to double blood pressure
• Vascular resistance: the resistance against which the heart has to work to drive blood through the arteries (or afterload) is a crucial determinant of blood pressure. The most important blood vessels involved in blood pressure determination are the arterioles because they are the smallest vessels in the arterial tree and are responsible for the resistance to flow (hence the term ‘resistance arteries’). The importance of arteriolar contraction is demonstrated in Arterioles are the primary determinant of resistance to blood flow. The simple model shown in Figure 6.39: in this case, contraction of an isolated arteriole, so that the diameter is halved (decreased by a factor of 2), causes the pressure in the system to rise by a factor of 24 (=16). Although the diameter of the large arteries is not the primary determinant on blood pressure, their contraction reduces their compliance, leading to a small increase in systolic blood pressure.
Fig. 6.37 Baroreceptor reflex responsible for blood pressure homeostasis.
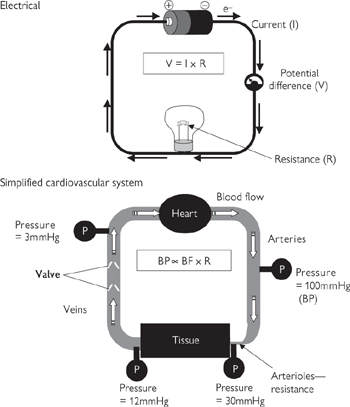
Fig. 6.38 Relevance of Ohm’s law to fluid dynamics in the cardiovascular system. BP, blood pressure; BF, blood flow; R, resistance.
Fig. 6.39 The importance of arteriolar radius (tone) on blood:
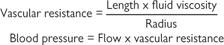
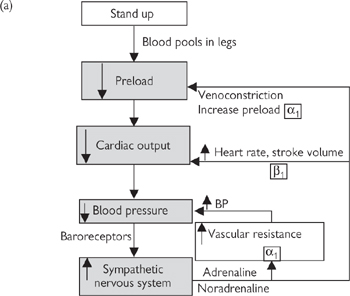
The rapid and integrated response to changes in blood pressure in humans is best illustrated with the example of what happens when we stand up (Fig. 6.40):
1 The action of standing leads to a rapid pooling of venous blood in the legs due to gravity, leaving less blood in the large central veins for return to the heart. More than 0.5L of blood is redistributed in this way upon standing.
2 The reduction in preload leads to a reduction in stroke volume (Frank–Starling law; Fig. 6.32) and, consequently, cardiac output. Arterial pressure falls momentarily. Baroreceptors in the large veins and atria detect the fall in central venous pressure.
3 Signals from the low-pressure baroreceptors are processed in the cardiovascular centres of the medulla and the sympathetic nervous system is stimulated (Fig. 6.40).
4 Heart rate increases, peripheral vascular resistance increases, central veins contract—all of which returns arterial and venous pressure to near-normal levels within a few seconds.
Fig. 6.40 Cardiovascular effects of: (a) change in posture; (b) exercise.
The importance of the sympathetic nervous system in this process is highlighted by the fact that a major side-effect of inhibitors of the synthesis of noradrenaline is postural hypotension ( OHCM8 p.39) (low blood pressure on standing, which can cause fainting).
The cardiovascular reflex to posture is an example of our response to a sudden change in blood pressure—a similar response would be experienced if blood volume fell suddenly due to blood loss through haemorrhage. For the most part, however, this reflex system responds to minor changes in blood pressure induced by our environment. It is comparable to a thermostatically controlled heating system, switching on and off in response to moment-by-moment changes in blood pressure. The effects are widespread—low pressure stimulates the entire sympathetic nervous system, which impacts on all our arteries and veins as well as the heart and kidney. High blood pressure stimulates the parasympathetic nervous system, which slows the heart and reduces cardiac output, affecting blood flow to all parts of the body.
Although there is some modification of the pattern of blood flow upon sympathetic stimulation, determined by the distribution of α and β adrenoceptors in blood vessels of different tissues, there is little or no capability for responding to the specific needs of a particular organ or tissue. Therefore, superimposed on these systemic mechanisms that keep a tight grip on blood pressure, are local control systems that react to the immediate metabolic requirements of a given tissue.
There are several key features that are shared by local mediators:
• They are generated in response to detectable changes in the local environment (e.g. ischaemia, increased levels of metabolites, increased shear stress caused by elevated blood flow)
• They are generated very rapidly in order that they can execute a rapid response
• They are metabolized or inactivated rapidly so that their effects remain local.
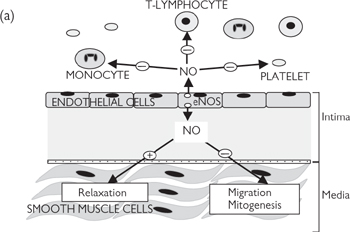
The endothelium that lines all blood vessels is ideally situated to detect and respond to changes in the local environment, as it is the interface between the flowing blood and the vessel wall. It is not surprising, therefore, that the endothelium is a hotbed for the production of local modulators of blood vessel tone, particularly vasodilators. The importance of the endothelium is highlighted by the fact that so-called ‘endothelial dysfunction’ has been implicated in a range of cardiovascular disease, including atherosclerosis.
Nitric oxide is synthesized in response to an increase in Ca2+ within the endothelial cells, triggered by ischaemia, shear stress, or circulating modulators (including bradykinin and substance P). Ca2+ binds to calmodulin and stimulates the endothelial isoform of the enzyme, nitric oxide synthase (eNOS), leading to increased generation of the free radical nitric oxide (see Fig. 6.35). This is a small molecule and diffuses rapidly into both the vessel wall and the lumen to cause vasodilatation and inhibition of platelet and monocyte function. Endothelial nitric oxide is usually generated in very low concentrations (low nM range), indicating its potency as a signalling molecule. Its nature as a free radical means that it is highly reactive, with a biological half-life of only a few seconds. Most of the effects of nitric oxide are cGMP-mediated (see Fig. 6.35), but there is evidence of cGMP-independent mechanisms, particularly when nitric oxide is generated in higher concentrations. Organic nitrates that are often used in angina undergo tissue-mediated metabolism to release nitric oxide.
Nitric oxide is also known to be the non-adrenergic, non-cholinergic (NANC) neurotransmitter found in specific nerves and an inducible isoform of the enzyme (iNOS) is expressed in response to inflammatory stimuli; local concentrations of NO from iNOS are believed to be ~1000 times higher than those from eNOS, reflecting its change in function from a highly controllable local mediator to a cytotoxic agent for use by the immune system.
Prostacyclin (PGI2) acts synergistically with nitric oxide and is generated in response to similar stimuli. It has a relatively short half-life (<5min), but its dilution in flowing blood reduces its activity as it is washed away from its site of production. PGI2 is synthesized from arachidonic acid by a three-step process involving phospholipase A2, cyclo-oxygenase 1 (COX-1), and prostacyclin synthase (see Fig. 6.36). PGE2 is a closely related prostanoid that also causes vasodilatation.
Exercise is defined as an increase in skeletal muscle activity, which requires modifications to the cardiovascular system to accommodate the increased metabolic needs of muscular tissue (see Fig. 6.40). In the first instance, this might be achieved simply by activation of local mediators in response to the hypoxia that rapidly develops during exercise. However, exercise is also associated with an increase in sympathetic drive, resulting in release of noradrenaline and adrenaline, with the following effects:
• Vasodilatation of arteries that supply skeletal muscle through β2 adrenoceptors (partly mediated by the endothelium)
• Vasoconstriction of blood vessels supplying the major organs and the gut through α1 adrenoceptors
• Increased heart rate and stroke volume through stimulation of β1 adrenoceptors
• Bronchodilatation mediated by circulating adrenaline acting on β2 adrenoceptors in the bronchi; the breathing rate will also increase in response to activation of oxygen and carbon dioxide chemoreceptors.
These processes combine to cause a considerable increase in cardiac output to account for the massive increase in oxygen consumption and a prioritization of blood distribution to favour muscles at the expense of other tissues. In a trained athlete, heart rate can easily treble (from ~50beats/min to >150beats/min), stroke volume can more than double (80 → 160mL/min), resulting in an increase in cardiac output from ~4L/min to up to ~40L/min. If peripheral resistance were to remain constant, systolic blood pressure under these conditions would rise above 1000mmHg, which would clearly exceed the limits of blood vessel strength. In the event, blood pressure usually only reaches approximately double the normal values (~200mmHg), indicative of an overall decrease in peripheral resistance. Clearly, the signals from the higher centres that are driving the exercise overcome the signals from the high-pressure baroreceptors, which would normally act to return blood pressure to normal by reducing heart rate through vagal stimulation. The body relinquishes its tight grip on blood pressure in order to meet the immediate metabolic needs of the muscles.
OHCM8 pp.132–5)Hypertension is a condition that is characterized by chronically elevated blood pressure and is a risk factor for other cardiovascular diseases including coronary artery disease, myocardial infarction, stroke, and heart failure.
In reality, an artificial limit has to be defined to enable the distinction between hypertension and normal blood pressure. From the clinical perspective, two levels have now been set:
• Patients with blood pressure >160/100mmHg should be treated
• Blood pressures of 140/90–159/99mmHg are in the ‘grey area’: the physician must decide whether the elevated blood pressure constitutes a significant risk of heart disease on a case by case basis. In order to make this judgement, other risk factors (e.g. diabetes, smoking, high LDL) will be taken into account. The more risk factors, the greater the need to treat.
Mild hypertension is asymptomatic and regular blood pressure measurements conducted by GPs is sufficient to ensure early diagnosis and improved prognosis in hypertension. Originally, it was assumed that diastolic pressure was the best indicator of hypertension but, more recently, it has become generally accepted that risk of conditions such as coronary artery disease is more closely linked to systolic blood pressure, leading to this measure being the prime consideration in diagnosis of hypertension.
The specific cause of hypertension can only be clearly identified in a small percentage of cases (~5%)—so-called ‘secondary’ hypertension, which can be due to:
• Renal disease, e.g. renal stenosis (blockage of the renal arteries), glomerular nephritis (inflammation of the glomerulus), diabetic nephropathy (damage to the nephron induced by diabetes)
• Endocrine diseases, e.g. tumour-related overproduction of aldosterone (Cushing’s ( OHCM8 p.216, Conn’s syndromes ( OHCM8 p.220) or adrenaline (phaeochromocytoma ( OHCM8 p.220))
• Other clearly identifiable causes, e.g. monoamine oxidase inhibitors (amphetamines), pregnancy.
The remaining vast majority of hypertensive cases (~95%) are collectively diagnosed as essential hypertension, for which the cause is undefined. However, it is a broadly held view that sufferers are genetically predisposed to the condition through a renal disorder.
For treatment of hypertension, see Box 6.11.
Box 6.11 Treatment and drug therapies for hypertension ( OHPDT2 Ch. 2)
Irrespective of the cause of hypertension, the primary aim of treatment is to reduce blood pressure in order to lower the risk of accelerated atherosclerotic disease (see Fig. 6.43, p.461) that can lead to heart attack or stroke (see Fig. 6.42, p.460).
As with most cardiovascular disorders, the primary target for drug intervention in hypertension is not necessarily the heart. Instead, it has proved more profitable to target drugs at the kidney (as renal dysfunction is intrinsically linked to the pathogenesis of the condition) or the blood vessels.
Thiazides (e.g. bendroflumethiazide) can be used to treat hypertension: they inhibit the Na+/Cl– transporter in the distal convoluted tubule, resulting in an increase in sodium excretion, which is associated with increased water excretion and reduced blood volume. Side-effects include K+ loss ( OHCM8 p.688) (hypokalaemia) and postural hypotension ( OHCM8 p.39) (low blood pressure when upright, leading to dizziness or fainting).
Although β1 adrenoceptors in the heart are a logical target for β-blockers, these receptors are only significantly activated during stress, exercise, or heart failure, when the sympathetic nervous system is stimulated. β-blockers are, therefore, only likely to have an inhibitory effect on heart rate when there is increased sympathetic drive; they will have little impact on the heart at rest, when its rate and force of contraction is primarily determined by the parasympathetic nervous system (vagus nerve).
In reality, the primary effect of β-blockers is not mediated by inhibition of cardiac β-receptors but those in the kidney that ordinarily activate synthesis of the enzyme renin, which is required to convert angiotensinogen to angiotensin I in the renin–angiotensin–aldosterone system (Fig. 6.41). Angiotensin I is subsequently converted to angiotensin II, which increases blood pressure by the combined effect of increased systemic vasoconstriction and through salt and water retention. The immediate benefit of β-blockers in reducing blood pressure is likely to be coupled to long-term benefits through inhibition of angiotensin II-mediated vascular hypertrophy and hyperplasia, which exacerbates hypertension and plays a role in the progression of conditions such as arteriosclerosis and atherosclerosis.
ACE inhibitors, angiotensin receptor antagonists
The renin–angiotensin–aldosterone system is clearly an important therapeutic target in hypertension because of its dual impact on salt handling by the kidney and vasoconstriction of blood vessels (Fig. 6.41). Whilst β-blockers act on the first step in this process, ACE inhibitors act on the enzyme that converts angiotensin I to angiotensin II—ACE. Like β-blockers, these drugs ultimately reduce the amount of circulating angiotensin II that can activate AT receptors in the kidney and in the blood vessels to cause salt retention and vasoconstriction respectively.
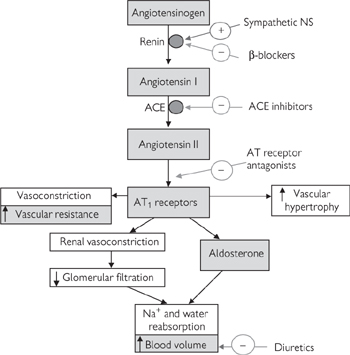
Fig. 6.41 The renin–angiotensin–aldosterone system.
ACE inhibitors will also share the long-term benefits of β-blockers, by inhibiting vascular remodelling that plays a role in the progression of hypertension and other vascular diseases.
The side-effects of ACE inhibitors include increased K+ retention and cough, which is because ACE also mediates the metabolism of the peptide, bradykinin, through its neutral endopeptidase activity. Increased bradykinin in the bronchial mucosa is responsible for stimulation of the cough reflex.
Some of the side-effects of ACE inhibitors are avoided by inhibition of the renin–angiotensin–aldosterone system at the AT receptors. AT1 receptors mediate most of the pro-hypertensive effects of angiotensin II (Fig. 6.41) (AT2 receptor function is still largely unknown) and a number of AT1-specific receptor antagonists (e.g. losartan) are increasingly popular in hypertensive therapy. An added benefit of AT1 receptor antagonists over ACE inhibitors surrounds a possible alternative route for angiotensin II synthesis via the enzyme chymase. While it is unclear whether the chymase route of synthesis is clinically relevant, the possibility remains that ACE inhibition might be partially circumnavigated by this route.
Ca2+ is central to contraction of both smooth and cardiac muscle. Inhibition of the mechanisms that cause the levels of cytoplasmic Ca2+ to rise and mediate contraction, are legitimate therapeutic targets in hypertension because they might cause vasodilatation (reduced afterload) and reduced cardiac output. A reduction in cytoplasmic Ca2+ can be effected by a number of means:
• Inhibition of release from endoplasmic reticulum
• Inhibition of activation of voltage-gated (e.g. L-type) Ca2+ channels in the plasma membrane
• Increased sequestration into the endoplasmic reticulum
• Increased extrusion via calcium pumps or exchange mechanisms.
The majority of therapeutic agents act to prevent stimulation of L-type voltage-gated Ca2+ channels. These drugs fall into three broad categories: dihydropyridines (e.g. nifedipine, amlodipine; vessel selective) benzothiazepines (e.g. diltiazem; fairly non-selective); and phenylalkylamine (e.g. verapamil; cardiac selective). Dihydropyridines are favoured in hypertension—particularly amlodipine, which has a long plasma half-life. Their action is primarily on resistance arteries that determine blood pressure (peripheral vascular resistance, afterload) but their use is often associated with reflex tachycardia (compensatory increase in heart rate), unless administered in conjunction with β-blockers.
Side-effects of Ca2+ antagonists used in hypertension are mainly associated with their vasodilator action: headache, flushing, and oedema (swelling), particularly in the ankles.
Many of the drugs (other than β-blockers) that reduce blood pressure through actions on the sympathetic nervous system, have been used as anti-hypertensives in the past. However, these usually carry fairly severe side-effects, particularly with respect to postural hypotension. Nevertheless, methyl-dopa, which is metabolized to the false transmitter, α-methylnoradrenaline, is still occasionally used in pregnancy; the α2 agonist, clonidine (which enhances the negative feedback system in sympathetic nerve terminals), is sometimes used in refractory cases; and α1 receptor antagonists (e.g. doxazosin) might have an added benefit on the plasma lipid profile (LDL/HDL). Hydralazine can be used as an alternative vasodilator to reduce afterload; its mechanism of action is poorly understood but might involve the inhibition of Ca2+ release from the smooth muscle SR. Like Ca2+ antagonists, its use is associated with reflex tachycardia and it should be given with a β-blocker. Mixed endothelin receptor antagonists (e.g. bosentan) are showing promise in the treatment of pulmonary hypertension, by preventing the powerful vasoconstrictor action of the endothelium-derived peptide, ET-1.
There are considerable differences in sensitivity of patients to these drugs and it is often a case of trial and error to find the most suitable drug, or combination of drugs, for a patient. This is an area of medicine that might realize considerable benefit from pharmacogenomics.
Atherosclerosis is a complex disease process that results in the deposition of lipids in discrete lesions (plaques) found in the walls of large conduit arteries. Although atherosclerotic lesions are found in almost all of us from an early age, their prevalence is greatly increased by a number of risk factors, including genetic predisposition, gender (male), a high lipid diet, smoking, hypertension, and diabetes (Fig. 6.42).
Plaque distribution is not random: plaques are absent from veins and the microvasculature and their distribution in large arteries coincides with bifurcations, bends, and branch points, where blood flow is disturbed (turbulent). Coronary arteries are particularly susceptible to plaque formation because, as well as their being tortuous and highly branched, the flow is particularly disturbed by the beating heart in which they are embedded.
The response to injury model shown in Figure 6.43 is widely accepted to explain the initiation and progression of the disease.
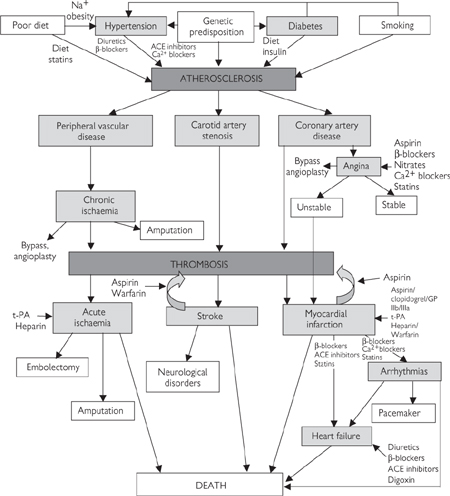
Fig. 6.42 Inter-relationships between risk factors and disease processes: interventional strategies.
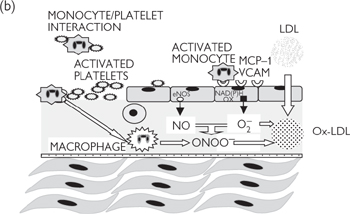
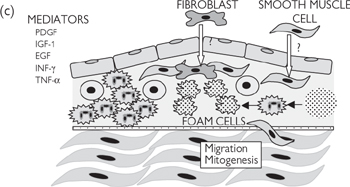
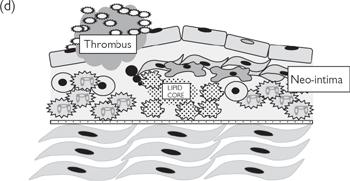
Fig. 6.43 Pathogenesis of atherosclerosis—response to injury: (a) healthy endothelium; (b) damaged/dysfunctional endothelium; (c) inflammatory phase; (d) unresolved inflammation; plaque rupture; thrombosis.
Disturbed flow leads to endothelial dysfunction or erosion, with the loss of the protective effects of nitric oxide in particular. The affected endothelium becomes ‘activated’, expressing a range of adhesion molecules (e.g. vascular cell adhesion molecule 1; VCAM-1), which ‘capture’ circulating monocytes. Endothelial erosion exposes the collagen-rich prothrombotic subendothelium, to which platelets adhere, forming microthrombi. There may also be increased release of proatherogenic endothelium-derived ET-1. A further consequence is the generation of the oxidizing free radical, superoxide, from NAD(P)H oxidases in the endothelial membrane.
Captured monocytes infiltrate through the endothelium, where they differentiate into macrophages in response to growth factors, cytokines, and chemoattractants generated by infiltrating T-lymphocytes (e.g. granulocyte colony stimulating factor; G-CSF), which go on to generate high concentrations of several pro-oxidant species (superoxide, nitric oxide, peroxynitrite) designed to kill pathogens. The inflammatory process is exacerbated by adherent platelets, which degranulate, releasing a number of pro-inflammatory mediators (e.g. PDGF). Neighbouring smooth muscle cells begin to proliferate and migrate to form the ‘neointima’ in response to growth factors and in the absence of anti-mitogenic nitric oxide. The smooth muscle cells of the neointima conform to a non-contractile, secretory phenotype, generating extracellular matrix to stabilize the developing plaque (fibrosis).
Normally, circulating lipids, in the form of LDLs, diffuse readily in and out of the vessel wall without consequence. However, in the highly oxidizing environment of a developing atherosclerotic lesion, LDLs are rapidly oxidized (forming ox-LDLs), which are recognized by scavenger receptors on macrophages, prior to phagocytosis. The ox-LDLs are trapped in the vessel wall in macrophages (now called foam cells), which ultimately die, releasing their contents to form the lipid-rich core of the plaque. Calcification is also a feature of mature plaques in humans.
Most atherosclerotic plaques stabilize at this point, as inflammation is resolved. A stable plaque will partially occlude the lumen of the artery and the extent and site of the occlusion (or ‘stenosis’) will determine whether the individual has symptoms. Stable angina pectoris ( OHCM8 p.110) is caused by restricted blood flow through a stenosed coronary artery. Patients with angina, therefore, experience severe chest pain caused by hypoxia associated with insufficient blood supply to part of the myocardium in response to increased demand (e.g. exercise). Symptoms can be successfully managed using organic nitrate drugs (glyceryl trinitrate spray or sublingual tablet) immediately before exercise. Patients are also recommended to take low-dose aspirin daily to reduce the chance of thrombosis, as well as β-blockers to reduce the work rate and oxygen demand of the heart. Severe cases may be treated with balloon angioplasty ( OHCM8 p.110) or bypass surgery ( OHCM8 p.110), although both procedures carry risks of re-occlusion (due to restenosis or thrombosis). Stenoses in the large conduit arteries of the leg (e.g. femoral arteries) can lead to ischaemia (lack of oxygen) to the affected limbs, causing severe pain and, in some cases, infection or gangrene. Treatments for this so-called peripheral vascular disease include angioplasty and stenting, or bypass grafting. Very severe cases require amputation to prevent sepsis and gangrene.
Plaques that remain inflamed can become unstable (prone to rupture). The mechanism that determines the stability of atherosclerotic plaques is not yet fully understood, but the consequences of plaque rupture can be devastating. Material from the core bursts through the weakened neo-intima, where it comes in contact with the blood. This material is highly thrombogenic, leading to rapid platelet adhesion and aggregation, with the associated activation of the coagulation cascade. The resulting thrombus may completely occlude the artery at the site of the plaque or become dislodged, forming an embolus that passes further down the arterial tree before occluding a smaller vessel. The result is an acute ischaemic event: in the heart (coronary arteries), this causes myocardial infarction (MI) ( OHCM8 pp.112–6); in the brain (carotid arteries), a stroke; and in the leg, acute peripheral ischaemia ( OHCM8 pp.658–9) (femoral arteries, although this may also be caused by an embolus from elsewhere). All are extremely serious and require emergency treatment, although the severity of the event is entirely dependent on the site of the thrombus, the size of the ischaemic area, and the speed at which the correct medical attention is provided (Box 6.12).
Box 6.12 Treatments and drug therapies of atherosclerosis ( OHPDT2 p.56)
It is the lipid accumulation stage of the atherosclerotic process for which the most effective drug therapies have been targeted.
• Lowering plasma LDL levels is known to reduce mortality in patients with atherosclerosis-related conditions
• Moderate benefits can be seen with improved diets, but the recent introduction of the drug class known as statins ( OHCM8 p.109) (which inhibit de novo synthesis of cholesterol in the liver resulting in up-regulation of LDL receptors that effectively reduce circulating LDL) has lead to dramatic improvements in lipid lowering
• Statins are routinely prescribed to ‘at risk’ patients, and it has since transpired that statins also have a range of other benefits, particularly with respect to the restoration of a healthy endothelium, anti-platelet effects, and plaque stabilization
• Other primary prevention is aimed at reducing the prevalence of pro-oxidant species by stopping smoking and treating diabetes
• Other drug therapies are targeted at the thrombotic consequences of atherosclerosis— aspirin (MI), warfarin (embolic events), or heparin (peripheral ischaemia). Patients with MI should also be prescribed thrombolytic therapy ( OHCM8 p.808) (tissue plasminogen activator (t-PA), streptomycin) as soon as possible. ACE inhibitors and β-blockers have both been shown to reduce subsequent mortality.
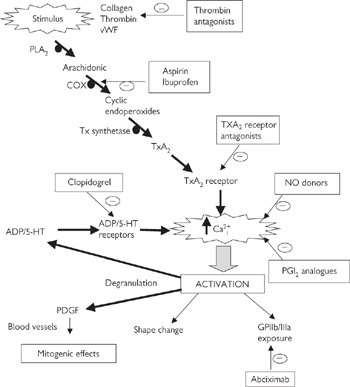
Platelets play a central role in haemostasis—the process that stops blood loss after blood vessels injury. There are three components of haemostasis:
• Platelet activation to form a loose plug as a stop-gap measure
• Local vasoconstriction to reduce blood flow to the affected area
• Activation of the coagulation cascade to convert soluble fibrinogen to fibrin strands that form a mesh around the platelet plug and trap other blood cells, to generate a more permanent repair to the damaged vessel.
These processes are closely interlinked. Platelet activation in response to exposed collagen at the wound results in their synthesizing the vasoconstrictor and platelet activator, TXA2, and their release of granules containing the vasoconstrictors (adrenaline and 5-HT, as well as inflammatory mediators (e.g. platelet-activating factor (PAF), PDGF). Meanwhile, collagen and platelets stimulate the intrinsic pathway for blood coagulation, whilst the tissue damage stimulates the extrinsic pathway. These pathways converge to convert prothrombin (so-called factor II) to thrombin (factor II activated; IIa), which acts to convert fibrinogen to fibrin and to further recruit platelets. The processes of platelet activation and coagulation will now be looked at in more detail.
There are a range of different glycoprotein (GP) receptors on platelet membranes, which recognize and bind to a variety of ligands, including collagen and von Willebrand factor (vWF)—a factor secreted by the endothelium in response to injury). Stimulation of these receptors triggers the platelet activation pathway (Fig. 6.44), resulting in an increase in intracellular Ca2+—the trigger responsible for the following cellular effects:
• Change of shape: pseudopodia emerge from the normal smooth discoid platelet surface, vastly increasing the surface area and, consequently, the adhesiveness of the platelets
• Degranulation: release of vasoconstrictor and platelet-activating factors to cause vasoconstriction and platelet recruitment respectively
• GPIIb/IIIa exposure: a conformational change in the membrane leads to the exposure of the otherwise hidden glycoprotein, GPIIb/IIia, which binds to fibrinogen to help stabilize the platelet plug.
Fig. 6.44 Platelet activation pathways and therapeutic interventions.
Coagulation consists of two cascade pathways (Fig. 6.45(a)) that converge to generate the activated serine protease, thrombin (factor IIa), which is responsible for the polymerization of soluble fibrinogen into fibrin strands. The purpose of the cascade systems is to amplify the signal: activation of a small amount of one factor in the cascade generates large amounts of the next factor downstream, and so on. The result is rapid formation of large amounts of fibrin in response to what may have been a fairly weak initial signal.
Each step in the cascade involves the activation of normally inactive circulating enzymes (known as ‘factors’), most of which are serine proteases. As each factor becomes activated, it catalyses a specific proteolytic event in the subsequent factor in the cascade to activate it. Fibrin formed from soluble fibrinogen is finally stabilized by the action of factor XIIIa.
OHCM8 p.338)Haemophilia is a sex-linked genetic disorder that affects men only and constitutes an inability to synthesize factor VIII (classical haemophilia) or, more rarely, factor IX (haemophilia B or Christmas disease). Until recently, transfusions of whole plasma, or purified, concentrated preparations of missing factors (from the blood of healthy donors) has been the means of factor supplementation. However, with the risk of transfusion-transmitted infectious diseases (e.g. HIV and hepatitis), recombinant factor VIII and IX are now available, although their manufacture has proved difficult because of the need for post-translational modification of the proteins. Genetically modified animals offer hope in this area: they can be genetically manipulated to produce essential coagulation factors in their milk.
Haemostasis is clearly a crucial process in the very rapid formation of a temporary patch in damaged blood vessels, in advance of the healing process effecting a permanent repair. However, it is essential that the haemostatic process is only stimulated in damaged vessels and that inappropriate clotting (known as thrombosis), that would prevent blood flowing to tissues and organs, is avoided.
• Antithrombin III (ATIII) is central to preventing thrombosis by binding to the active site of all of the factors involved in the coagulation cascade and inhibiting their action (Fig. 6.45(b))
• The endothelial lining of blood vessels is now recognized to be central to preventing thrombosis in undamaged vessels by a number of mechanisms (Fig. 6.46)
• Presenting a physical barrier that separates platelets and coagulation factors in the blood from stimulatory collagen in the sub-endothelial layers of the blood vessel
• Secretion of heparan sulphate on the luminal surface to activate ATIII and prevent activation of the clotting factors
• Synthesis of powerful inhibitors of platelet activation. Prostacyclin (PGI2) and nitric oxide act synergistically to prevent the increase in intra-platelet Ca2+ that is essential for activation
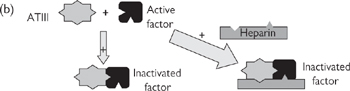
Fig. 6.45 (a) The coagulation cascade; (b) inhibition of coagulation by antithrombin III—effect of heparin.
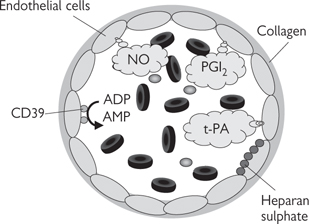
Fig. 6.46 Anti-platelet and anti-coagulation properties of the endothelium.
• Expression of the enzyme CD39 on the luminal surface to convert the platelet activator, ADP, to inactive AMP
• Release of t-PA to convert plasminogen to plasmin, which cleaves fibrin strands, earning t-PA the title ‘clot-buster’.
Damage to, or dysfunction of, the endothelium compromises some or all of these protective effects and also leads to the release of the platelet activator, vWF, and the t-PA inhibitor, plasminogen activator inhibitor-1 (PAI-1). This is believed to be a vital step in a number of pathological conditions that cause thrombosis, with potentially fatal consequences. The site (arterial or venous) of thrombus generation is important in determining the morphology and cardiovascular impact of thrombosis:
• Arterial thrombi are predominantly composed of activated platelets (so-called ‘white thrombus’) with some fibrin. They can be caused by atherosclerotic plaque rupture or release of pro-thrombotic debris during vascular surgery or interventional cardiology procedures. They may remain at the initial site of thrombosis or be carried downstream as an embolus where they will block a smaller artery in the same vascular tree
• Venous thrombi are mainly fibrin with few platelets and a large proportion of red blood cells that become trapped in the mesh (red thrombus). Venous thrombi tend to form in conditions where venous flow has stopped (deep vein thrombosis caused by extended physical inactivity, such as long flights in cramped conditions) or AF, where blood pools in the atrial chambers of the heart. Venous thrombi are of little consequence whilst they remain at their site of origin, but at some point, they will become dislodged and will pass through the heart into the arterial circulation as an embolus, with potentially catastrophic effects. Those that originate in the systemic venous circulation will pass through the heart into the pulmonary artery, causing pulmonary thrombosis, those that originate in the left atrium will pass into the systemic arterial circulation, where will they cause thrombosis in whatever tissue or organ chance takes them (e.g. the brain to cause a stroke, the heart to cause MI or the limbs to cause acute ischaemia). A recognized side-effect of some oral contraceptives is an increased risk of venous thromboembolism.
Box 6.13 summarizes the treatments.
Box 6.13 Treatments and drug therapies
Antiplatelet agents ( OHPDT2 Ch. 2)
Antiplatelet agents are a particularly useful therapeutic approach to prophylaxis against arterial thrombotic events associated with atherosclerotic disease. Indeed, low-dose aspirin is recognized to be a cheap and effective means of reducing the risk of thrombotic events and is routinely prescribed for patients with a history of cardiovascular disease.
Platelet activation pathways provide several points for drug intervention (see Fig. 6.44):
• COX-1: Conversion of arachidonic acid to the TXA2 precursor, prostaglandin H2, is an essential intermediate step in collagen-stimulated platelet activation. Aspirin and ibuprofen inhibit the enzyme by covalent modification (acetylation) of a critical serine residue in the enzyme. The inhibition is irreversible for aspirin and, uniquely in platelets, will persist for the lifetime of the platelet because, unlike other cells, they have no DNA from which to synthesize replacement COX. The lack of ability of platelets to replace inhibited COX may contribute to the apparent platelet selectivity of COX inhibitors. Their use is limited by gastric irritation, which can lead to gastric ulcers
• ADP receptors: Clopidogrel is an ADP receptor antagonist that is emerging as a desirable antiplatelet agent with clinical benefit in a number of settings, particularly in the prevention of thrombosis related to interventional cardiology (e.g. balloon angioplasty and stenting). Given that ADP is unlikely to be the initial trigger for activation, these agents probably block the recruitment phase of thrombosis that is in part mediated by ADP secreted in granules from activated platelets (see Fig. 6.44). To date, few side-effects have been reported although there is at least a theoretical risk of bleeding
• GPIIb/IIIa receptors: These agents (e.g. abciximab) have been developed to block the receptors that bind to fibrinogen. They have been found to be particularly powerful and are associated with an increased risk of haemorrhage. ADP antagonists appear to have a preferable therapeutic profile
• Other possible targets: TXA2 receptor antagonists are under investigation as antiplatelet agents. Nitric oxide donor drugs that inhibit the increase in Ca2+ through CGMP and cAMP production respectively, might be highly effective inhibitors of platelet activation. Combined nitric oxide/aspirin drugs are under development, with the possible advantage of reduced gastric toxicity.
Anticoagulants ( OHCM8 pp.344–5) ( OHPDT2 Ch. 2)
Drug interventions that impact on the coagulation pathway focus on the following targets:
• Inhibition of the vitamin K-dependent post-translational modification of clotting factors: factors II, VII, IX, and X require post-translational γ-carboxylation before they are functional. This conversion involves the carboxylation of glutamic acid to γ-carboxyglutamic acid and requires the co-factor, vitamin K (Fig. 6.47), which is oxidized to an epoxide in the process. Reconstitution of vitamin K to the reduced form involves the enzyme, vitamin K reductase. Warfarin is an oral anticoagulant (first developed as a rat poison) that inhibits vitamin K reductase and reduces the amount of available vitamin K for post-translational modification of clotting factors. The effects of warfarin are slow in onset (~40h) and reversal by oral vitamin K supplementation is also slow. As a result, careful dose titration is critical to ensure that sufficient drug is available to inhibit synthesis of functional clotting factors without causing potentially fatal haemorrhage by preventing the clotting process altogether
• Potentiation of the inhibitory effects of the endogenous anticoagulant, ATIII: Each step in the coagulation cascade is inhibited by ATIII, which acts to prevent inappropriate coagulation in vivo. Heparin has long been recognized to potentiate the effects of ATIII by simultaneously binding to it and the target activated clotting factor (Fig. 6.47). Factor Xa is an exception, where it appears that binding of heparin to ATIII alone is sufficient to modulate its activity. Low molecular weight heparins (LMWHs) have been developed to act primarily on factor Xa. Heparin and LMWHs carry the side-effect of an increased risk of bleeding, but prolonged use of heparin can trigger an immune response which causes paradoxical thrombotic thrombocytopenia (a pro-thrombotic state)
• Thrombin inhibitors: A number of direct inhibitors of thrombin are under development. Hirudin is the anticoagulant used by the medical leech to prevent blood clotting and facilitate continuous feeding. Trials of hirudin have been disappointing to date, but several other thrombin inhibitors are being trialled, including hirugin and PPAK, both of which are able to inhibit thrombin even once it has bound to fibrinogen.
Fibrinolytic drugs (clot-busters) ( OHCM8 pp.339, 475, 808)
In the unfortunate event of a thrombotic event, it is essential to restore blood flow to the ischaemic area as soon as possible to minimize the area of infarct. The drugs of choice are recombinant t-PAs (alteplase, duteplase, reteplase) and streptokinase, which act to support endogenous fibrinolytic agents, t-PA, and urokinase-type plasminogen activator (u-PA) in converting inactive plasminogen in clots to the active fibrinolytic enzyme, plasmin (Fig. 6.48). Plasmin induces the lysis of fibrin, fibrinogen, and many of the clotting factors. Fibrinolytic agents administered within 12h of myocardial infarction and 3h of stroke have shown real clinical benefit in terms of the post-trauma impairment suffered by patients. However, fibrinolytics can cause severe bleeding and it is recommended that they are not used again in the same patient for 1 year. Bleeding complications can be reversed by tranexamic acid.
Fig. 6.47 Role of vitamin K in post-translational modification of clotting factors—effect of warfarin.
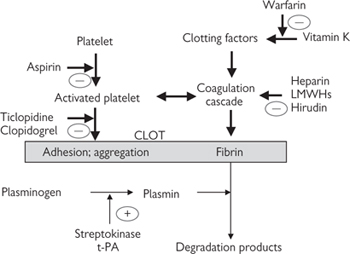
Fig. 6.48 Interventional strategies for preventing thrombosis.